By Artem Dinaburg
Trail of Bits has developed a suite of open-source libraries designed to streamline the creation and deployment of eBPF applications. These libraries facilitate efficient process and network event monitoring, function tracing, kernel debug symbol parsing, and eBPF code generation.
Previously, deploying portable, dependency-free eBPF applications posed significant challenges due to Linux kernel version disparities and the need for external tools for C-to-eBPF bytecode translation. We’ve addressed these issues with our innovative libraries, which use the latest eBPF and Linux kernel features to reduce external dependencies. These tools, ideal for creating on-machine agents and enabling cloud-native monitoring, are actively maintained and compatible with a variety of Linux distributions and kernel releases. Some are even integral to the functionality of osquery, the renowned endpoint visibility framework.
Our eBPF libraries
The libraries in this suite are linuxevents, ebpfpub, btfparse, and ebpf-common. Together they can be used to develop streamlined event monitoring with a high degree of accuracy and efficiency. Their applications range from network event monitoring, function tracing, and kernel debug symbol parsing to assisting in generating and using eBPF code.
linuxevents: A container-aware library for process monitoring with no runtime dependencies
The linuxevents library showcases how eBPF can monitor events without requiring accurate kernel headers or other external dependencies. No more shipping kernel headers, multiple copies of precompiled eBPF bytecode, or dependencies on BCC! The linuxevents library supports runtime code generation to create custom probes at runtime, not just during build. It is also much faster than traditional system-call-based hooking, an essential feature when monitoring events from multiple containers on a single machine. How does linuxevents do this?
First, linuxevents uses the Linux kernel’s BTF debugging data (via our btfparse library) to accurately identify function prototypes and kernel data structures. This allows linuxevents to automatically adjust to variances in data structure layout and to hook arbitrary non-public symbols in a way that greatly simplifies tracing.
This approach is faster than traditional system call based hooking not only because it has to hook fewer things (sched_process_exec vs execve, execveat, etc.) but also because it can avoid expensive correlations. For example, to trace which program on disk is executed via execve, one would normally have to correlate a file descriptor passed to execve with an open call and multiple chdir calls to get the full path of a program. The correlation is computationally expensive, especially on a machine with multiple active containers. The linuxevents library uses an accurate kernel data structure representation to hook just one function and simply extract the path from the kernel’s vfs layer.
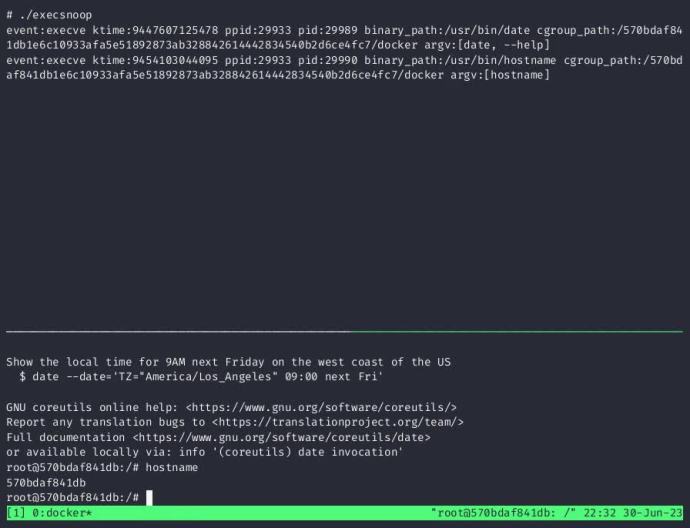
A recording of the linuxevents library being used as a part of the execsnoop example that comes with the library
The linuxevents library is still a proof of concept; it is in use by osquery as a toggleable experiment. The library also has a canonical example of tracing executed processes with cross-container visibility.
ebpfpub: A function-tracing library for Linux
The ebpfpub library allows for monitoring system calls across multiple Linux kernel versions while relying on minimal external runtime dependencies. In ebpfpub, eBPF probes are autogenerated from function prototypes defined via a simple custom language, which can be created from tracepoint descriptors. This approach required proper headers for the running kernel and it came with performance penalties, such as the need to match file descriptors with system calls.
Depending on the desired target event, ebpfpub can use either kernel tracepoints, kprobes, or uprobes as the underlying tracing mechanism. The library includes the following examples:
-
execsnoop: Shows how to use Linux kernel tracepoints to detect program execution viaexecve() -
kprobe_execsnoop: Likeexecsnoop, but uses a different hooking mechanism (kprobes instead of tracepoints) -
readline_trace: Uses uprobes to hook the user-mode readline library, which can enable use cases such as monitoring whenever a live shell is used on a machine -
sockevents: An example of how to trace sockets through a series of connect/accept/bind calls that establish connectivity to a remote machine -
systemd_resolved: Shows how to use uprobes to hook into systemd’s DNS service (systemd-resolved), which will show in real time the domains being looked up by your local machine
The ebpfpub library is currently used by osquery to capture process and socket events by tracing executed system calls. While ebpfpub is still maintained and useful in specific circumstances (like the need to support older kernels and use runtime code generation), new projects should use the linuxevents approach instead.
btfparse: A C++ library that parses kernel debug symbols in BTF format
BTF, or the Binary Type Format, is a compact binary format for representing type information in the Linux kernel. BTF stores data such as structures, unions, enumerations, and typedefs. Debuggers and other tools can use BTF data to enable richer debugging features by understanding complex C types and expressions. BTF was introduced in Linux 4.20 and is generated from source code and traditional debugging information like DWARF. BTF is more compact than DWARF, and it improves the debugging experience by conveying more semantic type information than was previously available. The standardized BTF format also allows new debugging tools to leverage type data across compilers, enabling more consistent quality of introspection across languages.
The btfparse library allows you to read BTF data in your C++ projects and generate header files directly in memory without any external application. The library also comes with a tool, called btf-dump, that serves both as an example of using btfparse and as a standalone tool that can dump BTF data present in a Linux kernel image.
ebpf-common: A C++ library to help write new eBPF-based tools
The ebpf-common library is a set of utilities that assist with generating, loading, and using eBPF code. It is the common substrate that underpins all of our eBPF-related tooling. Use epbf-common to create your own runtime, eBPF-based tools!
The ebpf-common library’s main job is to compile C code to eBPF bytecode and to provide helpful abstractions that make writing eBPF hooks easier. Here are some of the features ebpf-common provides:
- It uses LLVM and clang as libraries that write to in-memory scratch buffers.
- It includes abstractions to make accessing eBPF data structures (hash maps, arrays, ring buffers, etc.) simple. These data structures are used to exchange data between eBPF and your application.
- It includes abstractions to create and read perf outputs, another way eBPF can communicate with the tracing application.
- It allows for the management of events (like kprobes, uprobes, and tracepoints) that trigger the execution of eBPF programs.
- Finally, it includes functions that implement eBPF helpers and related functionality via LLVM.
The ebpf-common library is used as the core of all of our other eBPF tools, which serve as library clients and examples of use cases for ebpf-common for your applications. Refer to our blog post All your tracing are belong to BPF for additional guidance and examples for how to use ebpf-common.
Our eBPF tools
ebpfault: A Linux system call fault injector built on top of eBPF
ebpfault is a system-wide fault injector that does not require risky kernel drivers that could crash the system. It can start a specific program, target running processes, or target all processes except those on a specific list. A simple configuration file in JSON format lets you configure faults by using the syscall name, the probability of injecting a fault, and the error code that should be returned.
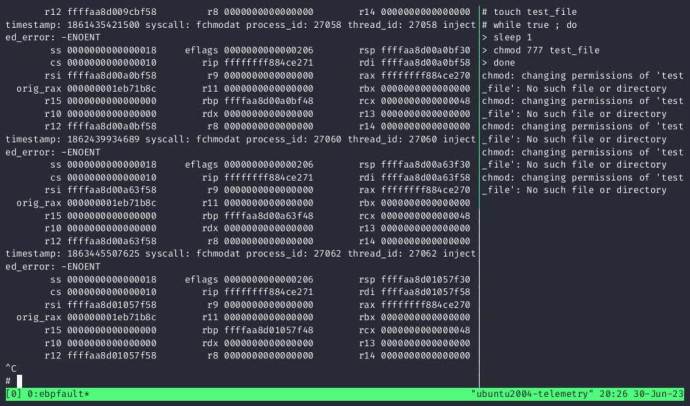
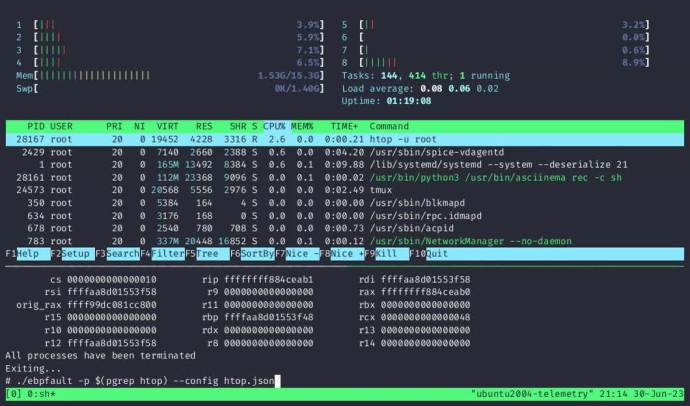
A recording of ebpfault running against the htop process and causing faults via a specific configuration
BPF deep-dives and talks
Most of the material available online is geared toward using the command-line sample tools that demonstrate eBPF, which work mostly as standalone demonstrations and not as reusable libraries. We wanted to fill in the gaps for developers and provide a step-by-step guide on how to actually integrate eBPF from scratch from the point of view of a developer writing a tracing tool. The documentation focuses on runtime code generation using the LLVM libraries.
The All your tracing belong to BPF blog post and our companion code guide show how to use epbf-common to create a tool that uses eBPF to count system calls, with each example increasing in complexity, starting from simple counting, to using maps to store data, to finally using perf events for outputs.
Monitoring Linux events is a talk by Alessandro Gario about using eBPF for event monitoring. Alessandro describes how to dynamically decide on what to monitor and to generate your own eBPF bytecode directly from C++. He touches on some of the intricacies of eBPF maps, perf events, and practical considerations for using our eBPF tools and libraries.
eBPF public contributions
The world of eBPF continues to expand and find applications in various domains. We have explored eBPF as it relates to interesting tasks beyond tracing and performance monitoring, such as improving CI/CD for eBPF bytecode, writing an eBPF-to-ARM64 JIT compiler for the Solana platform, and improving the experience of building eBPF projects on Windows.
ebpf-verifier: Sometimes it is necessary to bundle prebuilt eBPF programs. The Linux kernel “verifies” eBPF programs at load time and rejects any that it deems unsafe. Bundling eBPF bytecode is a CI/CD nightmare because every kernel’s verification is ever so slightly different. ebpf-verifier aims to eliminate that nightmare by executing the eBPF verifier outside of the running kernel and opens the door to the possibility of testing eBPF programs across different kernel versions.
Solana eBPF-to-ARM64 JIT compiler: eBPF makes an appearance in many surprising places! The Solana blockchain uses an eBPF virtual machine to run its smart contracts, and it uses a JIT compiler to compile the eBPF bytecode to native architectures. Trail of Bits ported the Solana eBPF JIT compiler to ARM64 to allow Solana applications to natively run on the now very popular ARM64 platforms like Apple Silicon.
Adding CMake support to eBPF for Windows: eBPF also works on Windows! To make Windows development easier, we ported the prior Visual Studio–based build system to CMake. The improvements include better handling of transitive dependencies and properties, better packaging, and enhanced build settings for a more efficient development experience.
Conclusion
We’ve used eBPF to provide rapid, high-quality monitoring data for system instrumentation agents like osquery. Our intention is that the frameworks and tools we’ve created will assist developers in integrating eBPF into their applications more seamlessly. eBPF is a useful technology with a bright future in a variety of fields, including increasingly in cloud-native monitoring and observation.
We plan to share more of our lessons learned from eBPF tool development in the near future, and we hope to apply some of these lessons to the problems of cloud-native monitoring and observability.
Article Link: Use our suite of eBPF libraries | Trail of Bits Blog