Top 50 Cybersecurity Statistics in 2024 (Essential Insights on Ransomware, Phishing, Industry Trends, and More)
Welcome to our roundup of the Top 50 Cybersecurity Statistics in 2024.
As cyber threats continue to evolve and grow in complexity, staying informed is vital. Aiming to equip you with the knowledge and tools necessary to enhance your cybersecurity posture and stay ahead of potential threats, we analyzed expert reports from cybersecurity organizations and identified trending topics from business perspectives on social media. We also integrated our own research and solutions from SOCRadar to provide a complete picture of the cybersecurity challenges organizations face today.
In this blog, we journey through the most pressing cybersecurity issues, from ransomware and phishing to vulnerabilities and industry-specific threats. These statistics offer valuable insights into the current threat landscape and highlight the areas where improved security measures are needed.
Top 10 Statistics for Ransomware, and Additional Malware Statistics
In recent years, ransomware and malware attacks have surged, creating significant challenges for organizations worldwide. Here are some key statistics and insights into this growing threat landscape.
- Last year, threat actors deployed an average of 200,454 unique malware scripts per day, equating to roughly 1.5 new samples per minute. This continuous barrage highlights the relentless nature of malware attacks.¹
- Among extortion groups, Lockbit 3.0, Clop, BlackCat (ALPHV), Play, and Royal ransomware groups were responsible for 57% of detected cyberattacks in 2023.²
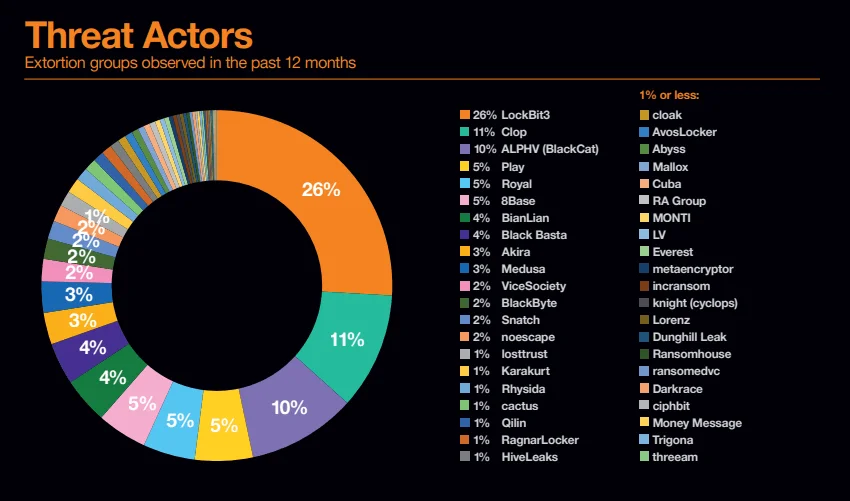
Top extortion groups observed in 2023 (Orange)
- A staggering 93% of organizations that suffered a ransomware attack reported paying the ransom. Of these, 58% were motivated by threats to leak stolen data, underscoring the severe pressure on victims (Perspectives from 1,600+ IT and security leaders).³
- In the first six months of 2023 alone, ransomware extortion costs totaled $176 million more than the entire previous year. This sharp increase indicates the escalating financial impact of such attacks.⁴

You can access detailed information on threat actors, groups, and malware through the SOCRadar platform; with our enhanced Threat Actor Intelligence module, you can easily filter searches and access the latest details on any threat, including their targets, utilities, and Indicators of Compromise (IoCs).
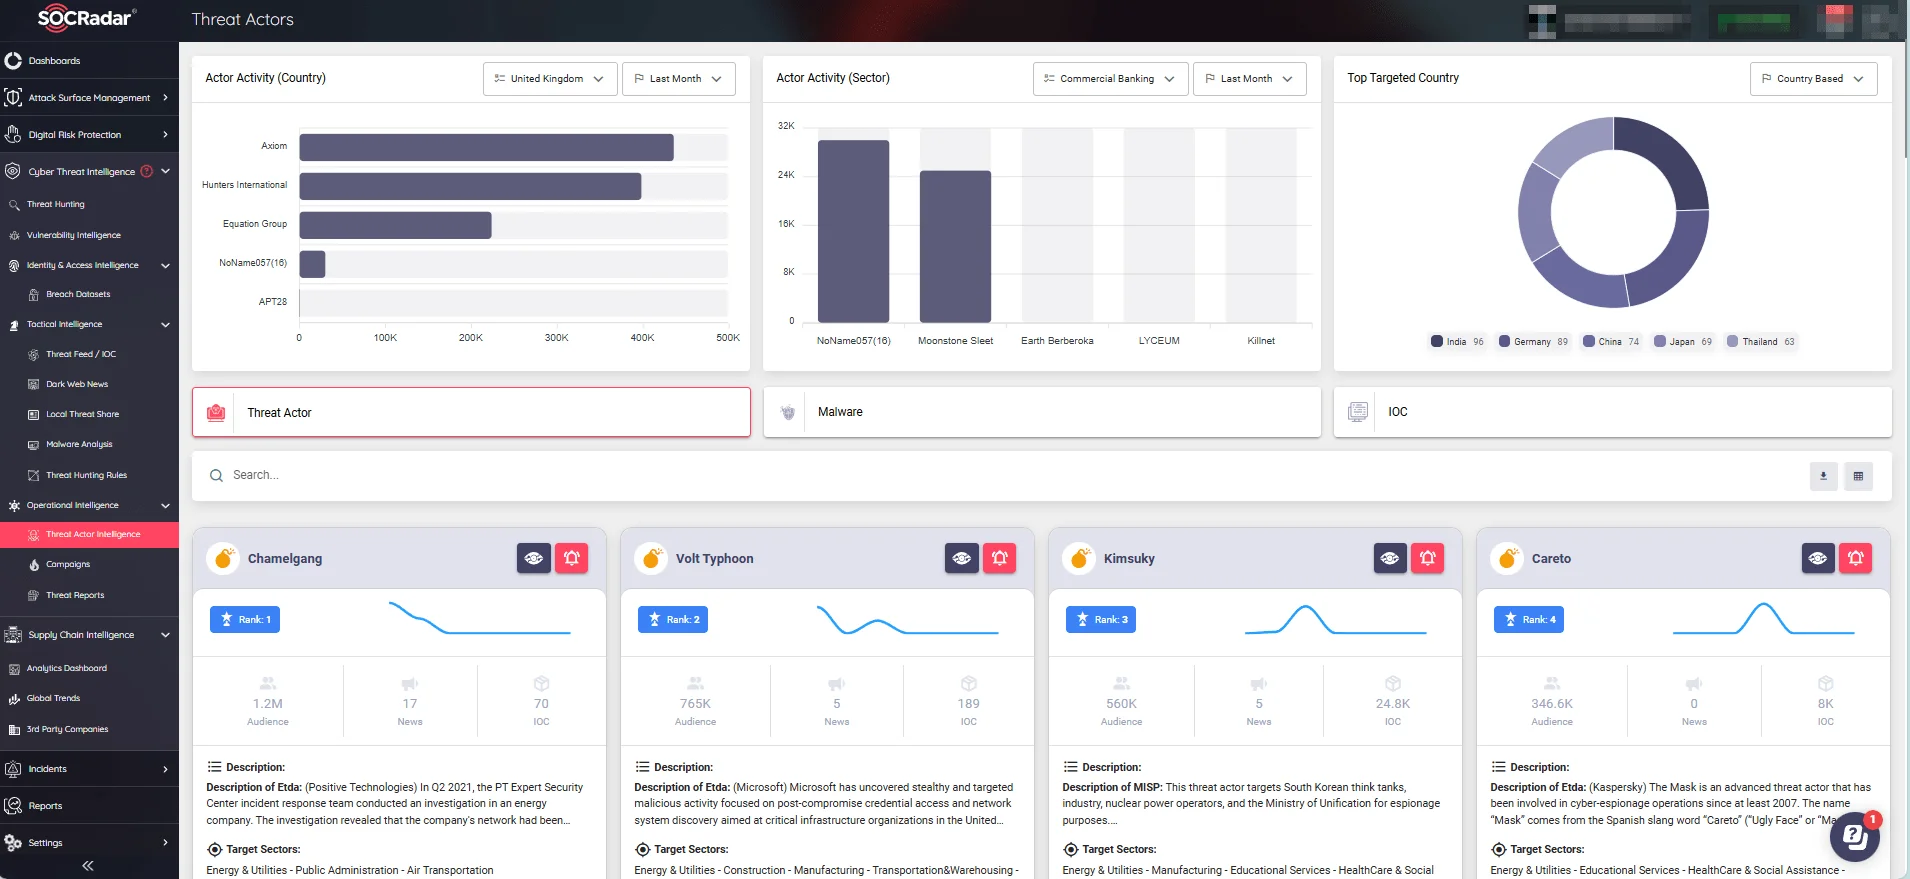
Threat Actor Tracking module (SOCRadar XTI)
- Approximately 10 million personal and corporate devices were compromised with infostealer malware in 2023, marking a 643% increase over the past three years.⁵
- Using infostealers, threat actors stole an average of 50.9 login credentials per infected device in 2023. These credentials often included logins for social media, online banking, crypto wallets, and various corporate services.⁵
- In 2023, 325.9 million login credentials were compromised for websites with the .com domain. Other affected domains included .br (Brazil) with 28.8 million, .in (India) with 8.2 million, .co (Colombia) with 6 million, and .vn (Vietnam) with 5.5 million.⁵
- As of May 2024, RedLine, Raccoon, and Vidar are the three major infostealer malware families dominating the market. These malware variants are prevalent and highly effective in stealing sensitive information.⁶
Explore more about infostealers and their impact by visiting our blogs:Top 10 Stealer Logs and Stealer Malware 101.

- Q1 2024 saw nearly a 20% increase in reported ransomware victims compared to last year’s Q1. This rise occurred despite the disruptions of LockBit and BlackCat (ALPHV), two of the largest ransomware groups.⁷
For more context on law enforcement efforts against these ransomware groups:
- International Authorities Strike Blow Against LockBit Ransomware: Operation Cronos
- ALPHV Seized, Unseized, Decrypted; Pandora’s Box May Be Reopened
- The number of active ransomware groups more than doubled year-over-year, increasing 55% from 29 distinct groups in Q1 2023 to 45 in Q1 2024. This growth indicates a significant rise in organized cybercriminal activity.⁷
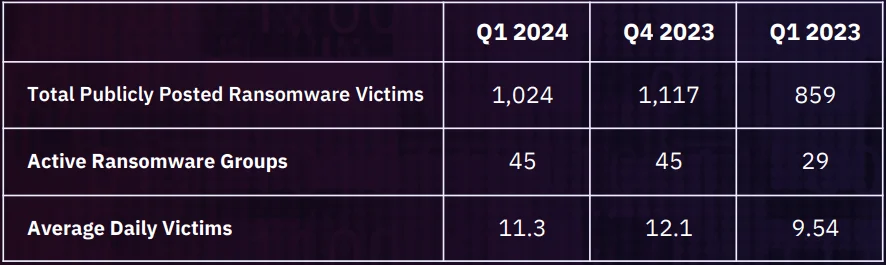
Victim and ransomware counts for Q1 2024, Q4 2023, and Q1 2023 (GRIT)
Learn about the latest methods to detect and prevent ransomware attacks with our 2024 CISO Edition Guide.
Top 10 Phishing Statistics: The Most Prevalent Initial Attack Vector
Phishing continues to be a very significant threat among other initial attack vectors. Here are the top statistics and insights about phishing attacks.
- Phishing attacks are considered the biggest cyber threat by 30% of small businesses. This highlights the acute awareness and concern among smaller enterprises regarding this pervasive threat.⁸
- Email remains the most common vector for malware delivery, with around 35% of malware being delivered via email in 2023.⁸
- A staggering 94% of organizations reported experiencing email security incidents.⁹
- Phishing is the starting point for 79% of Account Takeover (ATO) attacks. This connection demonstrates the critical role phishing plays in facilitating more severe security breaches.⁹
- Over the past year, there has been an 856% increase in malicious email threats.¹⁰
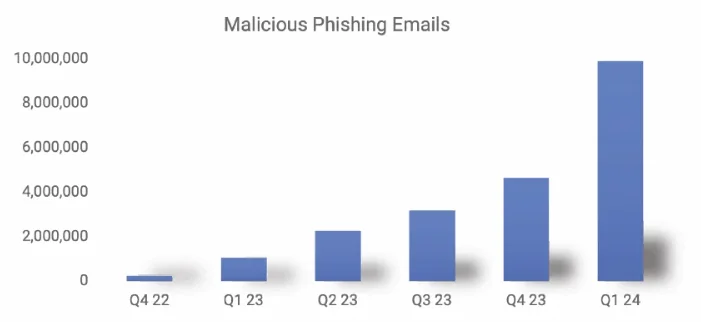
A graph depicting the increase in malicious emails through Q4 2022 – Q1 2024 (SlashNext)
- Phishing remains the most common email attack method, accounting for 39.6% of all email threats.⁴
- Since the launch of ChatGPT by OpenAI in late 2022, there has been a staggering 4,151% increase in malicious emails. This surge illustrates the ways in which advanced AI tools can be leveraged for malicious purposes.¹⁰
You can use SOCRadar LABS’s free Email Threat Analyzer tool to scan EML files for malicious content. In addition to the Email Threat Analyzer service, LABS’ SOC Tools include IP Reputation and Phishing Radar, offering additional measures to avoid phishing attacks.

Email Threat Analyzer on SOCRadar LABS
- Spear phishing attachments were used in 62% of phishing attacks, while links were used in 33%, and Phishing-as-a-Service accounted for 5%.¹¹
- There has been a 71% year-over-year increase in cyberattacks that utilized stolen or compromised credentials.¹¹
- QR code-based phishing attacks now account for 11% of all malicious emails.¹⁰
For more detailed insights on phishing trends in 2024, including the significant increase since the introduction of ChatGPT, visit SOCRadar’s Phishing in 2024 blog post.

Top 10 Statistics on the Rising Costs and Time Impacts of Cybersecurity Threats
The financial and temporal costs associated with cybersecurity threats are escalating, putting significant pressure on organizations globally. Here are the top statistics that highlight the financial impact and time required to manage these threats:
- Global cybercrime damage costs are expected to grow by 15% per year over the next two years, reaching $10.5 trillion USD annually by 2025.¹²
- In the 2024 Gartner CIO and Technology Executive Survey, 80% of CIOs reported plans to increase spending on cyber/information security in 2024. This makes cybersecurity the top technology category for investment, reflecting its importance.¹³

- The average cost of a ransomware attack in 2023 was $4.54 million.¹⁴
- The average cost of a data breach in 2023 was $4.45 million, marking a 2.3% increase from the previous year’s cost of $4.35 million. The consistent rise in these costs emphasizes the escalating financial burden of data breaches.¹⁴
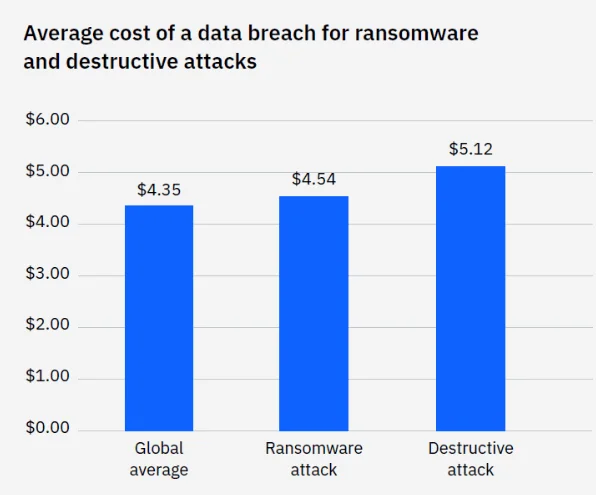
Average costs of cyber threats in 2023 (IBM)
- For the 12th consecutive year, the United States has the highest cost of a data breach, averaging $5.09 million.¹⁴
- It takes an average of 277 days for security teams to identify and contain a data breach.¹⁴
- The average time to identify and contain a data breach involving lost or stolen credentials is 328 days. This extended period highlights the complexities involved in addressing breaches related to compromised credentials.¹⁴
- The annual average cost of cybercrime is predicted to hit more than $23 trillion in 2027, up from $8.4 trillion in 2022.¹⁵
- 63% of ransom demands were for $1 million or more, with 30% exceeding $5 million. These high demands reflect the growing boldness of cybercriminals and the significant financial stakes involved.¹⁶
- Breaches at organizations with a mature cloud security posture took an average of 277 days to identify and contain, compared to 298 days for those without.¹⁴
Top 10 Statistics About Security Vulnerabilities and Exploitation
The rising count of vulnerabilities presents significant challenges and risks for organizations. Here are the key statistics and insights that highlight the state of vulnerability and exploitation trends.
- The National Vulnerability Database (NVD) recorded approximately 29,000 new vulnerabilities in 2023, marking a nearly 15% increase from 2022.¹⁷
- An analysis of 2.5 million unique vulnerabilities revealed that the majority (79%) are rated Medium or High, with nearly 1 in 10 (9.4%) classified as critical.²
- There was a 72% decline in zero-day exploits in 2023 compared to 2022. This decrease suggests improvements in the identification and mitigation of previously unknown vulnerabilities before they can be exploited.¹¹
- In 2023, approximately 63% of applications had first-party code flaws, and 70% had flaws in third-party code.¹⁸
- In 2022, Microsoft accounted for a substantial 27.4% of vulnerabilities listed in the CISA Known Exploited Vulnerabilities (KEV) catalog. However, in 2023, this figure shifted to 15.5%, with Apple holding the second spot at 10.9%, followed by Samsung and Cisco.¹⁹
- While Remote Code Execution (RCE) vulnerabilities dominated the CISA KEV list in 2022, privilege escalation emerged as the top vulnerability type in 2023, accounting for 12.1% of reported vulnerabilities.¹⁹
Here’s a 2023 Review of the CISA Known Exploited Vulnerabilities (KEV) Catalog for more insights.
- 75% of vulnerabilities were exploited within 19 days of publication, and 25% within the first 25 days.²⁰
- More than 50% of the 206 high-risk vulnerabilities tracked in 2023 were actively exploited by threat actors, ransomware, or malware.²⁰
- In 2023, around 7,000 vulnerabilities had Proof-of-Concept (PoC) exploit code available. The availability of PoC exploit code can significantly increase the likelihood of vulnerabilities being exploited in the wild.²⁰
- The average time between public disclosure of a vulnerability and the availability of exploit code is now approximately 14 days.²⁰
SOCRadar’s Vulnerability Intelligence provides organizations with real-time insights into emerging vulnerabilities and hacker trends.
By continuously monitoring and analyzing data from various sources, SOCRadar helps identify critical vulnerabilities that could impact your systems. Our platform offers detailed reports, risk assessments, and actionable insights, enabling organizations to prioritize and address vulnerabilities swiftly.
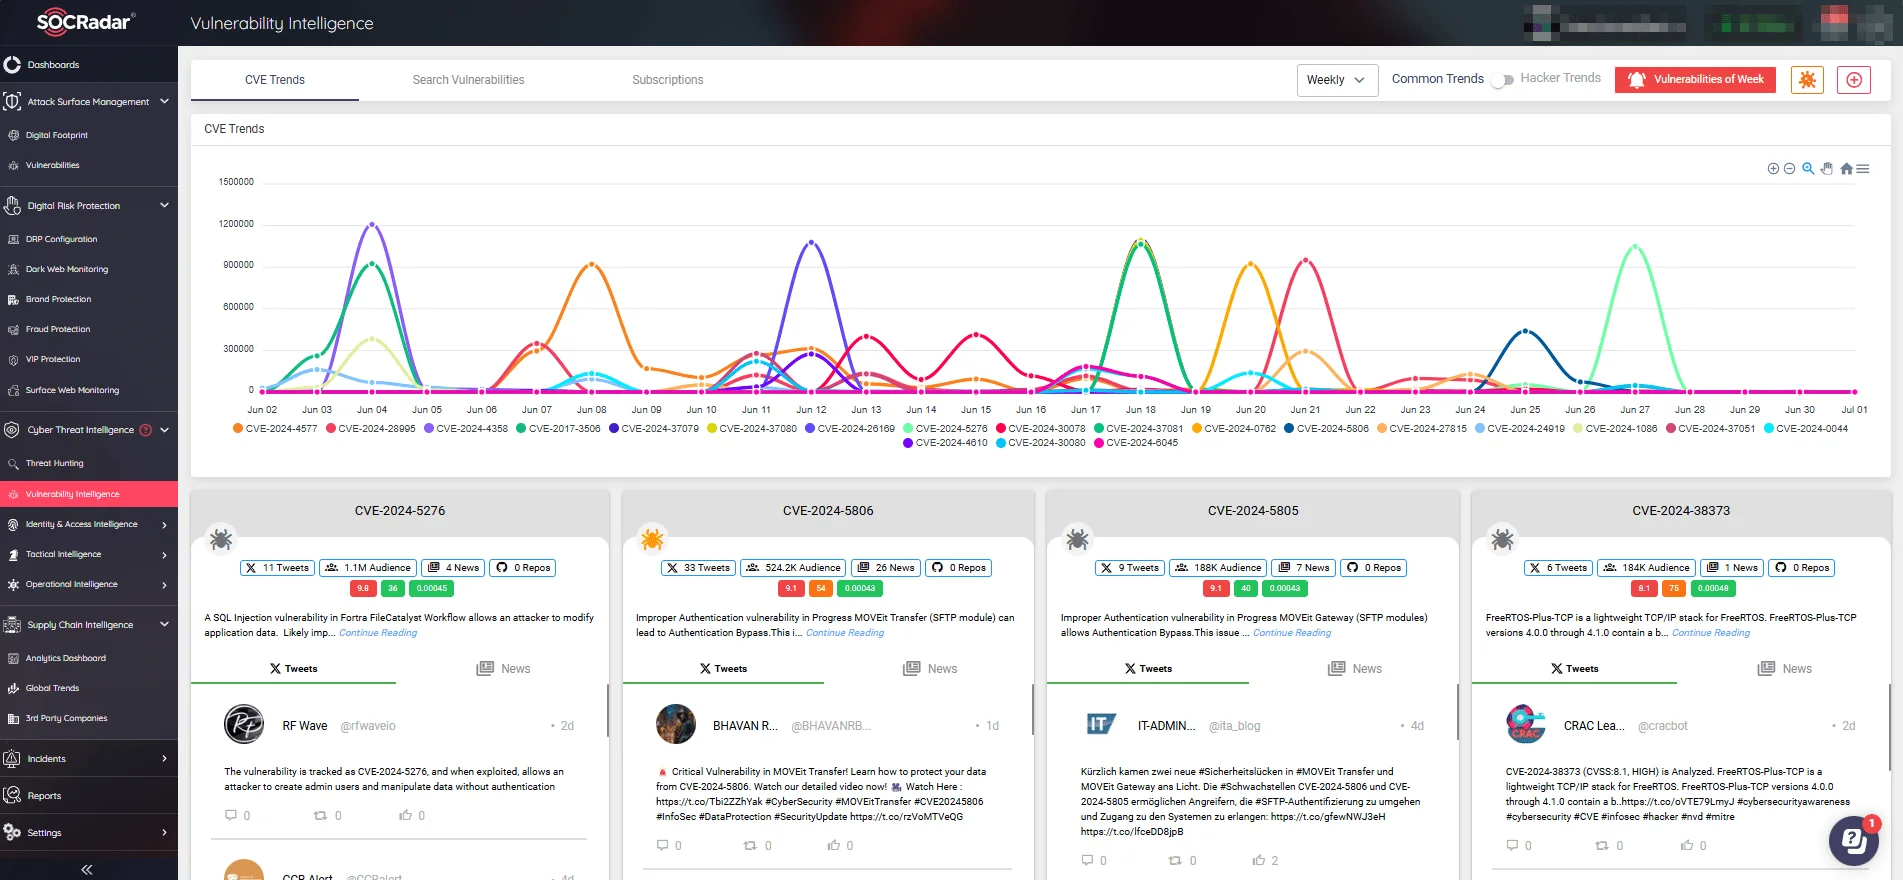
Vulnerability Intelligence module (SOCRadar XTI)
Top 10 Statistics on Cyber Threats Across Industries and Countries
Cybersecurity threats vary significantly across different industries and countries. Here are the top statistics that illustrate the diverse impact of cyber attacks on various industries and countries.
- Large enterprises were the most affected by cyber extortion, with 40% of incidents targeting them. Small organizations and medium-sized businesses followed, with 25% and 23% respectively.²
- In healthcare-related cyber incidents, reconnaissance activities accounted for 50% of all observed cases. Attackers often scout for vulnerabilities and valuable data, emphasizing the need for early-stage threat detection in the healthcare sector.¹¹
- The manufacturing sector saw the most confirmed cyber incidents in 2023, contributing 32.43% of the total. Retail Trade followed with 21.73%, and Professional, Scientific, and Technological Services accounted for 9.84%. These sectors remain prime targets due to their critical operational and financial data.²
- In the financial and insurance sectors, 74% of attacks compromised clients’ personal details.⁸
- Educational institutions faced significant cyber threats, with 29% of attacks originating from vulnerability exploitation and 30% from phishing campaigns.²¹
- Ransomware attacks on K-12 and higher education globally resulted in over $53 billion in downtime costs from 2018 to mid-September 2023.²²
- The United States was by far the most targeted country for cyberattacks in 2023, with 168 threat actors, followed by the U.K. (88), Germany (77), India (72), and Japan (66).²³
- In 2023, China (155), Russia (88), and Iran (45) together accounted for nearly half of all identified threat groups globally.²³
- In Q4 2023, phishing attacks targeted the following industries: social media (43%), SaaS/webmail (15%), financial institutions (14%), e-commerce/retail (6%), logistics/shipping (5%), payment (4%), telecom (3%), crypto (1%), and others (9%).²⁴
- China-originated espionage surged across 39 global industry sectors and 20 geographic regions.²⁵
Access current reports specific to your industry or country through SOCRadar LABS. These reports provide detailed information on the prevalence of various cyber threats targeting your sector or region, along with many quick insights.
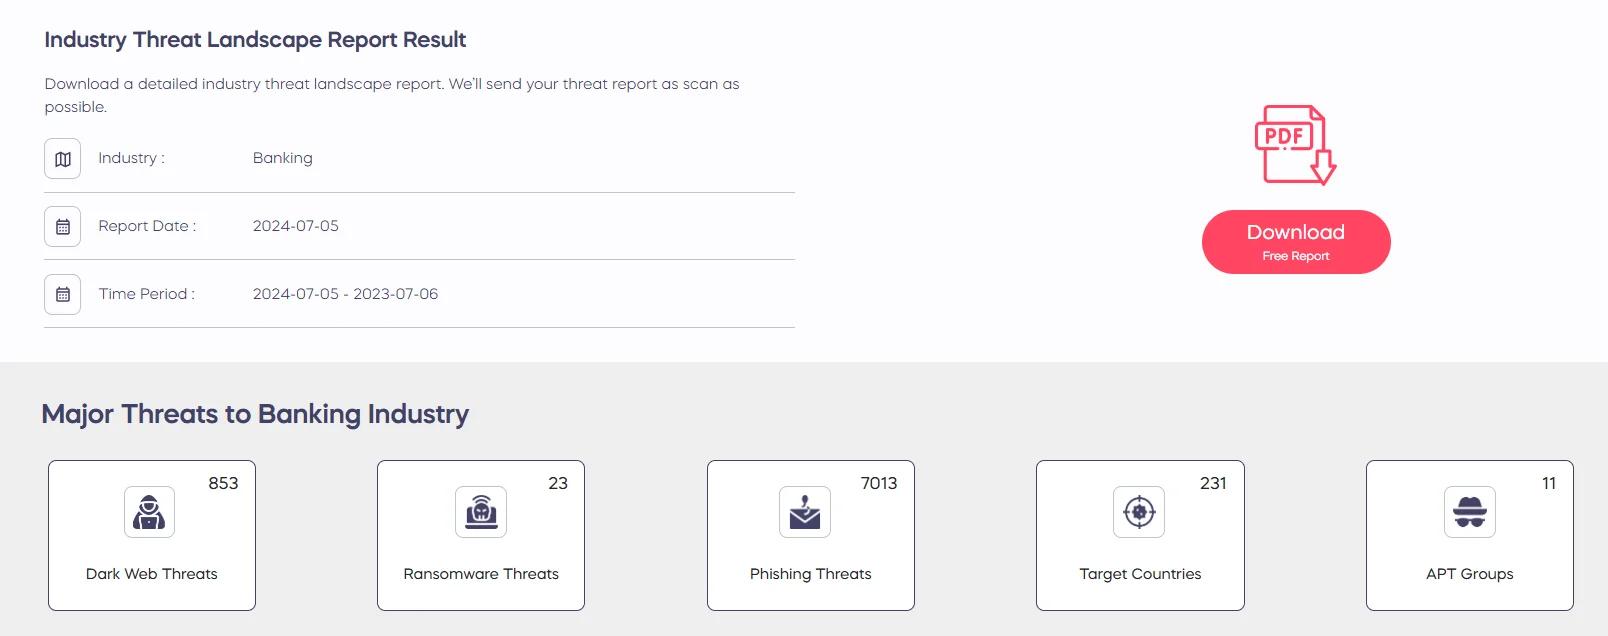
Get free, instant Industry and Country Threat Landscape reports on SOCRadar LABS
AI, Cybersecurity, and Cybercriminals
Artificial Intelligence (AI) has revolutionized cybersecurity, offering advanced methods for protection and automation. However, it has also introduced new challenges. The use of generative AI by cybercriminals has significantly increased the complexity and frequency of attacks. In fact, 85% of cybersecurity professionals link the recent surge in cyberattacks to AI’s capabilities.
As a supporting fact, since the launch of ChatGPT, there has been a staggering 4,151% increase in phishing attacks.
John-David Lovelock, VP Analyst at Gartner, highlighted that “AI has created a new security scare for organizations.” As a result, Gartner anticipates double-digit growth in enterprise security spending for 2024, reflecting the urgency for businesses to enhance their defenses against AI-driven threats.
Organizations that have fully implemented AI and automation in their security infrastructure are seeing tangible benefits. According to IBM’s 2023 report, these organizations reduced the time to identify and contain breaches to an average of 263 days, compared to 315 days for those without such technologies.
As AI continues to advance, it is crucial for organizations to adopt AI-driven security solutions. These technologies not only mitigate risks but also ensure quicker, more efficient responses to cyber threats. The future of cybersecurity lies in balancing AI’s innovative potential with robust, proactive defense strategies.
Conclusion
With threats such as ransomware, phishing, and vulnerabilities posing significant risks across various industries and regions, it is essential to stay updated with all the changes and trends. Our top 50 statistics highlight the growing complexity of these threats, informing you of the current trends.
To effectively combat cyber threats in 2024, organizations must adopt proactive measures, including AI-driven security solutions, regular vulnerability assessments, and comprehensive cyber threat intelligence.
SOCRadar provides a rich set of tools and services to help your organization safeguard their digital assets. Our platform offers advanced threat intelligence, automated vulnerability management, dark web monitoring, and real-time threat detection. With swift alerts and actionable insights, SOCRadar enables you to stay ahead of potential risks. Our approach ensures that businesses can detect, analyze, and respond to threats promptly and effectively.
Stay secure with SOCRadar, your trusted partner in cybersecurity.

References:
- +65 Malware Statistics for 2024 | StationX
- Security Navigator 2024 | Orange
- The State of Data Security | Rubrik
- Top Cybersecurity Statistics for 2024 | Cobalt
- Data-stealing malware infections increased sevenfold since 2020 | Kaspersky
- Infostealer Malware: Top Stealers in 2024 | Gridinsoft
- GRIT Ransomware Report-2024-Q1 | GuidePoint
- 2024 Data Breach Investigations Report | Verizon
- 2024 Email Security Risk Report | Egress
- The State of Phishing 2024 | SlashNext
- X-Force Threat Intelligence Index | IBM
- A United Response To Cyber Risk | Forbes
- Worldwide IT Spending to Grow 8% in 2024 | Gartner
- Cost of a data breach 2023 | IBM
- Cyberattacks to cost $23 trillion in 2027 | ABS-CBN News
- 2024 Ransomware Report | Sophos
- NVD Dashboard
- State of Software Security 2024 Report | VeraCode
- 2023 Review of the CISA KEV Catalog | SOCRadar
- A Review of 2023 | SOCRadar, 2023 Threat Landscape Year in Review | Qualys
- H2 2023 Cyber Threat Intelligence Threat Report | Critical Start
- Ransomware attacks on schools | Comparitech
- US suffered cyberattacks from 168 threat actors in 2023 | Security Magazine
- Phishing Trends Report Q4 2024 | APWG
- 2023 Global Threat Report | CrowdStrike