It’s about time I got some more technical content on my blog and after presenting at the Malware Reverse Engineering conference in February and seeing a presentation on Tofsee, I decided to do my own analysis of Tofsee.
I downloaded a Tofsee sample (at least it was tagged as ‘Tofsee’) from Malware Bazaar. The sample’s SHA256 hash is 9aded5733ec844d31a675d461968a7f3dffd3b2287cb932e8442d09c8cb2bd20.
Let’s get started with some static analysis by running strings(1) on the malware sample:
$ strings sample.exeDoing so shows a few of my favourite strings:
| String | Comment |
| Microsoft Visual C++ Runtime Library | C++ code uses ecx/rcx register as this pointer — a pointer to the current instance of an object |
| Attempt to use MSIL code from this assembly during native code initialization | |
| GetUserObjectInformationA | Don’t know what this could be used for, but it sounds interesting and is probably worth looking into |
| Dijirobebager wezisisoxewana domese nizazo foditebex xeyayazehiwaj vilokemabezomawifo cicokirafinibirozatuwaj | Interesting looking strings |
| C:\nar\manocacu.pdb | Path to a debug symbol file. These can often reveal user names (C:\Users\…\…) but can also reveal third party software libraries/code. Nothing overly obvious in this case though. |
| CreateFileA WriteFile | It creates files. We should hook these to see what file(s) it is creating, and where |
| FindFirstChangeNotificationW | Watches for changes to file system directories. I haven’t seen this used before, so it’ll be interesting to see what this sample does with it |
| CreateHardLinkA ReadEventLogW GetFileAttributesW UnhookWinEvent | Interesting to see what this sample does with these |
| Sleep | Potential anti-analysis technique of pausing to thwarte sandboxing |
| TerminateProcess | May terminate security software |
| IsDebuggerPresent QueryPerformanceCounter GetTickCount | Anti-debug |
| GetCommandLineA | We need to look at this to see if the sample is looking for specific command line arguments |
| GetProcAddress | Used to find address of DLL functions after manually loading a library, but also used after unpacking |
| Copyright (c) 1992-2004 by P.J. Plauger, licensed by Dinkumware, Ltd. ALL RIGHTS RESERVED. | Strings like these often reveal the use of third-party libraries/code. In this case, a search revealed a Wikipedia page for P.J. Plauger which states that ‘The company has provided the C++ Standard Library implementation that ships with Microsoft Visual C++ since 1996’ |
Running strings -el (to extract strings of little-endian 16-bit characters, such as UTF-16) also shows some interesting strings. These are from the resources section, which we’ll look at next:
| String | Comment |
| VS_VERSION_INFO StringFileInfo 042831F2 FileDescription GangBang LegalCopyright Copyright (C) 2022, Combat OriginalFilename petshop.exe ProductsVersion 100.35.9.96 ProductName Bagspreeds ProductionVersion 52.82.22.42 VarFileInfo Translation | These strings show product and version information, and if we extract the resources we find that all of these strings are in the _16_1400_1094 (type 16, name 1400, language 1094) resource file (strings -fel * will give you the filename which, coupled with wrestool‘s naming convention, tells you which resource contains the strings). Resource type 16 is RT_VERSION (defined in winuser.h), the resource containing version information. Never-the-less there are some interesting strings in there, including ‘petshop.exe’ which makes me think of the Pet Shop Boys, and ‘Bagspreeds’ which makes me think of Bagpuss (those were the days — /me reminisces). Internet searches for those two strings don’t show anything interesting (apart from a pet shop simulator). Those version strings could be IPv4 addresses, or they could just be version strings. Further analysis will tell. The copyright string doesn’t reveal much either, and I know better than to try searching for ‘GangBang’. |
| 6Punuwotedez lohahegelipijuy hidefixi kaxogite cicusuco 1Vuvoyiw lacawoy sufahudib caji papubahamon nemazo | We have some more of these interesting strings, this time in UTF-16 encoding. These strings were found in the two strings resources (type 6: RT_STRING). This resource section will allow programs to store multiple language versions of a given string and retrieve the appropriate one using the LoadString() Win32 API call. Given that these strings, and the similar ASCII looking strings mentioned earlier, don’t show up in either of the dumped memory blocks, nor in the embedded executable file, I’m guessing that these strings are decoded as part of the unpacking. It would be interesting to find out how they are used so that we can potentially identify similar activity in other malware samples. |
A quick bit of static analysis with objdump(1) (this command generated a lot of output so I’ve only included relevant snippets):
$ objdump -x sample.exe
sample.exe:     file format pei-i386
sample.exe
architecture: i386, flags 0x0000012f:
HAS_RELOC, EXEC_P, HAS_LINENO, HAS_DEBUG, HAS_LOCALS, D_PAGED
start address 0x00408716

Characteristics 0x102
        executable
        32 bit words

Time/Date               Sat Jul  9 17:17:31 2022
Magic                   010b    (PE32)
...
The Data Directory
Entry 0 00000000 00000000 Export Directory [.edata (or where ever we found it)]
Entry 1 0002d550 00000078 Import Directory [parts of .idata]
Entry 2 0201e000 00027978 Resource Directory [.rsrc]
Entry 3 00000000 00000000 Exception Directory [.pdata]
Entry 4 00000000 00000000 Security Directory
Entry 5 02046000 0000120c Base Relocation Directory [.reloc]
Entry 6 00001230 0000001c Debug Directory
Entry 7 00000000 00000000 Description Directory
Entry 8 00000000 00000000 Special Directory
Entry 9 00000000 00000000 Thread Storage Directory [.tls]
Entry a 00003900 00000040 Load Configuration Directory
Entry b 00000000 00000000 Bound Import Directory
Entry c 00001000 000001dc Import Address Table Directory
Entry d 00000000 00000000 Delay Import Directory
Entry e 00000000 00000000 CLR Runtime Header
Entry f 00000000 00000000 Reserved
...
There is an import table in .text at 0x42d550

The Import Tables (interpreted .text section contents)
 vma:            Hint    Time      Forward  DLL       First
                 Table   Stamp     Chain    Name      Thunk
 0002d550       0002d5dc 00000000 00000000 0002dac4 00001014

        DLL Name: KERNEL32.dll
        ...

 0002d564       0002d77c 00000000 00000000 0002db4e 000011b4

        DLL Name: USER32.dll
        vma:  Hint/Ord Member-Name Bound-To
        2dad2      53  CharToOemBuffW
        2db38     218  EnumDesktopWindows
        2db2a      39  ChangeMenuW
        2db14     331  GetMessageExtraInfo
        2db02     727  UnhookWinEvent
        2daf0      56  CharUpperBuffA
        2dae4     481  LoadMenuW
...
shows the imports, and also that we have a resources section (data directory entry 2 — Resource Directory — is non-zero), so we should have a poke around in there and see if anything falls out.
Interestingly there is a set of strings that are user32.dll exports that show up in the strings(1) output, but don’t show up in the imports reported by objdump(1). It could be worth looking for references to those strings to see if they are used and, if so, for what. Those ‘bogus’ import strings also show up way before the strings pertaining to the actual imports.
Let’s open the sample in a debugger and see if we can find references to those bogus import strings. To do this, though, we need to map the location in the file to the location in memory. Running the following strings(1) command will give us the file offset of the strings:
# -tx gives us the offset (-t) in hex (x)
$ strings -tx sample.exe
   2860 GetProcessWindowStation
   2878 GetUserObjectInformationA
   2894 GetLastActivePopup
   28a8 GetActiveWindow
   28b8 MessageBoxA
   28c4 USER32.DLL
There are our strings of interest, as opposed to the strings pertaining to actually imported user32.dll functions which, as you can see (from the list of imports reported by objdump(1)), appear much later in the sample PE file:
  2ced4 CharToOemBuffW
  2cee6 LoadMenuW
  2cef2 CharUpperBuffA
  2cf04 UnhookWinEvent
  2cf16 GetMessageExtraInfo
  2cf2c ChangeMenuW
  2cf3a EnumDesktopWindows
  2cf4e USER32.dll
Now those offsets are the offset of the strings in the sample PE file. When the file is loaded into memory by the debugger (or by Windows), the PE file is not loaded as one contiguous block of data. That is the file isn’t just loaded as-is into memory. Instead the various sections of the file are loaded at different memory addresses. So how do we find where the strings end up in memory? That’s where objdump(1) comes in, and why we asked strings(1) to output the offsets in hex:
$ objdump -h sample.exe

sample.exe:     file format pei-i386

Sections:
Idx Name          Size      VMA       LMA       File off  Algn
  0 .text         0002d06c  00401000  00401000  00000400  2**2
                  CONTENTS, ALLOC, LOAD, READONLY, CODE
  1 .data         00001e00  0042f000  0042f000  0002d600  2**2
                  CONTENTS, ALLOC, LOAD, DATA
  2 .rsrc         00027978  0241e000  0241e000  0002f400  2**2
                  CONTENTS, ALLOC, LOAD, READONLY, DATA
  3 .reloc        0000a6bc  02446000  02446000  00056e00  2**2
                  CONTENTS, ALLOC, LOAD, READONLY, DATA
As you can see, that objdump(1) output is giving us the file offset, size, and virtual memory address of each section. This will allow us to map a location (offset) in the sample file to a virtual memory address.
So our bogus user32.dll import strings start at offset 0x2860 in the file (see strings(1) output above). From the above output we can see that that offset falls within the .text section (as expected) which goes from offset 0x400 (File off) to 0x2d46c (being File off of 0x400, + Size of 0x2d06c — I can’t believe I just used the bc(1) command to do that addition!).
Subtracting the section starting offset in the file (.text section’s File off of 0x400) from our string offset (0x2860 from the strings(1) output) will tell us how far the string is into the .text section. I’m going to do this calculation in my head and get 0x2460. Add the virtual memory address (VMA) where the section is expected to be loaded (0x401000) and we get 0x403460.
Note that objdump(1) gives us both a virtual memory address (VMA) and a load memory address (LMA). Now I’ve spent quite a bit of time trying to understand the difference, and as far as I can tell the VMA is the address that the section will run from, and the LMA is the address at which the section is loaded. “What’s the difference?” I hear you ask, because I asked the same question. There generally isn’t with Windows PE files running on a PC because the Windows loader loads the sections directly to the memory address from which they’ll run.
The VMA and LMA may be different if the section is loaded at a particular address in memory and then copied to another address before running. This tends to happen more with embedded devices where the section may be loaded from the file into ROM (Read-Only Memory)/flash when setting the device up/programming it, and then code in the system’s ROM copies the section from ROM into RAM (Random Access Memory — writeable) before running it. In this case the LMA tells the copying code where to read the code from, and the VMA tells it where to copy the code to.
My curious mind then started wondering what would happen if I modified a PE file and changed one of the addresses so that the VMA and LMA were no longer the same, and then loaded the file in a debugger to see where it ended up. However, when I examined the format of a PE file section header, there weren’t separate VMA and LMA address fields, but rather only one virtual address field. Suggesting that Windows/PE files don’t need the LMA address.
Continuing on that tangent I then thought what about ELF files on Linux. So I checked the format of ELF files only to find that ELF files have segments and sections. The segments each have a virtual address (v_addr) and a physical address (p_addr) field, but I then quickly found that in order to see what happens if they differ I’d need to be more proficient with gdb(1) than I currently am, so I had a cup of tea, and turned my attention back to Tofsee. I’ll leave experimenting with the VMA/LMA addresses for another time.
Returning to Tofsee then, with a good cuppa and a home-made chocolate brownie, let’s load the sample into a debugger of choice and look at offset 0x403460:
00403460  47 65 74 50 72 6F 63 65 73 73 57 69 6E 64 6F 77  GetProcessWindow
00403470  53 74 61 74 69 6F 6E 00 47 65 74 55 73 65 72 4F  Station.GetUserO
00403480  62 6A 65 63 74 49 6E 66 6F 72 6D 61 74 69 6F 6E  bjectInformation
00403490  41 00 00 00 47 65 74 4C 61 73 74 41 63 74 69 76  A...GetLastActiv
Bingo — there’s the start of our ‘bogus’ import strings. If using x64dbg, select the byte at address 0x403460, right-click and select ‘Find References’ (or press CTRL-R), and x64dbg shows the following references:
| Address | Disassembly |
| 004169C0 | push sample.403460 |
So there’s only one identified location (0x4169c0) that references the string at 0x403460. Disassembling (with Ghidra) around that address (to get some context) we see the following:
| Address | Disassembly | Comment/Label |
| 004169a1 | MOV dword ptr [ESP],s_GetUserObjectInformationA_00 | = “GetUserObjectInformationA” |
| 004169a8 | PUSH EDI | |
| 004169a9 | MOV [DAT_0043184c],EAX | = ?? |
| 004169ae | CALL ESI=>KERNEL32.DLL::GetProcAddress | |
| 004169b0 | PUSH EAX | |
| 004169b1 | CALL __encode_pointer | undefined __encode_pointer(undefined4 param_1) |
| 004169b6 | POP ECX | |
| 004169b7 | MOV [DAT_00431854],EAX | = ?? |
| 004169bc | TEST EAX,EAX | |
| 004169be | JZ LAB_004169d4 | |
| 004169c0 | PUSH s_GetProcessWindowStation_00403460 | = “GetProcessWindowStation” |
| 004169c5 | PUSH EDI | |
| 004169c6 | CALL ESI=>KERNEL32.DLL::GetProcAddress |
The test/jz instruction combination at 0x4169bc is going to determine whether or not the bogus import string is accessed or not at 0x4169c0. Originally I disassembled this in x32dbg and the code looked like it was preparing for a GetProcAddress(hModule, lpProcName) call at 0x4169c6 — calling a function with two arguments, the second of which is the name of a Win32 library function — and looking back through the disassembly I could see that edi was set to the hModule returned by LoadLibrary(), and that esi was in fact set to GetProcAddress (note that if you just load the sample into x32dbg and disassemble from the above address without having ran the sample up to that address, then you can’t rely on the edi and esi values mentioned in the comments1).
While there are functions called between those edi and esi assignments and the above snippet, and those functions may modify edi and/or esi, the code snippet is following the pattern of a GetProcAddress() call, so I’d be guessing that they don’t. Note that Ghidra actually analyses the code and determines that esi at that point actually contains the address of GetProcAddress(), as shown in the above disassembly, and hence we know that the call esi instruction at 0x4169c6 is calling GetProcAddress().
x64dbg on the other hand is obviously not analysing the code to that extent (even after running ‘analyse module’) because it adds a comment saying that esi at the call esi instruction at 0x4169c6 is the entry point address, because at the moment of disassembly the debugger is sitting at the entry point breakpoint where esi contains the entry point address. That is, x64dbg comments are showing you the current value of the registers/memory addresses, which is not necessarily the value of the same registers/addresses when control reaches the address of the instruction (another example of why it is important to know what your tools are actually doing, because the value x64dbg has put in the comments field at this point is incorrect).
Having said all that, I’m not going to concentrate on the contents of the esi register at that call instruction at the moment because I’m questioning whether or not that code is ever executed, given the conditional jump before it is checking a byte in memory which, upon inspection in the debugger, is in fact zero and hence the jump will be taken (and also based on the fact that I’d seen obviously dead code — code that will never run — during some earlier analysis of the sample).
The value referenced by the test instruction at 0x4169bc could be a loop control variable, or a flag, that is set elsewhere to cause the code after the conditional jump to execute after the first iteration of a loop, or under certain conditions. The question is, is there any code that will modify that byte? Let’s select the address 0x431854 in x64dbg’s Dump section and press CTRL-R (find references):
| Address | Disassembly |
| 004169B7 | mov dword ptr ds:[431854],eax |
| 004169DD | cmp dword ptr ds:[431854],ebx |
| 004169EB | push dword ptr ds:[431854] |
There is only one instruction that modifies the byte at address 0x431854, and hence that determines whether or not the code at 0x4169c0 runs, and that’s the mov instruction at 0x4169b7. Disassembling the instructions leading up to that instruction (in Ghidra this time) we see:
| Address | Disassembly | Comment/Label |
| 004169a1 | MOV dword ptr [ESP],s_GetUserObjectInformationA_00 | = “GetUserObjectInformationA” |
| 004169a8 | PUSH EDI | |
| 004169a9 | MOV [DAT_0043184c],EAX | = ?? |
| 004169ae | CALL ESI=>KERNEL32.DLL::GetProcAddress | |
| 004169b0 | PUSH EAX | |
| 004169b1 | CALL __encode_pointer | undefined __encode_pointer(undefined4 param_1) |
| 004169b6 | POP ECX | |
| 004169b7 | MOV [DAT_00431854],EAX | = ?? |
This shows that the value in the eax register when control reaches the test instruction at 0x4169bc is the output from __encode_pointer(GetProcAddress(hModule, “GetUserObjectInformationA”)). __encode_pointer() calls EncodePointer(), but this doesn’t show up in Ghidra’s function call graph. Ghidra’s function call graph isn’t picking the eax = GetProcAddress(hModule, “EncodePointer”); call eax construct up as a call to EncodePointer(). If we’d relied soley on the function call graph, we’d think that __encode_pointer() doesn’t call EncodePointer() (again, know your tools and verify information that you’re going to be drawing conclusions from).
I’ll confess, the first time I saw that __encode_pointer() function name I was thinking mouse pointer for some reason, possibly because I’d just been looking at resources which was showing cursors and icons and the like — GUI objects. This shows the importance of not assuming that you know something, or know what something does. If you’re not certain, look it up, or come up with a way of finding out.
So what is pointer encoding? It is a way of thwarting attacks that modify function pointers in memory for nefarious purposes (to alter control flow; to cause unintended data modification potentially leading to privilege escallation; to put your computer’s processor into an nth-complexity infite binary loop; or to recalibrate your refrigerator’s coolness setting so all your ice-cream goes melty — the latter two are obviously part of a hoax/joke, although with the Internet of Things going the way that it is, that latter one may soon be a reality, if it isn’t already).
The idea behind pointer encoding is that any pointers that are going to be stored in memory, specifically stored in global variables that can be accessed from anywhere else in the program, are encrypted with a process-specific key before storage.
Pointer encoding prevents malicious code from obtaining the value of the pointer and, if the pointer is checked for validity upon/after decoding, protects against changes to the pointer. In this case, the function is encoding the return value from GetProcAddress(hModule, “GetUserObjectInformationA”) — the address of the GetUserObjectInformationA() library function — before storing it, and then the test instruction at 0x4169bc is checking that the stored value is not null (zero) before using it.
Just disassembling that code snippet in Ghidra rather than in x32dbg showed that Ghidra is recognising standard C runtime functions, and that you can see them along with their prototype/signature2 if you select the Window -> Functions menu item.
Thinking that that information would be useful in x32dbg, I got distracted and started writing a Python script to take an exported function list from Ghidra and spit out an x64dbg database import file. Turns out that this was quite useful.
I ran my brand new Python script on an exported function list from Ghidra (select all the functions in the ‘functions’ window pane by clicking on the first and shift clicking on the last, then right-click and select the Export -> Export to CSV… menu item). The exported CSV file looks like this:
"Name","Location","Function Signature","Function Size"
"bad_exception","00404210","undefined bad_exception(bad_exception * this\, char * param_1)","28"
"FUN_0040422c","0040422c","undefined FUN_0040422c()","11"
"FUN_00404237","00404237","undefined FUN_00404237(undefined1 param_1)","31"
"FUN_00404256","00404256","undefined FUN_00404256(undefined1 param_1)","28"
"FUN_00404272","00404272","undefined FUN_00404272()","11"
My script spat out a JSON file which can be imported as a database into x64dbg. The output includes a ‘labels’ and a ‘functions’ entry for each function, with the ‘functions’ entry specifying the module, start address, and end address of the function. The label specifies the function’s name, or in this case its prototype:
{
  "labels": [
    {
      "manual": true,
      "module": "sample.exe",
      "address": "0x4210",
      "text": "undefined bad_exception(bad_exception * this\\, char * param_1)"
    },
    {
      "manual": true,
      "module": "sample.exe",
      "address": "0x43A3",
      "text": "void ~CMFCToolBarsListCheckBox(CMFCToolBarsListCheckBox * this)"
    }
    ...
  ],
  "functions": [
    {
      "manual": true,
      "module": "sample.exe",
      "start": "0x4210",
      "end": "0x422C",
      "icount": "0"
    },
    {
      "manual": true,
      "module": "sample.exe",
      "start": "0x43A3",
      "end": "0x43BC",
      "icount": "0"
    }
    ...
  ]
}
After I imported that output into x64dbg (File -> Database -> Import database menu in x64dbg, after loading the sample) and scrolled back to the start of the function containing 0x4169b7, I saw a label that x64dbg had added using the function information (from Ghidra) that I had just imported:
| Address | Disassembly | Comment/Label |
| 00416923 | mov edi,edi | int ___crtMessageBoxA(LPCSTR _LpText\, LPCSTR _LpCaption\, UINT _UType |
| 00416925 | push ebp | |
| 00416926 | mov ebp,esp | |
| 00416928 | sub esp,14 |
It would seem that I’m analysing ___crtMessageBoxA(), which is a standard C runtime (crt) function, so I’ll stop that now and look for something with more maliciousness about it.
Note that there have been cases of malware modifying standard runtime functions, but a quick scroll through that function, with Ghidra’s function names imported, shows it calling GetProcAddress() for message box related functions, and __encode_pointer(), and looking at the function call graph in Ghidra we see that it is only called from other standard functions (remember though, Ghidra’s function call graph doesn’t necessarily detect call GetProcAddress(hModule, lpProcName) constructs!), so I’m going to leave this alone.
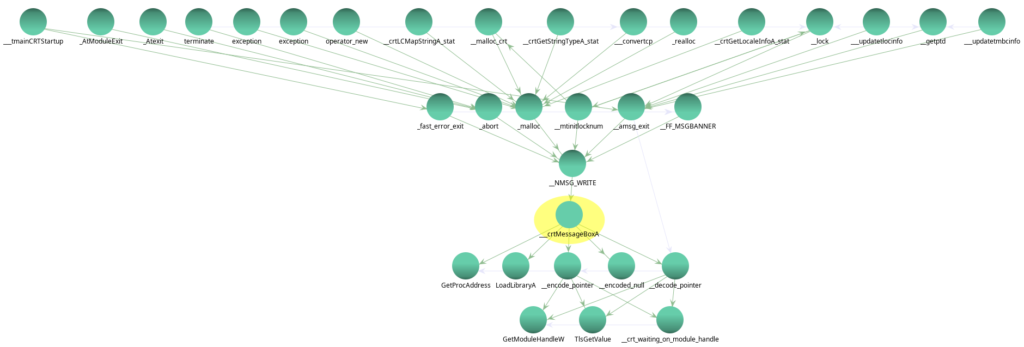 Ghidra function graph showing calls to and calls from the ___crtMessageBoxA() function
Turning our attention to the resources section, malware samples sometimes contain embedded PE files in a resource, although if that was the case we’d expect to see signs of an (clear) embedded PE file (!This program cannot be run in DOS mode) in the strings output, which we didn’t. Using wrestool(1) to look at the resources:
$ wrestool -l ./sample.exe
--type='AFX_DIALOG_LAYOUT' --name=395 --language=1094 [offset=0x20430f8 size=14]
--type='AFX_DIALOG_LAYOUT' --name=396 --language=1094 [offset=0x2043108 size=14]
--type=1 --name=42 --language=1094 [type=cursor offset=0x2043118 size=304]
--type=1 --name=43 --language=1094 [type=cursor offset=0x2043248 size=176]
--type=1 --name=44 --language=1094 [type=cursor offset=0x2043320 size=3752]
--type=1 --name=45 --language=1094 [type=cursor offset=0x20441c8 size=2216]
--type=1 --name=46 --language=1094 [type=cursor offset=0x2044a70 size=1384]
--type=3 --name=1 --language=1094 [type=icon offset=0x201ec20 size=3752]
--type=3 --name=2 --language=1094 [type=icon offset=0x201fac8 size=2216]
--type=3 --name=3 --language=1094 [type=icon offset=0x2020370 size=9640]
--type=3 --name=4 --language=1094 [type=icon offset=0x2022918 size=4264]
--type=3 --name=5 --language=1094 [type=icon offset=0x20239c0 size=1128]
--type=3 --name=6 --language=1094 [type=icon offset=0x2023e78 size=1736]
--type=3 --name=7 --language=1094 [type=icon offset=0x2024540 size=9640]
--type=3 --name=8 --language=1094 [type=icon offset=0x2026ae8 size=1128]
--type=3 --name=9 --language=1094 [type=icon offset=0x2026f80 size=1736]
--type=3 --name=10 --language=1094 [type=icon offset=0x2027648 size=9640]
--type=3 --name=11 --language=1094 [type=icon offset=0x2029bf0 size=1128]
--type=3 --name=12 --language=1094 [type=icon offset=0x202a088 size=3752]
--type=3 --name=13 --language=1094 [type=icon offset=0x202af30 size=2216]
--type=3 --name=14 --language=1094 [type=icon offset=0x202b7d8 size=1736]
--type=3 --name=15 --language=1094 [type=icon offset=0x202bea0 size=1384]
--type=3 --name=16 --language=1094 [type=icon offset=0x202c408 size=9640]
--type=3 --name=17 --language=1094 [type=icon offset=0x202e9b0 size=4264]
--type=3 --name=18 --language=1094 [type=icon offset=0x202fa58 size=1128]
--type=3 --name=19 --language=1094 [type=icon offset=0x202ff28 size=3752]
--type=3 --name=20 --language=1094 [type=icon offset=0x2030dd0 size=2216]
--type=3 --name=21 --language=1094 [type=icon offset=0x2031678 size=1736]
--type=3 --name=22 --language=1094 [type=icon offset=0x2031d40 size=1384]
--type=3 --name=23 --language=1094 [type=icon offset=0x20322a8 size=9640]
--type=3 --name=24 --language=1094 [type=icon offset=0x2034850 size=4264]
--type=3 --name=25 --language=1094 [type=icon offset=0x20358f8 size=2440]
--type=3 --name=26 --language=1094 [type=icon offset=0x2036280 size=1128]
--type=3 --name=27 --language=1094 [type=icon offset=0x2036760 size=3752]
--type=3 --name=28 --language=1094 [type=icon offset=0x2037608 size=2216]
--type=3 --name=29 --language=1094 [type=icon offset=0x2037eb0 size=1384]
--type=3 --name=30 --language=1094 [type=icon offset=0x2038418 size=9640]
--type=3 --name=31 --language=1094 [type=icon offset=0x203a9c0 size=4264]
--type=3 --name=32 --language=1094 [type=icon offset=0x203ba68 size=2440]
--type=3 --name=33 --language=1094 [type=icon offset=0x203c3f0 size=1128]
--type=3 --name=34 --language=1094 [type=icon offset=0x203c8c0 size=3752]
--type=3 --name=35 --language=1094 [type=icon offset=0x203d768 size=2216]
--type=3 --name=36 --language=1094 [type=icon offset=0x203e010 size=1736]
--type=3 --name=37 --language=1094 [type=icon offset=0x203e6d8 size=1384]
--type=3 --name=38 --language=1094 [type=icon offset=0x203ec40 size=9640]
--type=3 --name=39 --language=1094 [type=icon offset=0x20411e8 size=4264]
--type=3 --name=40 --language=1094 [type=icon offset=0x2042290 size=2440]
--type=3 --name=41 --language=1094 [type=icon offset=0x2042c18 size=1128]
--type=6 --name=22 --language=1094 [type=string offset=0x2045278 size=238]
--type=6 --name=23 --language=1094 [type=string offset=0x2045368 size=1548]
--type=12 --name=2387 --language=1094 [type=group_cursor offset=0x20432f8 size=34]
--type=12 --name=2388 --language=1094 [type=group_cursor offset=0x2044fd8 size=48]
--type=14 --name=150 --language=1094 [type=group_icon offset=0x2023e28 size=76]
--type=14 --name=151 --language=1094 [type=group_icon offset=0x202fec0 size=104]
--type=14 --name=152 --language=1094 [type=group_icon offset=0x2026f50 size=48]
--type=14 --name=153 --language=1094 [type=group_icon offset=0x202a058 size=48]
--type=14 --name=155 --language=1094 [type=group_icon offset=0x20366e8 size=118]
--type=14 --name=159 --language=1094 [type=group_icon offset=0x2043080 size=118]
--type=14 --name=188 --language=1094 [type=group_icon offset=0x203c858 size=104]
--type=16 --name=1400 --language=1094 [type=version offset=0x2045008 size=624]
So we have a number of icons, cursors, group icons, group cursors, strings, and a version resource type. If we extract them after creating a subdirectory to store them in, we can then see if we have anything interesting:
mkdir res
wrestool -x -a -o ./res/ -R ./sample.exe
Running the file(1) command on the extracted resource files shows file types of ‘data’ and of ‘Device independent bitmap graphic’, so no PE files.
Let’s just do a quick and dirty check for an (non-obfuscated/non-encrypted) embedded PE file:
$ strings -o sample.exe |grep "This program"
    115 !This program cannot be run in DOS mode.
That’ll be the standard PE file header at the start (offset of 115 bytes) of the executable sample itself, so no obvious embedded executable file. It turns out I can’t run in DOS mode either — I tried it the other day, tripped up and ended up with six stitches in my knee.
Another trick is to calculate the entropy (randomness) of the various sections of a file to get an idea of whether the executable may be packed (high entropy/randomness) or not (low entropy/randomness). However, log data from my malware analysis script will give us a clue as to whether or not it is packed/obfuscated.
Speaking of my malware analysis script, and of running, join me for my next post when I’ll start dynamic analysis by running the malware sample with my malware analysis script and see what happens.
- We can’t rely on the edi and esi values mentioned in the comments because x32dbg is showing the current values of those registers and, when I copied that snippet, execution was paused at the entry point breakpoint. Those comments will only be valid once execution reaches the instructions at 0x4169c5 or, more precisely, after the last instruction that modifies the value of those registers before the instructions at 0x4169c5
 ︎
︎ - Ghidra is calling it a ‘function signature’, I was taught ‘function prototype’, so I went searching to see if it’s just two different terms for the same thing. Apparently a ‘function signature’ defines the number and type of parameters to a function (some say it includes the return type, and some say that it doesn’t), and the function prototype is the definition of the function (that is, its return type, name, and parameter list). So whether Ghidra is giving us the function signature, or actually giving us the function prototype (the column heading says ‘Function signature’), depends on how much information it is extracting from the code — it may not be extracting enough information to give us the prototype. ︎
Article Link: Tofsee (part 1): Static Analysis | Malware Musings