By Vasco Franco
Today, we’re releasing SARIF Explorer, the VSCode extension that we developed to streamline how we triage static analysis results. We make heavy use of static analysis tools during our audits, but the process of triaging them was always a pain. We designed SARIF Explorer to provide an intuitive UI inside VSCode, with features that make this process less painful:
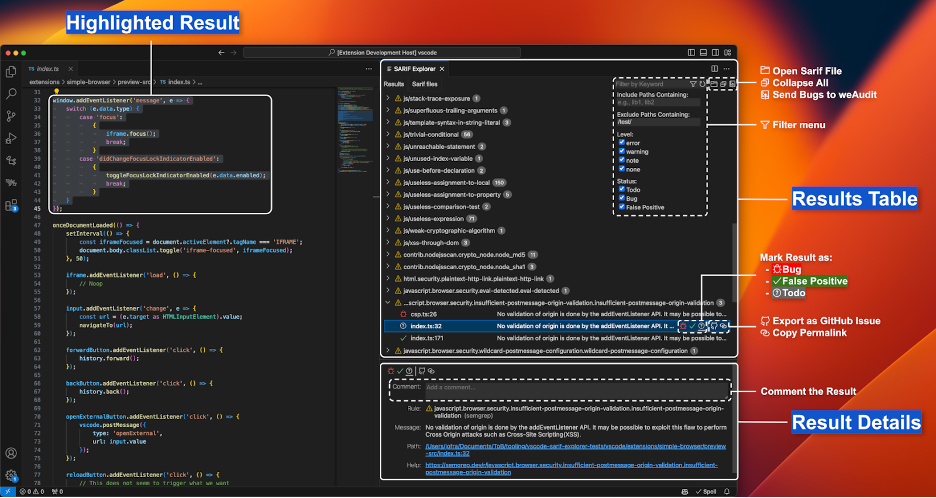
- Open multiple SARIF files: Triage all your results at once.
- Browse results: Browse results by clicking on them to open their associated location in VSCode. You can also browse a result’s dataflow steps, if present.
- Classify results: Add metadata to each result by classifying it as a “bug,” “false positive,” or “TODO” and adding a custom text comment. Keyboard shortcuts are supported.
- Filter results: Filter results by keyword, path (to include or exclude), level (“error,” “warning,” “note,” or “none”), and status (“bug,” “false positive,” or “TODO”).
- Open GitHub issues: Copy GitHub permalinks to locations associated with results and create GitHub issues directly from SARIF Explorer.
- Send bugs to weAudit: Send all bugs to weAudit once you’ve finished triaging them and continue with the weAudit workflow.
- Collaborate: Share the
.sarifexplorerfile with your colleagues (e.g., on GitHub) to share your comments and classified results.
You can install it through the VSCode marketplace and find its code in our vscode-sarif-explorer repo.
Why we built SARIF Explorer
Have you ever had to triage hundreds of static analysis results, many of which were likely to be false positives? At Trail of Bits, we extensively use static analysis tools such as Semgrep and CodeQL, sometimes with rules that produce many false positives, so this is an experience we’re all too familiar with. As security engineers, we use these low-precision rules because if there’s a bug we can detect automatically, we want to know about it, even if it means sieving through loads of false positive results.
Long ago, you would have found me triaging these results by painstakingly going over a text file or looking into a tiny terminal window. This was grueling work that I did not enjoy at all. You read the result’s description, you copy the path to the code, you go to that file, and you analyze the code. Then, you annotate your conclusions in some other text file, and you repeat.
A few years ago, we started using SARIF Viewer at Trail of Bits. This was a tremendous improvement, as it allowed us to browse a neat list of results organized by rule and click on each one to jump to the corresponding code. Still, it lacked several features that we wanted:
- The ability to classify results as bugs or false positives directly in the UI
- Better result filtering
- The ability to export results as GitHub issues
- Better integration with weAudit—our tool for bookmarking code regions, marking files as reviewed, and more (check out our recent blog post announcing the release of this tool!)
This is why we built SARIF Explorer!
SARIF Explorer was designed with user efficiency in mind, providing an intuitive interface so that users can easily access all of the features we built into it, as well as support for keyboard shortcuts to move through and classify results.
The SARIF Explorer static analysis workflow
But why did we want all these new features, and how do we use them? At Trail of Bits, we follow this workflow when using static analysis tools:
- Run all static analysis tools (configured to output SARIF files).
- Open SARIF Explorer and open all of the SARIF files generated in step 1.
- Filter out the noisy results.
- Are there rules that you are not interested in seeing? Hide them!
- Are there folders for which you don’t care about the results (e.g., the
./third_partyfolder)? Filter them out!
- Classify the results.
- Determine if each result is a false positive or a bug.
- Swipe left or right accordingly (i.e., click the left or right arrow).
- Add additional context with a comment if necessary.
- Working with other team members? Share your progress by committing the
.sarifexplorerfile to GitHub. - Send all results marked as bugs to weAudit and proceed with the weAudit workflow.
SARIF Explorer features
Now, let’s take a closer look at the SARIF Explorer features that enable this workflow:
- Open multiple SARIF files: You can open and browse the results of multiple SARIF files simultaneously. Use the “Sarif files” tab to browse the list of opened SARIF files and to close or reload any of them. If you open a SARIF file in your workspace, SARIF Explorer will also automatically open it.

- Browse results: You can navigate to the locations of the results by clicking on them in the “Results” tab. The detailed view of the result, among other data, includes dataflow information, which you can navigate from source to sink (if available). In the GIF below, the user follows the XSS vulnerability from the source (an event message) to the sink (a DOM parser).

- Classify results: You can add metadata to each result by classifying it as a “bug,” “false positive,” or “TODO” and adding a custom text comment. You can use either the mouse or keyboard to do this:
- Using the mouse: With a result selected, click one of the “bug,” “false positive,” or “TODO” buttons to classify it as such. These buttons appear next to the result and in the result’s detailed view.
- Using the keyboard: With a result selected, press the right arrow key to classify it as a bug, the left arrow key to classify it as a false positive, and the backspace key to reset the classification to a TODO. This method is more efficient.

- Filter results: You can filter results by keyword, path (to include or exclude), level (“error,” “warning,” “note,” or “none”), and status (“bug,” “false positive,” or “TODO”). You can also hide all results from a specific SARIF file or from a specific rule. For example, if you want to remove all results from the test and extensions folders and to see only results classified as TODOs, you should:
- Set “Exclude Paths Containing” to “/test/, /extensions/”
- Check the “Todo” box and uncheck the “Bug” and “False Positive” boxes in the “Status” section

- Copy GitHub permalinks: You can copy a GitHub permalink to the location associated with a result. This requires having weAudit installed.

- Create GitHub issues: You can create formatted GitHub issues for a specific result or for all unfiltered results under a given rule. This requires having weAudit installed.

- Send bugs to weAudit: You can send all results classified as bugs to weAudit (results are automatically de-duplicated if you send them twice). This requires having weAudit installed.

- Collaborate: You can share the
.sarifexplorerfile with your colleagues (e.g., on GitHub) to share your comments and classified results. The file is a prettified JSON file, which helps resolve conflicts if more than one person writes to the file in parallel.
You can find even more details about these features in our README.
Try it!
SARIF Explorer and weAudit greatly improved our efficiency when auditing code, and we hope it improves yours too.
Go try both of these tools out and let us know what you think! We welcome any bug reports, feature requests, and contributions in our vscode-sarif-explorer and vscode-weaudit repos.
If you’re interested in VSCode extension security, check out our “Escaping misconfigured VSCode extensions” and “Escaping well-configured VSCode extensions (for profit)” blog posts.
Contact us if you need help securing your VSCode extensions or any other application.
Article Link: Streamline your static analysis triage with SARIF Explorer | Trail of Bits Blog