Introduction
During the last year, Raspberry Robin has evolved to be one of the most distributed malware currently active. During this time, it is likely to be used by many actors to distribute their own malware such as IcedID, Clop ransomware and more.
Over time, malware has continued to evolve and escalate the game of cat and mouse. Raspberry Robin, however, has taken this game to the next level with a great number of unique tricks and evasions.
In this research, we examine Raspberry Robin as an example of identifying and evading different evasions. We discovered some unique and innovative methods and analyzed the two exploits used by Raspberry Robin to gain higher privileges showing that it also has capabilities in the exploiting area.
Anti-debugging and other evasions can be exhausting, and even more when it comes to such obfuscation methods and volume of methods as Raspberry Robin implements. This research aims to show plenty of methods with explanations of how they work and how to evade those evasions.
Raspberry Robin Overview
Raspberry Robin belongs to the rapidly growing club of malware that really doesn’t want to be run on any VM. It added various evasions in many stages which makes the debugging of this malware a living hell.
Raspberry Robin emerged, last May and was first analyzed by Red Canary. Raspberry Robin was technically well-documented by previous work, see for example avast’s report.
The malware has several entry vectors which lead to the main sample. The most prevalent one is via an LNK disguised as a thumb drive or a network share which launches msiexec.exe that downloads the main component.
This main component is packed with 14 different layers (some of them are identical), while some of them contain evasions and some of them do not. Those stages are stored in memory in a custom format being unpacked and run without the headers section. This makes it difficult to unpack Raspberry Robin layers statically into a standalone PE file. Understanding the custom format and how the loading of each stage works is doable but can be exhausting and it probably will be simpler to just analyze the stages dynamically.
The code in all of the stages is heavily obfuscated, including the main payload itself. What makes the obfuscation even harder, is that Raspberry Robin functions expect an argument that is being used to decrypt all the variables and constants the functions need. The initial argument is hardcoded and then every function gets an argument based on the initial one. This is also important for the flow as the malware uses those variables in order to decide which block of logic to run now. That means, that jumping to a function without knowing the real argument will result in faults.
Raspberry Robin has different ways of how it behaves in case of detecting it is not running on a real victim’s computer:
- Terminate the process
- Enters infinite loop
- Cause a crash – such as in the fifth stage where it uses a different RC4 key to decrypt the next stage in case the malware detects it is not running on a physical machine.
- The most diabolical one – Raspberry Robin decrypts a fake new stage instead the real one, which results in another 3 layers of packers until a fake loader. This loader was mentioned in several blogposts and it loads samples from a domain hardcoded inside. The fake loader can be monitored by detecting that the malware tries to query
HKEY_CURRENT_USER\SOFTWARE\Microsoft\Media\Active. Many fake payloads were seen in the wild such as BroAssist and other .NET backdoors.
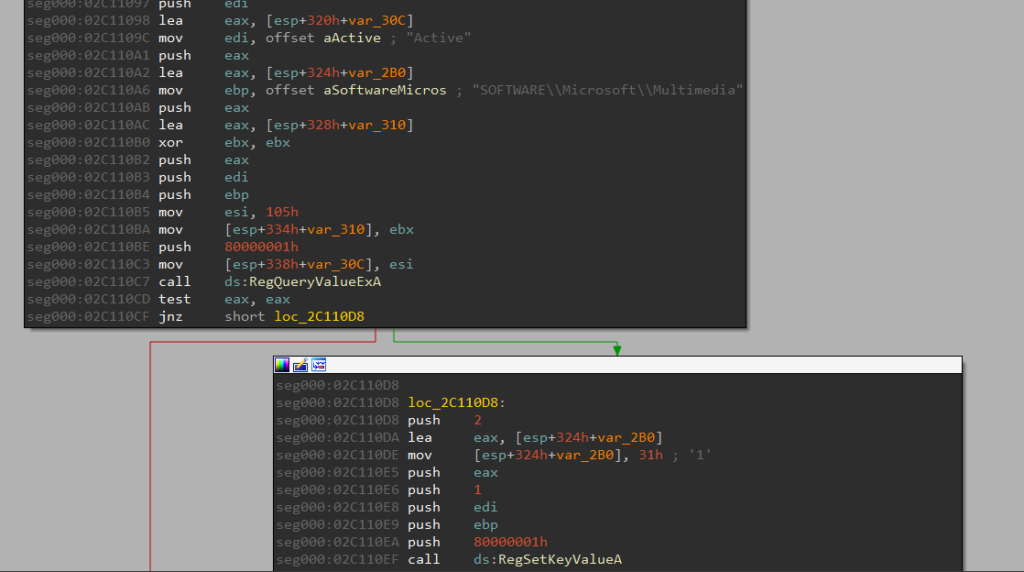 Figure 1 – Raspberry Robin’s fake payload
Evasions walkthrough
As we mentioned, Raspberry Robin has various evasion tricks, we decided to take some of them and elaborate on what those evasions try to check and how to avoid them not only for Raspberry Robin but also for other malware which can use those evasions as well. We recommend reading our evasions and anti-debug encyclopedias for information about many other techniques.
First, we highly recommend using several anti-anti-debug libraries to skip many of the evasions with ease. A good example of one would be ScyllaHide. ScyllaHide is an open-source anti-Anti-Debug library for user-mode evasions. It supports various debuggers such as x64dbg, IDA debugger and OllyDbg. If you desire a kernel-mode plugin then you have titanhide which hooks Nt* kernel functions using SSDT table hooks.
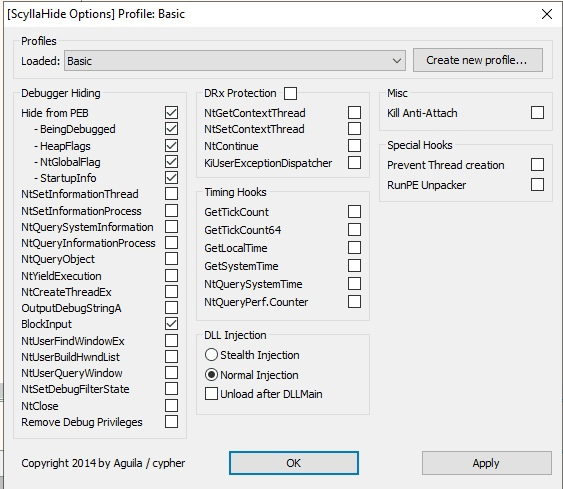 Figure 2 – ScyllaHide’s options bar
Another thing recommended before starting to work on malware these days is checking if your working machine can be detected easily by malware. For this case, there are many solutions such as our own tool – InviZzzible which helping assessing the virtual environment against a variety of evasions and al-khaser project.
Raspberry Robin evasions
PEB checks – Anti Debug
Special flags in system tables, which dwell in process memory and which an operation system sets, can be used to indicate that the process is being debugged. Raspberry Robin checks some of them.
First, it inspects two flags in the PEB (Process Environment Block) which is a structure that holds data about the current process. Those flags are:
-
BeingDebugged– Indicates whether the specified process is currently being debugged and can be also queried with the APIIsDebuggerPresent -
NtGlobalFlag– A flag that is 0 by default but if a process was created by a debugger then the following flags will be set:- FLG_HEAP_ENABLE_TAIL_CHECK (0x10)
- FLG_HEAP_ENABLE_FREE_CHECK (0x20)
- FLG_HEAP_VALIDATE_PARAMETERS (0x40)
Example code:
mov eax, fs:[30h] ; get PEB, in 64-bit it is in gs:[60h]
cmp byte ptr [eax+2], 0 ; checking BeingDebugged flag
jne being_debugged

mov al, [eax+68h] ; checking NtGlobalFlag
and al, 70h
cmp al, 70h ; (FLG_HEAP_ENABLE_TAIL_CHECK | FLG_HEAP_ENABLE_FREE_CHECK | FLG_HEAP_VALIDATE_PARAMETERS)
jz  being_debugged
Mitigations
Using ScyllaHide or any other Anti-Debug plugin setting those flags to 0. You can also edit those bytes yourself when you start debugging.
KUSER_SHARED_DATA check – Anti Debug
It also inspects a flag in KUSER_SHARED_DATA – a structure that provides a quick mechanism to obtain frequently needed global data from the kernel without involving user-kernel mode switching using system calls or interrupts. The structure is mapped at a fixed, hardcoded address on both kernel and user sides 0x7FFE0000 on 32-bit and 0xFFFFF78000000000 on 64-bit. The flag that is checked is KdDebuggerEnabled that returns TRUE if a kernel debugger is connected/enabled.
mov eax, 0x7ffe0000 ; KUSER_SHARED_DATA structure address
cmp byte ptr [eax+0x2d4], 0 ; checking KdDebuggerEnabled flag
jne being_debugged
Mitigations
You can patch it manually, also a draft code for patching kdcom.dll (kernel debugger) so it will not be detected was issued here.
User name and Computer name check – Anti VM
Usual hosts have meaningful and non-standard usernames/computer names. Particular virtual environments assign some predefined names to default users as well as computer names.
Raspberry Robin checks the username and computer name against a list of known default names given by VMs and analysts. Usually, those values are queried by GetComputerNameA and GetUserNameA but Raspberry Robin queries them differently. It finds the environment variables through PEB -> ProcessParameters(RTL_USER_PROCESS_PARAMETERS) -> Environment and then loops through the environment block looking for the USERNAME and COMPUTERNAME variables.
.data
username db 255 dup(0)  ; buffer to hold the username
msg db "Username: ", 0

.code
start:
    ; Get a pointer to the PEB
    mov eax, fs:[30h]
    ; Get a pointer to the ProcessParameters member of the PEB
    mov eax, [eax + 0x10]
    ; Get a pointer to the Environment member of the ProcessParameters structure
    mov eax, [eax + 0x48]
    ; Loop through the environment block looking for the USERNAME variable
next_var:
    ; Read a null-terminated string from the environment block
    lodsb
    ; Check if the string is empty (i.e., end of environment block)
    test al, al
    jz end_env
    ; Check if the string starts with "USERNAME="
    cmp byte ptr [esi], 'U'
    jne next_var
    cmp dword ptr [esi+1], 'SER'
    jne next_var
    cmp dword ptr [esi+5], 'NAME'
    jne next_var
    cmp byte ptr [esi+9], '='
    jne next_var
    ; Copy the value of the USERNAME variable into the username buffer
    mov edi, offset username
    lea esi, [esi+10]
    rep movsb
end_env:
    ; Print the username to the console
    invoke StdOut, offset msg
    invoke StdOut, offset username
    ; Exit the program
    invoke ExitProcess, 0

; Define the Win32 API functions
StdOut      equ <GetStdHandle, WriteFile>
            extern StdOut :PROC
ExitProcess equ <GetProcAddress, GetModuleHandle, 0>
            extern ExitProcess :PROC
Mitigations
Change the Computer name and User name of your machine to non-suspicious values.
Process name & full path – Anti Debug and Anti VM
Some Virtual environments launch executables from specific paths. Moreover, some debuggers have default names for their DLL loaders such as x64dbg’s DLL loader.
Raspberry Robin queries for the name of the process’ main module as well as its full path.
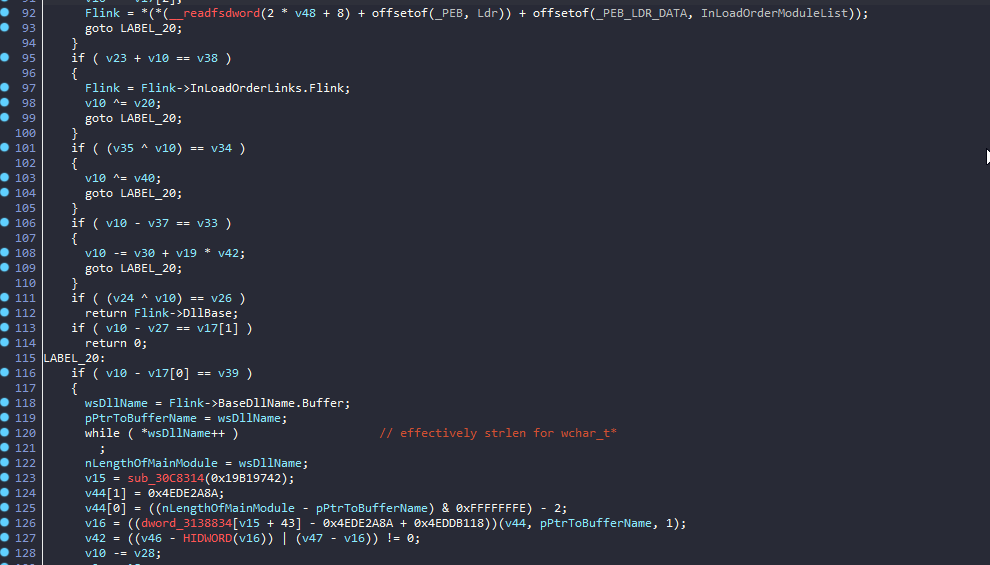 Figure 3 – BaseDllName check
To circumvent this evasion, use rundll32.exe to debug Raspberry Robin even if you use x64dbg.
Number of active CPUs – Anti-Sandbox
Analysis environments usually have a Low CPU core count. This information can be queried from the PEB (NumberOfProcessors) or using the GetSystemInfo API.
Raspberry Robin checks if there are fewer than 2 active processors. It does that by querying ActiveProcessorCount from the KUSER_SHARED_DATA structure.
mov eax, 0x7ffe0000  ; KUSER_SHARED_DATA structure fixed address
cmp byte ptr [eax+0x3c0], 2 ; checking ActiveProcessorCount
jb being_debugged
Mitigations
To circumvent this evasion in an analysis environment, configure the virtual machine to Assign two or more cores for Virtual Machine. As an alternative solution, patch/hook NtCreateThread to assign a specific core for each new thread.
For example on VMware Workstation Pro:
 Figure 4 – Number of processors in VMWare
Memory pages – Anti Sandbox
Too little memory on a system in the current day and age might mean a low-performance system that the authors are not interested in, or are suspecting to be an analysis environment.
Raspberry Robin checks for how many physical memory pages are available in the system by querying NumberOfPhysicalPages from the KUSER_SHARED_DATA which is unique as most malware checks this by calling the API GetMemoryStatusEx.
Once met with too few pages, a flag is raised. The threshold is 204800 pages (800 MB) which is pretty low for personal computers. The standard amount for this kind of computer is around 8-16 GB of RAM.
    mov eax, 0x7ffe0000 ; KUSER_SHARED_DATA structure address
  cmp byte ptr [eax+0x2e8], 0x32000 ; checking NumberOfPhysicalPages
  jbe being_debugged
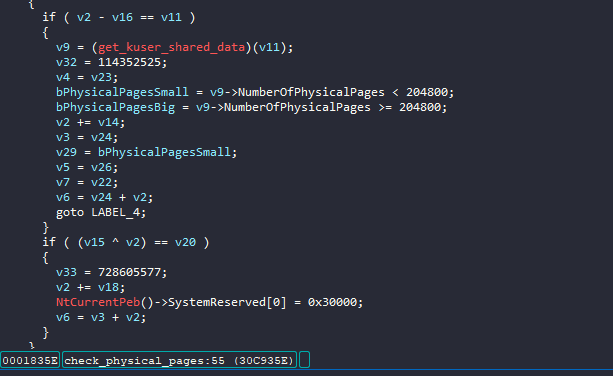 Figure 5 – Number of physical pages check
Patch NumberOfPhysicalPages in KUSER_SHARED_DATA or just assign more RAM for your VM.
Mac address Check – Anti VM
Vendors of different virtual environments hard-code some values as MAC addresses for their products — due to this fact such environments may be detected via checking the properties of appropriate objects.
Raspberry Robin not only compares its own adapter info with a list of blacklisted addresses but also compares the addresses in its ARP table. It does that by first populating it with GetBestRoute API and then getting the table info using GetIpNetTable.
int check_mac_vendor(char * mac_vendor) {
    unsigned long alist_size = 0, ret;
    ret = GetAdaptersAddresses(AF_UNSPEC, 0, 0, 0, &alist_size);

    if (ret == ERROR_BUFFER_OVERFLOW) {
        IP_ADAPTER_ADDRESSES* palist = (IP_ADAPTER_ADDRESSES*)LocalAlloc(LMEM_ZEROINIT,
                                                                                                                                                    alist_size);
        void * palist_free = palist;

        if (palist) {
            GetAdaptersAddresses(AF_UNSPEC, 0, 0, palist, &alist_size);
            char mac[6]={0};
            while (palist){
                if (palist->PhysicalAddressLength == 0x6) {
                    memcpy(mac, palist->PhysicalAddress, 0x6);
                    if (!memcmp(mac_vendor, mac, 3)) {  /* First 3 bytes are the same */
                        LocalFree(palist_free);
                        return TRUE;
                    }
                }
                palist = palist->Next;
            }
            LocalFree(palist_free);
        }
    }

    return FALSE;
}
Mitigations
Change your machine’s MAC address to a non-default address.
CPUID checks – Anti VM
The CPUID instruction is an assembly instruction that returns processor identification and features information to the EBX, ECX and EDX registers based on the value in the EAX register.
Raspberry Robin uses the CPUID instruction for several checks
-
EAX = 0x40000000 – returns Vendor ID which Raspberry Robin compares to default IDs given in known virtual machine’s such as
Microsoft hv(Hyper-V) orVMwareVMware(VMware)
    push ebx
    ; nullify output registers
    xor ebx, ebx
    xor ecx, ecx
    xor edx, edx

    mov eax, 0x40000000 ; call cpuid with argument in EAX
    cpuid

    mov edi, vendor_id     ; store vendor_id ptr to destination

    ; move string parts to destination
    mov eax, ebx
    stosd
    mov eax, ecx
    stosd
    mov eax, edx
    stosd

    ; now check this against the different strings connected to VMs
- EAX = 0x1 – returns a set of feature flags These flags indicate the CPU’s capabilities and features, such as whether it supports MMX, SSE, or AVX instructions, as well as information about the CPU’s stepping, model, and family. One of the flags is in the 31st bit in ECX which indicates whether the program is being run in Hypervisor.
        xor ecx, ecx
    mov eax, 1 // sets EAX to 1
    cpuid

    bt ecx, 31 // set CF equal to 31st bit in ECX
    setc al // set AL to the value of CF
        test eax, eax
        jne being_debugged
Mitigations
Different VM solutions have different ways of how to modify CPUID and CPU features. For example, in VMWare you can edit the configuration file (.vmx) and add the following lines:
- cpuid.40000000.ecx = “0000:0000:0000:0000:0000:0000:0000:0000” cpuid.40000000.edx = “0000:0000:0000:0000:0000:0000:0000:0000” – for the first (EAX = 0X40000000) check
- cpuid.1.ecx = ”0—:—-:—-:—-:—-:—-:—-:—-” – for the Hypervisor (EAX = 1) check
PEB module enumeration – Anti Debug and Anti Sandbox
Using the PEB, a program can enumerate the modules loaded in its memory by iterating through the list of modules stored in the PEB’s “Ldr” (Loader) data structure. Each module in the list contains information such as its base address, entry point, and size, which can be used to analyze the module and its contents.
Raspberry Robin uses that technique to check if blacklisted applications that inject their module into processes (hashed) name exists in the hardcoded blacklist. Those modules can be sandbox-related or anti-anti-debug libraries such as ScyllaHide.
Mitigations
To circumvent this evasion, the following options are available:
- Don’t load foreign modules into the process of the malware.
- Load your foreign module of choice and then unlink it from the PEB, or use a different method to load it, such as manual mapping.
// Unlinking specific module from PEB's InMemoryOrderModuleList
bool unlink()
{
    HMODULE mod = nullptr;
    if(!GetModuleHandleEx(GET_MODULE_HANDLE_EX_FLAG_FROM_ADDRESS |
                                                    GET_MODULE_HANDLE_EX_FLAG_UNCHANGED_REFCOUNT,
                                                    reinterpret_cast<LPCSTR>(&unlink), &mod))
    {
        return false;
    }
    wchar_t module_name[MAX_PATH];
    if(GetModuleFileNameW(mod, module_name, sizeof(module_name)))
    {
        return false;
    }
    #ifdef _WIN64    auto peb = reinterpret_cast<PEB*>(__readgsqword(0x60));
    #else    auto peb = reinterpret_cast<PEB*>(__readfsdword(0x30));
    #endif    for(auto peb_link = peb->Ldr->InMemoryOrderModuleList.Flink; peb_link !=
                                    &peb->Ldr->InMemoryOrderModuleList; peb_link = peb_link->Flink)
    {
        if(::wcscmp(reinterpret_cast<LDR_DATA_TABLE_ENTRY*>(peb_link)->FullDllName.Buffer,
                                         module_name) == 0)
        {
            peb_link->Flink->Blink = peb_link->Blink;
            peb_link->Blink->Flink = peb_link->Flink;
            return true;
        }
    }
    return false;
MulDiv – Anti Wine
The MulDiv API is being called with specific arguments (MulDiv(1, 0x80000000, 0x80000000)) which should logically return 1 – however, due to a bug with the ancient implementation on Windows, it returns 2.
Raspberry Robin uses this check in order to detect Wine which for some reason returns 0 (even the latest version, as of today). There are more known evasion methods to detect Wine like the good old check of searching for the existence of one of Wine’s exclusive APIs such as kernel32.dll!wine_get_unix_file_name or ntdll.dll!wine_get_host_version).
Here is an example of comparing the execution using the Windows implementation of MulDiv, a logically correct implementation (which is not backward compatible), and Wine’s C++ implementation.
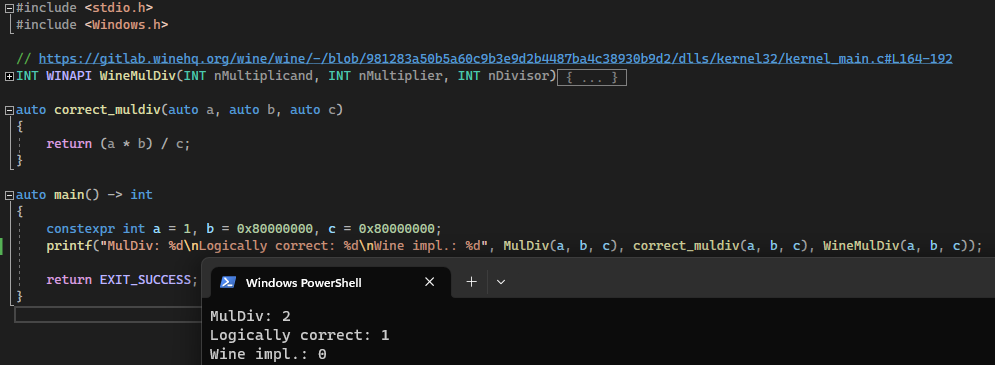 Figure 6 – MulDiv implementations
If Using Wine, hook MulDiv to return 2 or modify the implementation as it works in Windows.
Devices detections – Anti VM
Virtual environments emulate hardware devices and display devices and leave specific traces in their descriptions – which may be queried and the conclusion about non-host OS made.
Raspberry Robin tries to evade by checking the ProductID of \\.\PhysicalDrive0 and DeviceIDs of the display devices and comparing them to a list of blacklisted known names.
bool GetHDDVendorId(std::string& outVendorId) {
    HANDLE hDevice = CreateFileA(_T("\\\\.\\PhysicalDrive0"),
                                 0,
                                 FILE_SHARE_READ | FILE_SHARE_WRITE,
                                 0,
                                 OPEN_EXISTING,
                                 0,
                                 0);

    STORAGE_PROPERTY_QUERY storage_property_query = {};
    storage_property_query.PropertyId = StorageDeviceProperty;
    storage_property_query.QueryType = PropertyStandardQuery;
    STORAGE_DESCRIPTOR_HEADER storage_descriptor_header = {};
    DWORD BytesReturned = 0;

    DeviceIoControl(hDevice, IOCTL_STORAGE_QUERY_PROPERTY,
                         &storage_property_query, sizeof(storage_property_query),
                         &storage_descriptor_header, sizeof(storage_descriptor_header),
                         &BytesReturned);


    std::vector<char> buff(storage_descriptor_header.Size); //_STORAGE_DEVICE_DESCRIPTOR
    DeviceIoControl(hDevice, IOCTL_STORAGE_QUERY_PROPERTY,
                         &storage_property_query, sizeof(storage_property_query),
                         buff.data(), buff.size(), 0);


    STORAGE_DEVICE_DESCRIPTOR* device_descriptor = (STORAGE_DEVICE_DESCRIPTOR*)buff.data();
    if (device_descriptor->VendorIdOffset){
        outVendorId = &buff[device_descriptor->VendorIdOffset];
    }
}
Mitigations
To circumvent this evasion you can hook DeviceIoControl or rename HDD so that it will not be detected by specific strings
Firmware tables – Anti VM
There are special memory areas used by OS that contain specific artifacts if OS is run under a virtual environment. These memory areas may be dumped using different methods depending on the OS version.
Firmware tables are retrieved via SYSTEM_FIRMWARE_TABLE_INFORMATION object. In our case, Raspberry Robin checks if specific strings are present in Raw SMBIOS Firmware Table. It does that by calling NtQuerySystemInformation with SystemFirmwareTableInformation argument (76).
// First, SYSTEM_FIRMWARE_TABLE_INFORMATION object is initialized in the following way:
SYSTEM_FIRMWARE_TABLE_INFORMATION *sfti =
    (PSYSTEM_FIRMWARE_TABLE_INFORMATION)HeapAlloc(GetProcessHeap(), HEAP_ZERO_MEMORY,
     Length);
sfti->Action = SystemFirmwareTable_Get;  // 1
sfti->ProviderSignature = 'RSMB'; // raw SMBIOS
sfti->TableID = 0;
sfti->TableBufferLength = Length;

// Then initialized SYSTEM_FIRMWARE_TABLE_INFORMATION object is used as an argument for
// the system information call in the following way in order to dump raw firmware table:
NtQuerySystemInformation(
    SystemFirmwareTableInformation,  // 76
    sfti,
    Length,
    &Length);
Mitigations
To circumvent this evasion hook NtQuerySystemInformation for retrieving SystemFirmwareTableInformation class and parse the SFTI structure for provided field values.
Vectored Exception Filter – Anti Debug
Vectored exception handler (VEH) is a Windows operating system feature that allows programs to register a callback function to handle certain types of exceptions that occur during program execution. It is an extension of Structured Exception Handling (SEH) and it is being called for unhandled exceptions regardless of the exception’s location.
Then, every time those exceptions are triggered the exception handler will be called. But when a debugger is attached to a program, it becomes the exception handler for the program’s exceptions, which allows it to intercept and handle exceptions before they are handled by the program’s normal exception-handling mechanism. That means that if the program is running under a debugger, the custom filter won’t be called and the exception will be passed to the debugger.
Raspberry Robin adds a handler using RtlAddVectoredExceptionHandler and then deliberately causes exceptions (such as in the above assembly instruction part) to verify if the control passed to the handler which means further that the process running without a debugger.
include 'win32ax.inc'

invoke RtlAddVectoredExceptionHandler, not_debugged
int  3
jmp  being_debugged

not_debugged:
        ; continue the process...

being_debugged:
        invoke  ExitProcess,0
Mitigations
To circumvent this evasion, you can patch KiUserExceptionDispatcher which ScyllaHide implements. Also, you can patch the opcodes which cause the exception.
Hardware breakpoints – Anti Debug
Hardware breakpoints are implemented using dedicated hardware resources within the CPU, including registers that are used to store the parameters for the breakpoints. Debug Address Registers (DR0-DR3) are among those registers and they are used to store the memory addresses or data values that the breakpoints are set on.
DR0-DR3 can be retrieved from the thread context structure. If they contain non-zero values, it may mean that the process is executed under a debugger and a hardware breakpoint was set.
Raspberry Robin uses the fact of having the CONTEXT structure that is given as an argument to the exception handler and inspects it. This is without using the API GetThreadContext which is more commonly used to query the context structure.
 Figure 7 – Hardware breakpoints check
To circumvent this evasion you can hook GetThreadContext and modify debug registers or in our case as it happens in VEH we can again hook KiUserExceptionDispatcher.
Assembly Instructions – Anti Debug
There are some techniques are intended to detect a debugger presence based on how debuggers behave when the CPU executes a certain instruction.
Raspberry Robin uses some of them in different execution stages:
****POPF and CPUID****
To detect the use of a VM in a sandbox, malware could check the behavior of the CPU after the trap flag is set. The trap flag is a flag bit in the processor’s flags register that is used for debugging purposes. When the Trap Flag is set, the processor enters a single-step mode, which causes it to execute only one instruction at a time and then generate a debug exception.
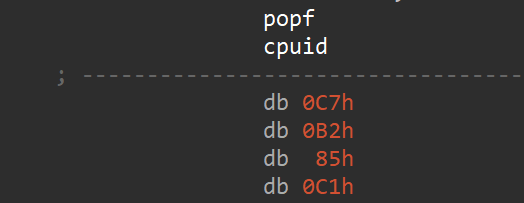 Figure 8 – raising the POPF and CPUID exception
In our case, The popfinstruction pops the top value from the stack and loads it into the flags register. Based on the value on the stack that has the Trap Flag bit set, the processor enters a single-step mode (SINGLE_STEP_EXCEPTION) after executing the next instruction.
But the next instruction is cpuid which behaves differently in VM. When in a physical machine, this exception stops the CPU execution to allow the contents of the registers and memory location to be examined by the exception handler after thecpuid instruction which moves away the instruction pointer from the next bytes. In a VM, executing cpuid will result in a VM exit. During the VM exit the hypervisor will carry out its usual tasks of emulating the behaviors of the cpuid instruction which will make the Trap Flag be delayed and the code execution will continue to the next instruction with the C7 B2 bytes. This results in an exception because of an illegal instruction exception.
The vectored exception handler we mentioned above checks for this type of exception (Illegal instruction) and if it encounters such an exception, Raspberry Robin knows it runs under a VM.
Stack Segment Reigster
The trick relies on the fact that certain instructions cause all of the interrupts to be disabled while executing the next instruction. This is happening using the following code:
push ss
pop ss
pushf
test byte ptr [esp+1], 1
jnz being_debugged
The register ss is called the Stack Segment and is a special-purpose register that stores the segment address of the current stack.
Loading the ss (Stack segment) register clears interrupts to allow the next instruction to load the esp register without the risk of stack corruption. However, there is no requirement that the next instruction loads anything into the esp register.
If a debugger is being used to single-step through the code, then the Trap Flag will be set in the EFLAGS image. This is typically not visible because the Trap Flag will be cleared in the EFLAGS image after each debugger event is delivered. However, if the flags are saved to the stack using the pushf instruction before the debugger event is delivered, then the Trap Flag will become visible. Therefore, comparing the flag on the stack can tell us whether the sample is being debugged.
****INT 3****
INT3 is an interruption that is used as a software breakpoint. Without a debugger present, after getting to the INT3 instruction, the exception EXCEPTION_BREAKPOINT(0x80000003) is generated and an exception handler will be called. If the debugger is present, the control won’t be given to the exception handler but to the debugger itself.
Besides the short form of INT3 instruction (CC opcode), there is also a long form of this instruction: CD 03 opcode.
When the exception EXCEPTION_BREAKPOINT occurs, Windows decrements the EIP register to the assumed location of the CC opcode and passes the control to the exception handler. In the case of the long form of the INT3 instruction, EIP will point to the middle of the instruction (means to the 03 byte). Therefore, EIP should be edited in the exception handler if we want to continue execution after the INT3 instruction (otherwise we’ll most likely get an EXCEPTION_ACCESS_VIOLATION exception). If not, we can neglect the instruction pointer modification.
bool IsDebugged()
{
    __try
    {
        __asm int 3;
        return true;
    }
    __except(EXCEPTION_EXECUTE_HANDLER)
    {
        return false;
    }
}
Mitigations
The best way to mitigate all the following checks is to find those methods and patch them with NOP instructions.
Thread hiding – Anti Debug
In Windows 2000, a new class of thread information was added to the API NtSetInformationThread – ThreadHideFromDebugger. It was added because when you attach a debugger to a remote process a new thread is created. If this was just a normal thread the debugger would be caught in an endless loop as it attempted to stop its own execution.
So behind the scenes when the debugging thread is created Windows calls NtSetInformationThread with the ThreadHideFromDebugger flag set (1). This way the process can be debugged and a deadlock prevented. Allowing code execution to continue as normal.
If this flag is set for a thread, then that thread stops sending notifications about debug events. These events include breakpoints and notifications about program completion. Due to this flag, the debugger cannot see the thread and is now unable to trap these events.
Raspberry Robin enables the flag on newly spawned threads and then queries this information again using the API NtQueryInformationThread to check if the flag was set.
bool HideFromDebugger(HANDLE hThread) {
    int status;
    int lHideThread = 1;
    // ThreadHideFromDebugger = 0x11
    status = NtSetInformationThread(hThread, ThreadHideFromDebugger, 0, 0);
    // check if the thread is hidden
  status = NtQueryInformationThread(hThread, ThreadHideFromDebugger, &ThreadInformation, 1u, 0);

    return status
}
Mitigations
To circumvent this evasion you need to hook NtSetInformationThread. In our case, you also need to hook NtQueryInformationThread.
NtQueryInformationProcess flags – Anti Debug
The API NtQueryInformationProcess can retrieve a different kind of information from a process. It accepts a ProcessInformationClass parameter which specifies the information you want to get and defines the output type of the ProcessInformation parameter.
Raspberry Robin uses this API in order to query the following values:
- ProcessDebugPort (ProcessInformationClass = 7) – returns the port number of the debugger for the process.
- ProcessDebugFlags (ProcessInformationClass = 0x1f) – returns the inverse value of the field NoDebugInherit which is a boolean value that determines whether child processes inherit the debugging privileges of their parent process. This flag resides in the EPROCESS object.
- ProcessDebugObjectHandle (ProcessInformationClass = 0x1e) – returns a handle to a kernel object that can be used to attach a debugging object to a process, allowing a debugger to control the process and access its memory and state. When a process is created, it does not have a debugging object associated with it by default. However, a debugger can use the API OpenProcess with the DEBUG_ONLY_THIS_PROCESS or DEBUG_PROCESS flags to create a ProcessDebugObjectHandle for the process.
 Figure 11 – Token Swap using the exploit primitives
Mitigations
To circumvent this evasion hook NtQueryInformationProcess and set the following values in return buffers:
- 0 (or any value except -1) in the case of
ProcessDebugPort - A non-zero value in the case of
ProcessDebugFlags - 0 in the case of
ProcessDebugObjectHandle
DbgBreakPoint patch – Anti Debug
DbgBreakPoint is the API called when a debugger attaches to a running process. It allows the debugger to gain control because an exception is raised which it can intercept. The API has the following implementation:
cc int3
c3 ret
by replacing the first byte (int3 = 0xcc) with a ret (0xc3) instruction, the debugger won’t break in and the thread will exit.
void Patch_DbgBreakPoint()
{
    HMODULE hNtdll = GetModuleHandleA("ntdll.dll");
    if (!hNtdll)
        return;

    FARPROC pDbgBreakPoint = GetProcAddress(hNtdll, "DbgBreakPoint");
    if (!pDbgBreakPoint)
        return;

    DWORD dwOldProtect;
    if (!VirtualProtect(pDbgBreakPoint, 1, PAGE_EXECUTE_READWRITE, &dwOldProtect))
        return;

    *(PBYTE)pDbgBreakPoint = (BYTE)0xC3; // ret
}
Mitigations
To circumvent this evasion, you can patch DbgBreakPoint back after the modification (can be as part of hooking VirtualProtect).
Process Suspension detection – Anti Debug
This evasion depends on having the thread creation flag THREAD_CREATE_FLAGS_BYPASS_PROCESS_FREEZE (name given by researcher) that Microsoft added into 19H1. This flag makes the thread ignore any PsSuspendProcess API being called.
Raspberry Robin uses this flag for a cool trick. It creates two threads with this flag, one of which keeps suspending the other one until the suspend counter limit which is 127 is reached (suspend count is a signed 8-bit value).
When you get to the limit, every call for PsSuspendProcess doesn’t increment the suspend counter and returns STATUS_SUSPEND_COUNT_EXCEEDED. But what happens if someone calls NtResumeProcess? It decrements the suspend count! So when someone decides to suspend and resume the thread, they’ll actually leave the count in a state it wasn’t previously in. Therefore, Raspberry Robin calls periodically to NtSuspendThread and if it succeeds and increments the counter it means that the thread has been externally suspended and resumed and is being debugged.
Mitigations
To circumvent this evasion, you can hook NtCreateThread to omit the THREAD_CREATE_FLAGS_BYPASS_PROCESS_FREEZEIt flag.
VBAWarnings check – Anti Sandbox
You all know the “Enable all macros” prompt in Office documents. It means the macros can be executed without any user interaction. This behavior is common for sandboxes.
Raspberry Robin uses that in order to check if it is running on a sandbox checking the flag in the registry keys SOFTWARE\Microsoft\Office\<version>\Word\Security\VBAWarnings while the version is between 12.0 to 19.0.
Mitigations
To circumvent this evasion disable this flag or hook SHGetValueW or other registry query APIs such asRegQueryValueExA.
Main stage tricks
Raspberry Robin not only has numerous evasions but also some really nice tricks of how not being detected by security solutions.
IFEO Removal
This technique involves modifying the Image File Execution Options (IFEO) registry key, which is used by the Windows operating system to set debugging options for executable files. When an executable file is launched, the operating system checks the corresponding IFEO registry key for any specified debugging options. If the key exists, the operating system launches the specified debugger instead of the executable file.
What Raspberry Robin does is remove the registry keys for the following files so they will run instead of the debugger:
- rundll32.exe
- regsvr32.exe
- dllhost.exe
- msiexec.exe
- odbcconf.exe
- regasm.exe
- regsvcs.exe
- installutil.exe
- explorer.exe
Windows Defender Exclusion List
Raspberry Robin tries to evade Windows Defender by adding its processes and paths to its exclusion list by adding the values to the registry keys: HKLM\SOFTWARE\Policies\Microsoft\Windows Defender\Exclusions\Paths and HKLM\SOFTWARE\Policies\Microsoft\Windows Defender\Exclusions\Processes.
Persistence trick
Raspberry Robin Creates a file with a random name and extension and puts it in %TEMP% directory. Then, the malware writes the command shell32.dll|ShellExec_RunDLLA|REGSVR32.EXE -U /s "C:\Windows\Temp <generated_file_name>.” to RunOnce or RunOnceEx key but with a twist.
Raspberry Robin tries to evade security solutions by first generating a random registry key inside HKLM\SOFTWARE\Microsoft\Windows\CurrentVersion and renaming the RunOnce key to this random name. Then add the new value to this random key before renaming it back to RunOnce.
Now that we’ve covered the various evasive tactics, let’s shift our focus to the exploits used by the malware.
Privilege escalation
Raspberry Robin has several ways of how it elevates its privileges – two UAC methods, which were covered in avast’s blogpost and two 1-days EoP exploits. Raspberry Robin only runs those methods only in case this malware really needs them. Those checks including:
- Process’s SID is
S-1-5-32-544(DOMAIN_ALIAS_RID_ADMIN) - The integrity level is
0x3000(high integrity) or0x2000(medium integrity) - If consent by user or admin is required –
HKLM\SOFTWARE\Microsoft\Windows\CurrentVersion\Policies\System\ConsentPromptBehaviorUser/Admin - If the time of the last input event (calling to
GetLastInput) is in the last hour.
Below we drill down into the EoP exploits used by the malware.
The malware contains 2 exploits, which are embedded and encrypted by RC4 in memory. Each exploit is suitable for different versions of windows which increases the odds of the malware elevating its privileges on a random victim’s machine.
Both exploits are 64-bit and packed with the same packer known as Donut Loader. The packer is injected as a shellcode with KernelCallbackTable injection as copied from the open-source POC. The exploits are injected into winver.exe which is also added to the Windows Defender excluded list.
The exploits share code such as the encryption scheme of loops of math expressions for their strings (such as class names and loaded modules).
CVE-2020-1054
CVE-2020-1054 is Win32k Elevation of Privilege Vulnerability reported by Check Point Research. The vulnerability is out of bounds write in win32k and it was used by different Exploit kits in the past. The exploit has some similarities to open-source GitHub POCs but we haven’t found one that surely is the base for this implementation. The exploit is only used by Raspberry Robin on Windows 7 systems where the revision number is not higher than 24552 (It gets the build number through the BuildLabEx registry key).
Versioning Decisions
Depends on the environment variable that Raspberry Robin’s main module sets. This variable means what kind of Windows 7 we have (with patches or not – for different offsets). The exploit uses this variable in order to decide 2 offsets:
-
xleft_offset– 0x900 or 0x8c0 -
oob_offset– 0x238 or 0x240
HMValidateHandle Wrapper
Gets the HMValidateHandle from searching inside the IsMenu code for 0xe8 opcode. It searches in the first 0x20 bytes for this opcode.
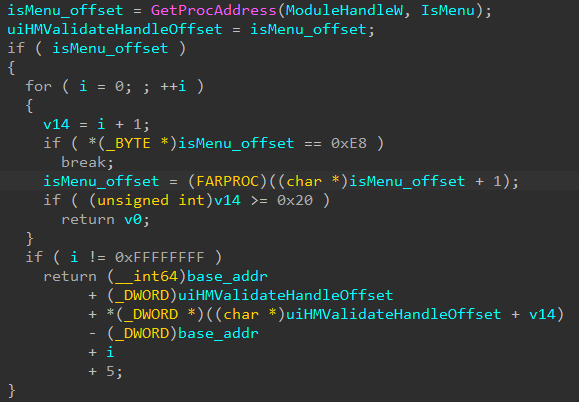 Figure 12 – Getting HMValidateHandle address
Privilege Elevation
The exploit uses a shellcode, different than the ones in GitHub doing the same replacing of the process’s token. This shellcode is invoked by sending a message after the API SetBitmapBits
Naming
The name of the window used in this exploit is “#32272” so it can’t be used for hunting as it’s pretty known and used in many places.
Token Swap
In the shellcode, it is pretty straightforward:
- We search for the target process – using the target PID
- We search for
SYSTEM– using a PID of4 - We update our pointer to point at
SYSTEM’s token
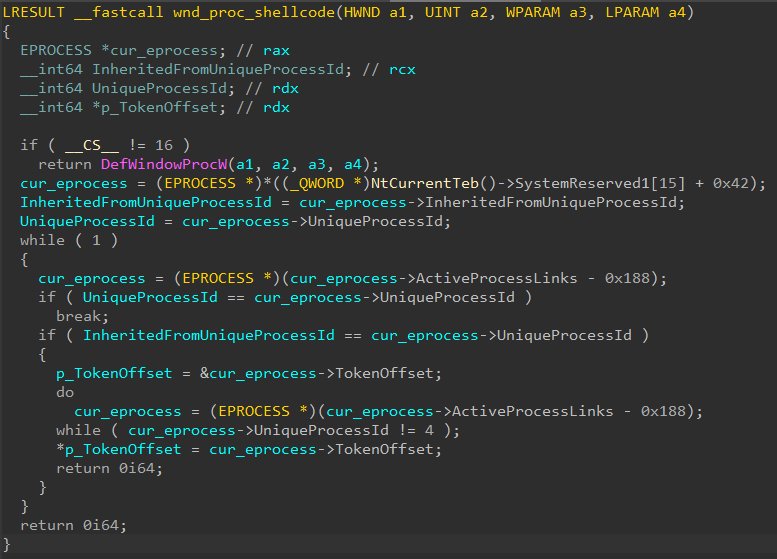 Figure 13 – Token swapping in kernel shellcode
CVE-2021-1732
CVE-2021-1732 is a win32k window object type confusion leading to an OOB (out-of-bounds) write. It was used as a 0-day in the wild by Bitter APT and written by Moses – also known as Exodus Intelligence. We found some resemble to an open source POC in both the flow and how to restore windows after changing the token but also some differences.
CVE-2021-1732 runs on Windows 10, with the targeted build number range being from 16353 to 19042. For the second exploit, it also checks if the package KB4601319 of the patch is present.
Versioning Decisions
Querying OSBuildNumber from the PEB in order to decide on a number of offsets (some of them are 0x40 different from real offset due to the type of read primitive):
- Build number greater than 19041
- offset_ActiveProcessLinks = 0x448
- offset_token = 0x4b8
- offset_UniqueProcessId = 0x400
- Build number greater than 18362 but less than 19041
- offset_ActiveProcessLinks = 0x2f0
- offset_token = 0x360
- offset_UniqueProcessId = 0x2a8
- Build number greater than 15063 but less than 18362
- offset_ActiveProcessLinks = 0x2e8
- offset_token = 0x358
- offset_UniqueProcessId = 0x2a0
- Build number less than 15063
- offset_ActiveProcessLinks = 0x2f0
- offset_token = 0x358
- offset_UniqueProcessId = 0x2a8
This is pretty weird because the check inside RaspberryRobin is that the version is between 16353 to 19042
HMValidateHandle Wrapper
As in CVE-2020-1054, it gets the HMValidateHandle from searching inside the IsMenu code for 0xe8 opcode. It searches in the first 0x20 bytes for this opcode. This function is identical to the same function in the other exploit.
Naming
Registering class with the name: “helper_cls” and then registering (spray handles) windows from this class with the name: “helper”.
Privilege Elevation
The exploit uses Arbitrary-Read & Arbitrary-Write exploit primitives, based on the vulnerability feature in conjunction with GetMenuBarInfo and Call SetWindowLong to write data to the address of the kernel-space desktop heap.
Token Swap
Scanning the EPROCESS.ActiveProcessLinks until finding the System process (PID = 4) and our process (equal our PID) using an Arbitrary-Read / Arbitrary-Write exploit primitives. It then writes the process’s token address to wndMax.pExtraBytes and then writes to this address the system token.
 Figure 14 – Token Swap using the exploit primitives
Notable info
The exploit gets the ETHREAD structure using the API NtQuerySystemInformation with SystemExtendedHandleInformation and iterates SYSTEM_HANDLE_TABLE_ENTRY_INFO_EX for handles until getting the one with the thread ID as the running thread.
Conclusion
Anti-debugging and other evasions can be pretty exhausting, and even more when it comes to such obfuscation methods and volume of methods as Raspberry Robin implements. We showed plenty of methods with explanations of how they work and how to evade those evasions. Raspberry Robin implemented other cool tricks and exploits showing that he also has capabilities in the exploiting area. Unfortunately, the world of evasions is only getting harder and more creative, so buckle up and pray that somebody already encountered this evasion before you.
Check Point TE has developed and deployed a signatures named “Trojan.Wins.RaspberryRobin” to detect and protect our customers against the malware.
The post Raspberry Robin: Anti-Evasion How-To & Exploit Analysis appeared first on Check Point Research.
Article Link: Raspberry Robin: Anti-Evasion How-To & Exploit Analysis - Check Point Research