This is a guest entry written by Martin Perrier and Louis Jacotot from Synacktiv. The views and opinions expressed in this blog post are solely those of the authors and do not necessarily reflect the views or opinions of Hex-Rays. Any technical or maintenance issues regarding the code herein should be directed to the authors.
Frinet is a project that aims at facilitating reverse-engineering, vulnerability research, and root-cause analysis with an execution trace. It combines a Frida-based tracer that supports iOS, Android, Linux, Windows, and most related architectures with an enhanced version of the Tenet trace explorer. This IDA plugin by Markus Gaasedelen won first place in Hex-Rays' 2021 Plug-In Contest. The improvements we introduced on Tenet are based on our needs while using the plugin on real case studies.
The following image shows a screenshot of IDA Pro after importing a trace generated on the curl utility with this command line:
python3 trace.py spawn /tmp/curl-7.88.1/bin/curl curl 0x256d9 -a "curl,-k,https://127.0.0.1:5000/test
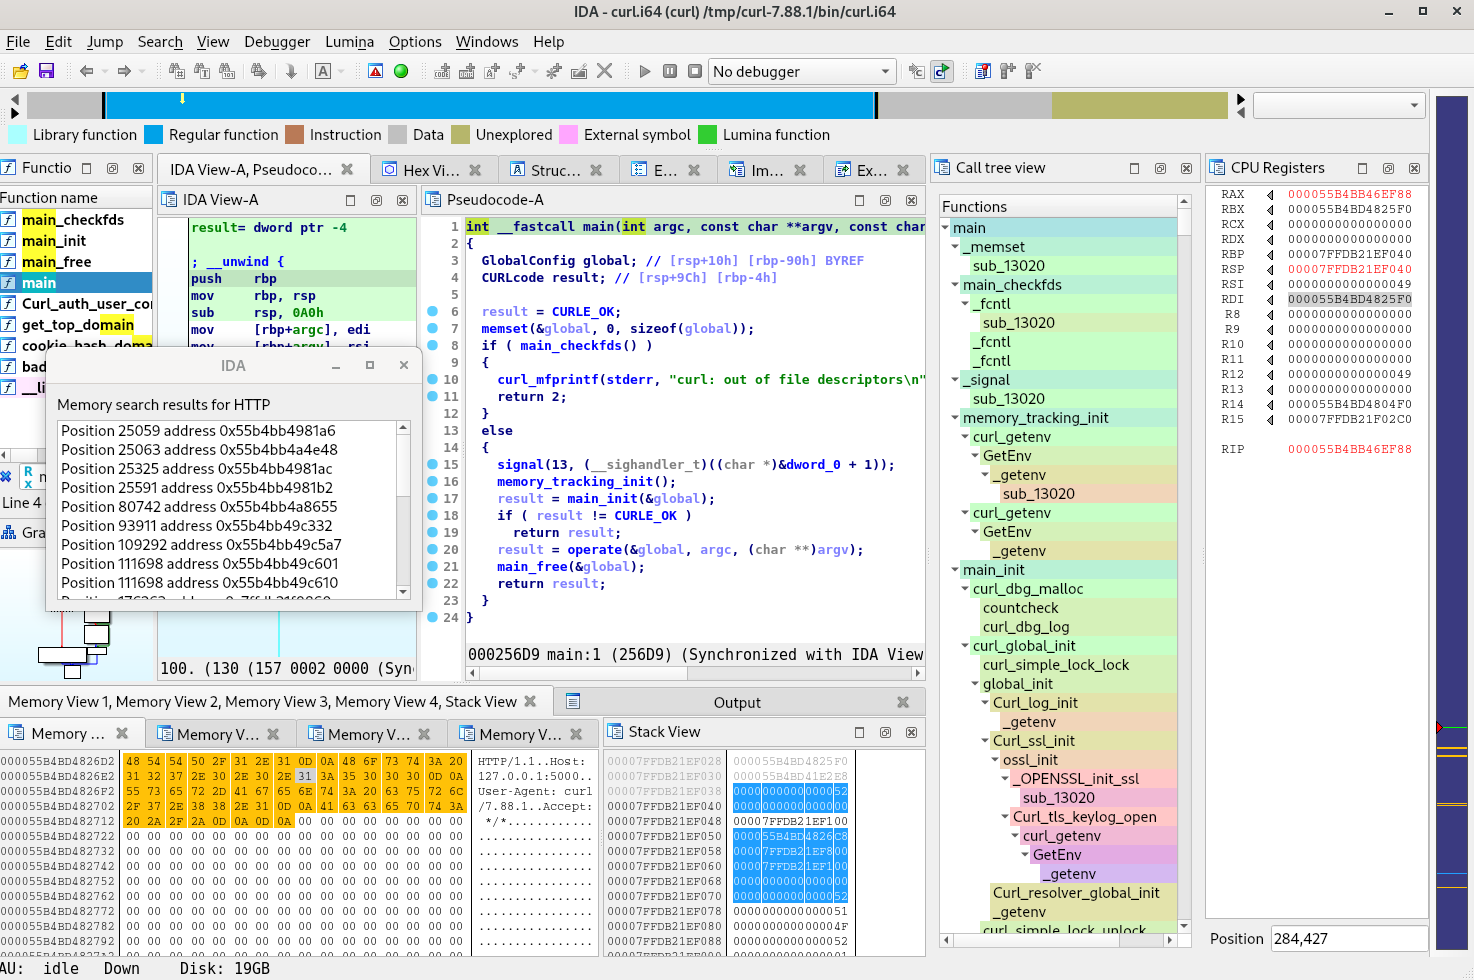
Tenet trace explorer
Upon loading a trace, Tenet opens several subviews:
- The Trace Timeline, displaying the location of the current instruction in the trace
- The CPU Registers view, displaying the live values of the registers
- The Memory/Stack View, useful for inspecting memory and placing Memory Breakpoints
The currently inspected instruction is also highlighted in the assembly view. All those features are described and illustrated in more detail in the blog post of Tenet's original author.
Improving Tenet
Minor improvements have been made to Tenet, such as bug fixes, adding several memory views, and having the possibility to embed the ASLR slide directly in the trace file. However, the most important new features are the Tree View and Memory Search.
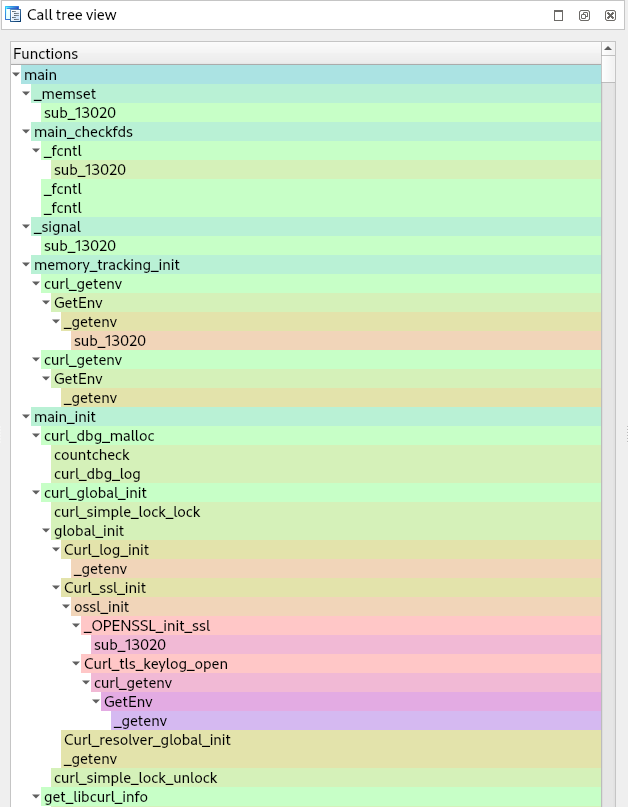
Tree view
This new subview opens when a trace is loaded. It shows the equivalent of a call stack trace, but spans the whole trace. This makes the trace easier to explore and navigate, as every function can be clicked to jump to the corresponding index. It is also possible to expand/collapse each function call and filter function names using regular expressions.
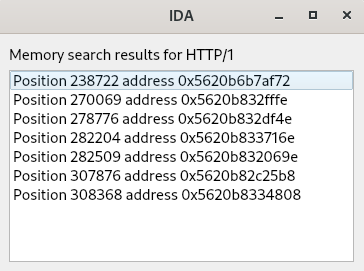
Memory Search
This feature is available through the right-click context menu of the Memory View. It is possible to select bytes in the Memory View and search for them in the trace or type the search pattern directly in a text box. Search results are then presented to the user in a new window and can be clicked, making a direct jump to the occurrence that was found. It does not simply search the memory at a specific point in time but at any position in the trace. This means, for example, that looking for the parsing of a specific byte sequence in a trace is now very easy, even if this sequence was read byte by byte using different instructions at some unknown point in the trace.
Conclusion
Frinet is our attempt at facilitating reverse-engineering of large programs based on a dynamic execution trace. The new features are still experimental, but we welcome feedback from the community to improve the plugin. Furthermore, we plan on refactoring the trace backend with a native implementation for performance and introducing new features such as searching for register values, supporting execution traces with multiple threads and adding user xrefs to indirect calls.
The Frinet project is released on GitHub: https://github.com/synacktiv/frinet.
The modified IDA Tenet plugin is available in the tenet/ subrepository.
Article Link: https://hex-rays.com/blog/plugin-focus-frinet/