Windows offers tons of useful tools that administrators can leverage to perform their daily jobs. A lot of times, those tools are looked at from an offensive standpoint and use cases for them are discovered. Earlier this year I read a message from a co-worker Lee Christensen (@tifkin_) about Service Performance DLLs and upon further review, it seemed like there was potential for new opportunities to come from it.
Quick Background
Windows constantly collects performance data, which administrators can then use for troubleshooting and other purposes. A common tool that is leveraged is Performance Monitor, which gives information that Windows collected for services, processes or other host activity. The collected pieces of information come from libraries provided by applications, Windows’ PerfLib, or from Windows-provided DLLs. There are two versions of performance data collection specified by Windows (V1 and V2). Microsoft recommends going forward to leverage V2, but there are still V1 collectors around that will be useful for us in regards to lateral movement.
The performance collector version will determine where in the registry necessary files are referenced. For V1 providers, this is stored in Computer\HKEY_LOCAL_MACHINE\SYSTEM\CurrentControlSet\Services\<Service Name\Performance while V2 is stored in Computer\HKEY_LOCAL_MACHINE\SOFTWARE\Microsoft\Windows NT\CurrentVersion\Perflib\_V2Provider.
Performance Monitor knows what information to collect based on information located in INI files that are read into the registry. The information in the INI files includes counters and instances that are collected for the specific service. Each service that has performance monitors registered has their INI files in C:\Windows\INF\<Service Name>.
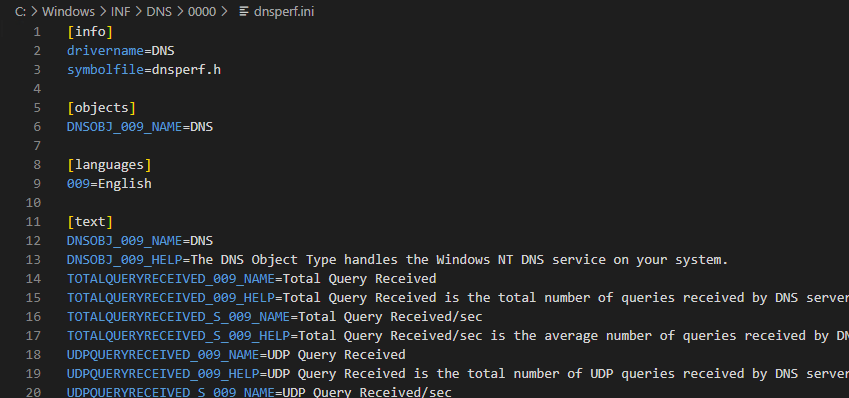 DNS Service INI File
As an example is the DNS service on a Windows Server has a counter of “Total Query Received,” which (as you can guess) is a performance monitor for the total number of DNS queries the host has received. Outside of Performance Monitor, Windows offers other ways for administrators to get data from these counters. We’ll dive a little bit into this information later in the blog, but for now, I’ll just summarize and state that this information can be gathered either locally or remotely.
Weaponization
One thing that I try to look for from time to time is an alternative for lateral movement outside of what is public information; of that, is identifying new methods of leveraging what is already known. For example, creating a new way of executing something through WMI without leveraging common classes such as Win32_Process, Win32_Service, or Win32_ScheduledJob (or any of the techniques laid out here). Taking what we know about performance data collection, we can leverage two classes for lateral movement: Win32_PerfFormattedData and Win32_PerfRawData. The classes provide ways of collecting and displaying performance data based on particular services or software that is installed on the host. We can use a few methods to get information about what is available to us on local or remote hosts using registry querying and WMI.
To weaponize this, we will want to identify collectors that have DLLs associated with them in the registry. There are multiple ways we can go about doing this. We can use something like this to recurse this registry path to find any services that would have a Performance registry key and values
Get-ChildItem -Path ‘HKLM:\SYSTEM\CurrentControlSet\Services’ -Recurse | Where-Object { $_.PSPath -like “*Performance*” } | ForEach-Object { Write-Output $_.PSPath }
 PowerShell Command For Querying Registry
If we want to see a list of classes and objects we can collect data from, you could also do something like:
Get-WmiObject Win32_PerfFormattedData | Select-Object __CLASS | Sort-Object -Unique -Property __CLASS | format-list
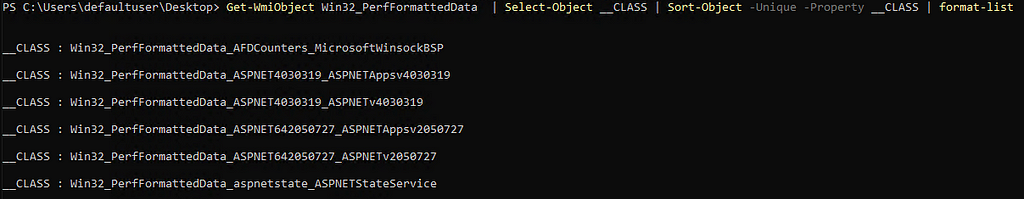 Collecting Win32_PerfFormattedData Information
Keep in mind this will return everything that is registered with the Win32_PerfFormattedData class and not just DLLs we can modify in the registry; ergo, not every value here should be considered as immediately abusable. These PowerShell one liners are for local enumeration, but this data can also be gathered remotely.
Returning to our Windows Server DNS service example, the Performance registry key typically has a few subkeys that we could leverage for successful execution.
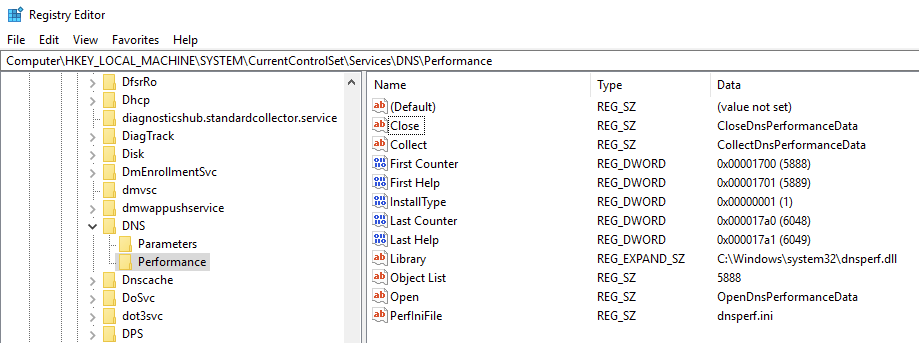 Registry Entry for DNS Service Performance
The “Library” value contains the location of the DLL that is collecting the Performance information. When WMI collects the data, that DLL is loaded and, depending on the counter, will collect that information and update values. In order for that collection to take place, the Performance Monitor needs to know which functions to run for each piece of the collection. The Open, Collect, and Close values are where this information comes from. When the Performance Monitor runs the DLL, it requires three exported functions from the DLL that align with these three registry values; thus, the performance DLL must have these three exported function names match each phase of the collection. All three of the registry keys must match for the DLL to be loaded.
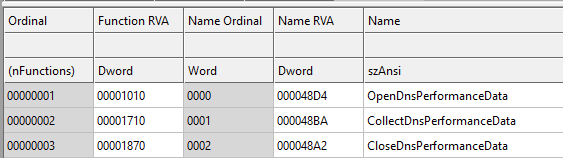 DLL Exported Functions
Weaponization steps for this would require dropping a DLL on target, updating the Library registry value with the DLL location, and updating the Open, Collect, and Close registry values to reflect the exported functions of the DLL. If the DLL has the names of the exported functions that are already reflected in the registry, then only the Library value would need to be changed. The last step for execution is to collect any type of performance data. This can be done through two different methods.
The first option available, .NET, offers a way to interact directly with diagnostic data through the System.Diagnostics namespace. This would specifically be the PerformanceCounter and PerformanceCounterCategory classes. Using this library would enable access into querying or collecting performance data locally and remotely. When interacting with this remotely, it would use remote registry protocol with DCOM for the collection and diagnostic data to be gathered. For this specific usage, it would require using .NET for tooling, but if this proves to be a problem, there is a second option we can leverage.
OPSEC Note: If successful, this method of execution will result in a process running as NT AUTHORITY/LOCAL SERVICE and will either run in SVCHOST.exe or spawn from SVCHOST.exe depending on the execution if it is in the DLL or a process is spawned. The SVCHOST process will be the remote registry service.
The second option available is WMI for execution. As previously mentioned, WMI has two classes that can be used to retrieve data and ultimately execute the DLL. Both the Win32_PerfFormattedData and Win32_PerfRawData classes would accomplish this. Using a WQL query for those classes based on data that has already been discovered would result in loading the DLL and successful execution. To make this fully WMI compatible, the StdRegProv class of WMI can be used to update the registry keys and the WMI query can be run as well. Using the DNS service’s service we previously mentioned, the following query can be ran:
Get-WmiObject -Namespace “root\cimv2” -Query “SELECT * FROM Win32_PerfRawData_DNS_DNS”
 WQL Query for Win32_PerfRawData
Since we don’t care about the collected data, we can query specific values from the class to get the collection. Any type of collection will result in the performance DLL being loaded. One thing to consider is unless the DLL dropped is properly formatted as the service’s performance collection, it will result in an error and the data will not be collected. However, that doesn’t make a huge difference for us because we are after execution rather than information. Here’s an example of what this query would look like:
Get-WmiObject -Namespace “root\cimv2” -Query “SELECT TotalQueryReceived FROM Win32_PerfRawData_DNS_DNS”
 WQL Query for DNS Win32_PerfRawData
Note: A pitfall for the WMI execution option is WMI is not constantly collecting this information; it is collected in intervals. This means that if we run this WMI query multiple times very quickly, it will not result in the collection and will not successfully load the DLL. Instead, it will display the most recent stored information from the WMI database. If it fails initially, it is recommended waiting a little bit before trying it again. There are some potential methods of ensuring refreshed data is collected every time, but that path was not followed too deep. Additionally, unlike the System.Diagnostics method of execution the resulting process will run as NT AUTHORITY/SYSTEM and in or a child of WMIPRVSE.exe.
Fixing Potential Problems
If a collection is run and Windows does not collect information in the expected way, errors will likely show up. There are cases when Windows disables a performance counter because it has run into errors too many times. There is potential for this to happen if the registry keys are updated and not changed after execution takes place. Windows offers a tool that can fix any broken performance counters if this ever becomes a problem. The lodctr.exe executable will parse provided INI files and update the registry settings to restore settings back to their original state. It can fix one or all broken performance counters if necessary. This would require running and specifying the single INI file or an entire directory for it to recurse.
Persistence Opportunities
Performance counters can be manually created and registered with Performance Monitor. Creating a performance counter DLL and collecting dummy information would offer further opportunities for persistence or other services to leverage for lateral movement. There is a little bit more overhead when building a collector from scratch and registering it with Performance Monitor, but it is doable. One option is proxying DLL exports to the properly formatted performance DLL, but I did not follow that path.
Tooling
I have released proof of concept tooling on GitHub at https://github.com/0xthirteen/PerfExec, where I give an example DLL for the performance counter and .NET tooling that discovers performance counters and follows the steps above. I also plan to incorporate this into SharpMove.
Defensive Considerations
Detecting potential malicious use of performance data can be prone to false positives and would require a good baseline of WMI data in an environment. When collecting performance data or executing the Win32_PerfFormattedData or Win32_PerfRawData WQL queries, the wmiprvse.exe process will query all of the V1 and V2 registry keys for performance DLLs. As you can imagine, this results in a fairly large number of specific registry key reads in a short period of time.
Another option is to collect telemetry on how often those WMI classes are used or called remotely in the environment. Typically data should be collected by Performance Monitor rather than remotely through WMI.
Finally, a specific set of registry values for the service are created when executing a performance collection if a problem is detected by Performance Monitor. This happens even in a quick one off failure of the performance collection.
 Value Created When Failure Detected
Looking for the existence of that key could signal that a performance collection was modified. If a collection fails too many times Windows marks that performance counter as disabled and no longer works until restoring manually or with the lodctr tool previously mentioned.
Conclusion
Performance Monitor offers some interesting ways for attackers to extend their lateral movement or persistence opportunities by hijacking a service’s performance DLL. With this, we gain a novel WMI lateral movement primitive and I do believe there is a lot more to be explored here. Both V2 providers were not looked at in depth and has potential for further discoveries.
This post has also been shared at 0xthirteen.com
Performance, Diagnostics, and WMI was originally published in Posts By SpecterOps Team Members on Medium, where people are continuing the conversation by highlighting and responding to this story.
Article Link: Performance, Diagnostics, and WMI | by Steven F | Jul, 2023 | Posts By SpecterOps Team Members