Introduction
The offensive security industry is a curious one. On the one hand, we are ahead in various trends (or “thought leadership,” as some would have us term it) and are used to literally “moving fast and breaking things.” On the other hand, we’re far behind similar disciplines. One major area where offensive security has historically been a bit lacking is proper software engineering for offensive tooling. From proper unit testing to continuous integration/continuous delivery (CI/CD) integration, we’re sometimes behind our more mature industry parallels.

Why is this? Possibly, it’s that offensive engineering has an asymmetric nature. To make a long story short, a small amount of offensive code can go a long way and many most of us in the offensive industry are not proper software engineers. All it takes is for a real software engineer to come in and show us how it’s really done, but in general we tend to be focused on PoC||GTFO, or read a different way (in practice) IW,SWGAS “It Works, So Who Gives a ****”.
This results in the offensive development landscape diverging from its defensive counterpart. The post-exploitation sector of offensive security has generally given away/open-sourced a lot of/most code that other teams can easily work into their workflows and while the defensive industry does have a number of open-source software (OSS) projects, there have historically been more challenges in operationalizing in environments due to scale and workflow/technology integration issues. While there are obviously exceptions to this (and the full reason for why this is the case is enough to fill another blog post), the commercialization opportunities for the defensive industry have far outweighed the offensive industry; at least in the private sector.
In general, with money comes professionalism, and the defensive industry has had money come in spades while the offensive industry has generally been more lacking. This often leads to blind spots, where we as an offensive industry could be benefiting from the established software engineering practices of more major industries.
We believe there is a seemingly minor but effectively major oversight in offensive security, specifically the post-exploitation space: structured data. In particular, while the OSINT and scanning side of the house has generally taken advantage of structured data, the post-ex side hasn’t quite kept up. Likewise, the defensive industry has really run with structured data due to the scale of what they have to process. We will cover some of the red versus blue data caveats later in this post.
This is the first post in a series where we will cover why this is an important concept, what we think we can do with it, and what we are doing about it.
On the Red Side
Tools handling OSINT have generally been pretty welcoming of structured data; things like Shodan, Maltego, recon-ng, etc., have long been pulling in disparate pieces of information for the purposes of correlation. Likewise, scanning tools like Nmap, Nessus, and the like have had structured output for practically forever; allowing integration of this type of data into other tools and processes (e.g., loading Nmap scans into Metasploit).
Another category is attack simulation tools (e.g., DeathStar, ANGRYPUPPY, ATT&CK’s Caldera, etc.) that allow you to execute sequences of offensive actions based on structured data inputs. Some other recent tools like CISA’s RedEye have started to focus on visualization of attack data (like Cobalt Strike logs). And finally, there are the log aggregators, like RedELK, which aim to create a red team SIEM including “…a central location where all relevant operational logs from multiple teamservers are collected and enriched” and “…where all traffic logs from redirectors are collected and enriched.” Additionally, SpecterOps’s own GhostWriter functions as our security project management and reporting engine. A lot of these are extremely useful but have generally focused on processing, visualization, and indexing/searching of command and control (C2) logs.
When we move to the post-ex realm of tools, things are not quite the same. BloodHound has had a lot of success in visualizing attack paths from collected structured data and JackDaw, Adalanche, and ROADTools can collect/visualize similar information in a similar way. Some offensive tools like the venerable Metasploit Framework and frameworks like CrackMapExec do have internal databases that store collected information in a fairly structured manner, but this tends to be used more for result tracking and storage.
In general, output from many offensive tools is currently structured for human analysis versus being structured for computers. Most of the most popular C2 frameworks have textual output with maybe some regex scraping for basic extraction thrown in (shoutout to Mythic for being a notable exception with its extremely robust data model!). As tool developers, my workmate Lee Christensen and I are 100% guilty of this ourselves, with almost all of the post-ex tools in GhostPack having textual output with Seatbelt being the notable exception.
Note: The above was not meant to be an exhaustive list of all offensive tools that use structured data, but rather highlight general tool trends. So yes; we know we missed some and the statements made above are not absolutes and have exceptions.
Our goal with this post is to explore characteristics and caveats of offensive structured data and to make the case why we should move towards more robust structured output for offensive tooling.
Red versus Blue: Data Edition
There are a number of fundamental differences between data on the red and blue side.
One reason for this comes back to our old friends: false positives, false negatives, and the base rate fallacy. The blue side, in general, needs to be extremely accurate. Too many false positives can result in “alert fatigue” for analysts, which can in turn result in desensitization to incoming alerts, antivirus software deleting necessary operating system (OS) files, or analyst teams completely missing offensive campaigns.
Due to the sheer scale of data that is handled and processed on the defensive side, combined with the relative rarity of “malicious” events, means that the base rate fallacy often complicates the situation. For example, let’s say we have a million events collected in an organization and .01% (100) of these events are malicious. If we run a detection that is 99% accurate, we will likely only fail to detect one of the malicious events (.99 * 100 = 1), but will misclassify 9,999 events (999,900 * (1-.99) = 9,999) as malicious when they’re actually benign.
On the offensive side, operators handle false positives and false negatives differently. Generally, the red side is significantly more tolerant of both. Chasing down a promising lead for privilege or domain escalation that ended up not working out (false positive) is something that happens frequently to operators and missing a specific attack path that could result in complete environment compromise (false negative) is just part of the job. Also, because offensive data collection historically has been fairly targeted and significantly smaller scale than the blue side, the base rate fallacy doesn’t affect us quite as much. Collection in itself is another fundamental difference; it’s generally much easier to collect whatever data you want on your defensive home turf than it is to collect large amounts of data when you’re trying to sneak around without being caught.
This all results in offensive data not having to be 100% accurate to provide value. Offensive tools often make mistakes in data collection or attack execution, but there’s almost always another path in an environment. This relates back to the asymmetric nature of offensive operations, the “defender’s dilemma”, and the newly emerging “attacker’s dilemma.”
 Now we can all dilemma together.
There are also often fundamental differences in how offense and defense will even look at the same data. An offensive operator’s goal on a system is often looking for access to abuse while a defensive analyst’s goal is looking for access that was abused. That is, operators generally think in “what’s possible” while defenders generally think in “what’s happened.”
For example, let’s take a 4648 Windows event (“A logon was attempted using explicit credentials”) which occurs, “…when a process attempts an account logon by explicitly specifying that account’s credentials.” A defender may view this in the context of, “Did an attacker abuse stolen account credentials to run a new program?” Conversely, an operator may view this as, “A program used alternate credentials that I can almost certainly steal/recover.”
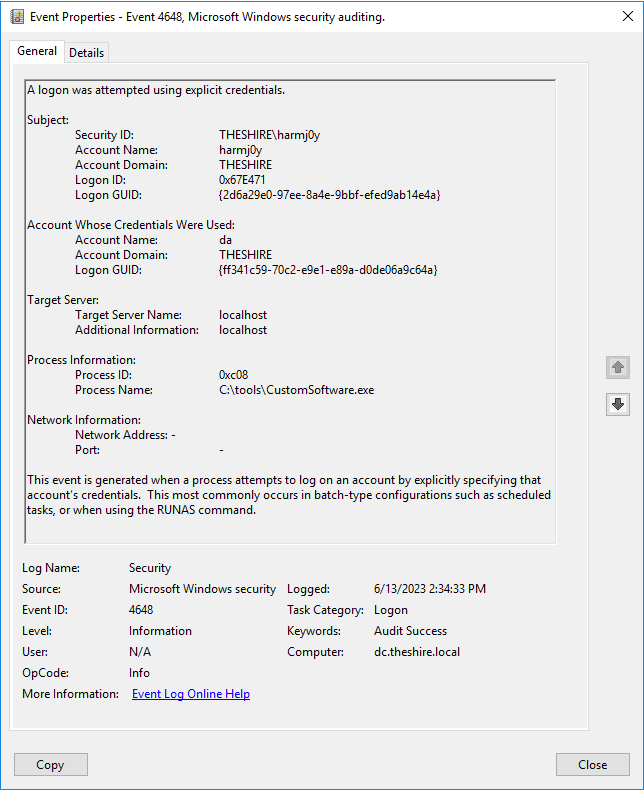 An example 4648 explicit logon event.
Obviously, this is a generalization but one that generally holds true. While the defensive industry has made huge strides in the collection, enrichment, and processing of large amounts of structure data to determine what malicious actions have occurred (in our opinion, one of the reasons the endpoint detection and response [EDR] industry has made life increasingly more difficult for the red side), the red team/post-ex side hasn’t made the same strides in using structured data to determine what all is possible.
Another thing we wanted to cover: on-host versus off-host processing. Historically, offensive tools have done a lot of processing on the host itself and returned relevant “interesting” information. Again, this is at least partially due to humans being the consuming party instead of additional tools or enrichment processes. While parts of the defensive industry use small host-based models to facilitate active response and enrichment, typically lots of data is shipped off and correlation/analysis is done in a security information event management (SIEM) or the magic-AI-EDR-whatever cloud. Part of this is that on-host processing is also limited by the compute power of the machine you’re collecting from. With raw data being shipped off host, the bottleneck then becomes the throughput and ability to get data through your communications channel rather than the restrictions of processing power on the target host. This is something that, as operators, we definitely have to consider.
 Yes, I know we already used this meme–but now the font’s different!
A great example that we are guilty of was the automation of privilege escalation. Tools like PowerUp would calculate and return privilege escalation opportunities but wouldn’t return all the data it collected. This made sense at the time, as we didn’t want to drown operators in data that could be fairly time consuming to manually process, but this comes with a big disadvantage: we’re essentially compressing the data and losing information. Specifically, if there are additional attacks discovered in the future that could be derived from the raw data, we lose the ability to run that future analysis.
The last complicating factor for offensive collection we wanted to touch on, besides the general lack of consumable structured data from post-ex tools mentioned previously, is exactly how the data flows to offensive analysts. Depending on call back intervals and C2 channels, the size of it might not just be the size pipe you’re using for communication but also how often you get data back. This can result in a “gradual ingestion” type of situation where you sporadically get pieces of data back that may be dependent on each other. This can result in uncertainty in the analysis you’re performing or the data model you’re building and has implications that we’ll cover in a future post.
The Future of Offensive Data
So why are we harping on all of this? You may even be asking yourself, “What’s the point?”
We believe the proper collection, processing, and enrichment of “offensive” data can provide an immense amount of utility for the red team community. It could allow us to centralize data from all tools in an engagement in the same place, giving us the chance to exploit various connections exposed by the data’s structure.
If all of our offensive tools produced and worked with structured data, what would be possible?
On (Structured) Data was originally published in Posts By SpecterOps Team Members on Medium, where people are continuing the conversation by highlighting and responding to this story.
Article Link: On (Structured) Data. Introduction | by Will Schroeder | Jul, 2023 | Posts By SpecterOps Team Members