Custom metrics are application-level or business-related tailored metrics, as opposed to the ones that come directly out-of-the-box from monitoring systems like Prometheus (e.g: kube-state-metrics or node exporter)
By kickstarting a monitoring project with Prometheus, you might realize that you get an initial set of out-of-the-box metrics with just Node Exporter and Kube State Metrics. But, this will only get you so far since you will just be performing black box monitoring. How can you go to the next level and observe what’s beyond?
They are an essential part of the day-to-day monitoring of cloud-native systems, as they provide an additional dimension to the business and app level.
- Metrics provided by an exporter
- Tailored metrics designed by the customer
- An aggregate from previous existing metrics
In this article, you will see:
- Why custom metrics are important
- When to use custom metrics
- Considerations when creating custom metrics
- Kubernetes Metric API
- Prometheus custom metrics
- Challenges when using custom metrics
Why custom metrics are important
Custom metrics allow companies to:
- Monitor Key Performance Indicators (KPIs).
- Detect issues faster.
- Track resource utilization.
- Measure latency.
- Track specific values from their services and systems.
Examples of custom metrics:
- Latency of transactions in milliseconds.
- Database open connections.
- % cache hits / cache misses.
- orders/sales in e-commerce site.
- % of slow responses.
- % of responses that are resource intensive.
As you can see, any metrics retrieved from an exporter or created ad hoc will fit into the definition for custom metric.
When to use Custom Metrics
Autoscaling
By providing specific visibility over your system, you can define rules on how the workload should scale.
- Horizontal autoscaling: add or remove replicas of a Pod.
- Vertical autoscaling: modify limits and requests of a container.
- Cluster autoscaling: add or remove nodes in a cluster.
If you want to dig deeper, check this article about autoscaling in Kubernetes.
Latency monitoring
Latency measures the time it takes for a system to serve a request. This monitoring golden signal is essential to understand what the end-user experience for your application is.
These are considered custom metrics as they are not part of the out-of-the-box set of metrics coming from Kube State Metrics or Node Exporter. In order to measure latency, you might want to either track individual systems (database, API) or end-to-end.
Application level monitoring
Kube-state-metrics or node-exporter might be a good starting point for observability, but they just scratch the surface as they perform black-box monitoring. By instrumenting your own application and services, you create a curated and personalized set of metrics for your own particular case.
Considerations when creating Custom Metrics
Naming
Check for any existing convention on naming, as they might be either colliding with existing names or confusing. Custom metric name is the first description for its purpose.
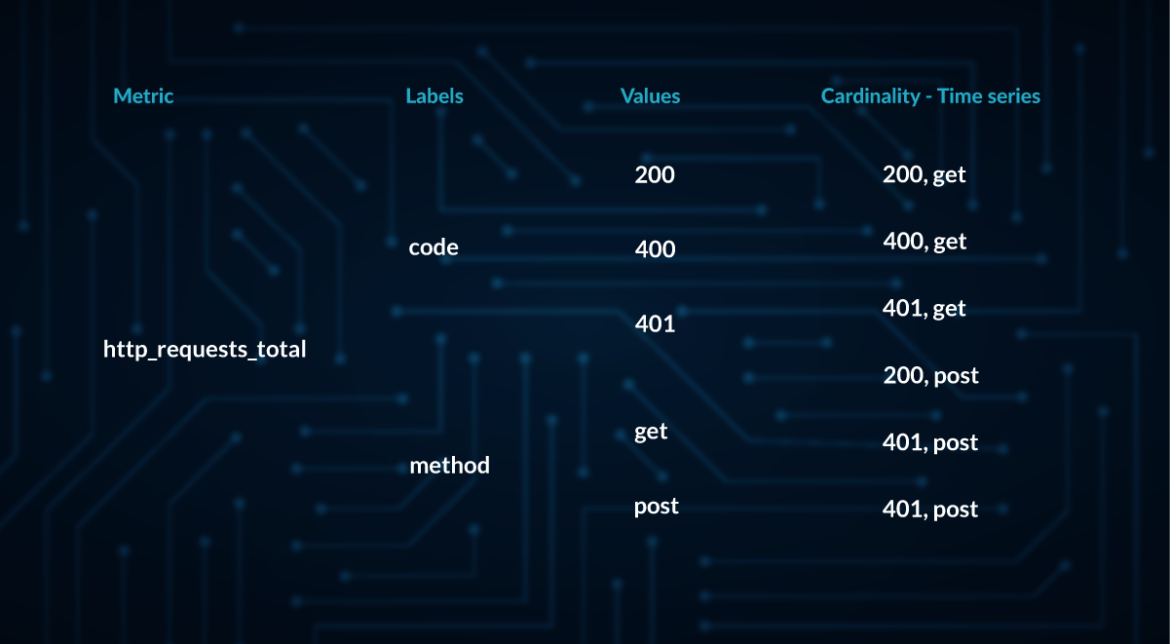
Labels
Thanks to labels, we can add parameters to our metrics, as we will be able to filter and refine through additional characteristics. Cardinality is the number of possible values for each label and since each combination of possible values will require a time series entry, that can increase resources drastically. Choosing the correct labels carefully is key to avoiding this cardinality explosion, which is one of the causes of resource spending spikes.
Costs
Custom metrics may have some costs associated with them depending on the monitoring system you are using. Double-check what is the dimension used to scale costs:
- Number of time series
- Number of labels
- Data storage
Custom Metric lifecycle
In case the Custom Metric is related to a job or a short-living script, consider using Pushgateway.
Kubernetes Metric API
One of the most important features of Kubernetes is the ability to scale the workload based on the values of metrics automatically.
Metrics API are defined in the official repository from Kubernetes:
metrics.k8s.iocustom.metrics.k8s.ioexternal.metrics.k8s.io
Creating new metrics
You can set new metrics by calling the K8s metrics API as follows:
curl -X POST \
  -H 'Content-Type: application/json' \
  http://localhost:8001/api/v1/namespaces/custom-metrics/services/custom-metrics-apiserver:http/proxy/write-metrics/namespaces/default/services/kubernetes/test-metric \
  --data-raw '"300m"'
Prometheus custom metrics
As we mentioned, every exporter that we include in our Prometheus integration will account for several custom metrics.
Check the following post for a detailed guide on Prometheus metrics.
Challenges when using custom metrics
Cardinality explosion
While the resources consumed by some metrics might be negligible, the moment these are available to be used with labels in queries, things might get out of hand.
Cardinality refers to the cartesian products of metrics and labels. The result will be the amount of time series entries that need to be used for that single metric.
Also, every metric will be scraped and stored in a time series database based on your scrape_interval. The higher this value, the higher the amount of time series entries.
All these factors will eventually lead to:
- Higher resource consumption.
- Higher storage demand.
- Monitoring performance degradation.
Moreover, most common monitoring tools don’t give visibility on current cardinality of metrics or costs associated.
Exporter over usage
Exporters are a great way to include relevant metrics to your system. With them, you can easily instrument relevant metrics bound to your microservices and containers. But with great power comes great responsibility. Chances are that many of the metrics included in the package may not be relevant to your business at all.
By enabling custom metrics and exporters in your solution, you may end up having a burst in the amount of time series database entries.
Cost spikes
Because of the elements explained above, monitoring costs could increase suddenly, as your current solution might be consuming more resources than expected, or your current monitoring solution has certain thresholds that were surpassed.
Alert fatigue
With metrics, most companies and individuals would love to start adding alerts and notifications when their values exceed certain thresholds. However, this could lead to higher notification sources and a reduced attention span.
Learn more about Alert Fatigue and how to mitigate it.
Conclusion
Custom metrics represent the next step for cloud-native monitoring as they represent the core of business observability. While using Prometheus along kube-state-metrics and node exporter is a nice starting step, eventually companies and organizations will need to take the next step and create tailored and on-point metrics to suit their needs.
The post Monitoring with Custom Metrics appeared first on Sysdig.
Article Link: Monitoring with Custom Metrics – Sysdig