 Image taken from https://pixabay.com
Measuring performance is a crucial aspect of any task we do. That is how we get to know if we are on the path of growth or not. Same goes for every application we develop. It’s important to monitor it so that we assure of having a near zero downtime and a seamless UX for our users.
Why measuring application performance is important
- Almost all the applications today put a lot of KPIs in place to understand how their servers are performing under continuous load using tools like Grafana, Dynatrace which gives them holistic view of all the metrics.
- Similarly, it is also important to understand how our application is performing inside the browser. It becomes a lot more important if the application is client facing to understand following points -
- What is the experience an user is getting from the moment he enters our application’s url in the browser’s address bar.
- Improving our application’s SEO for getting a better indexing by search engines. For example, Google’s indexing is highly based on how performant our application is based on Core Web Vitals which is an industry standard KPI for deriving performance of an application.
So let’s understand a bit more on the Front End performance measuring tools and some important KPIs.
Current Frontend Performance Monitoring tools in market
There are lots of tools like LogRocket, Dynatrace, Google Page Insights already available in the market today which gives us the flexibility to monitor the RUM (Real User Monitoring) metrics and configure separate dashboards for different performance KPIs.
We can configure our environments on these tools but lets understand the catch here -
- Since RUM metrics are taken from real users interacting with your system, the data differs a lot based on the network bandwidth OR the device used by the users .
- These metrics are effective from the point of view of analysing how the application is performing for actual users. But this data can’t be completely relied upon if we want to understand the actual pain point faced by users during using our application.
- Also, how do we identify and mitigate performance issues during development cycle itself ?
This is where tools like puppeteer and lighthouse come into picture.
What is Puppeteer
Puppeteer is a node module package. It is mostly used as an automation testing and web scraping tool but we can also use it for generating performance report for any application.
Why puppeteer ???
- Metrics for a single page can be extracted from running lighthouse or by running profiling in chrome dev-tools as well, but what if you want to track a whole user journey, a complete workflow OR your application is behind a login mechanism. Puppeteer api’s help us to handle logic to login into application from within our script.
- Also, the puppeteer report in ideal condition can tell us how much time a user takes in completing a workflow.
- More over, dev-tools are not consistent across different browsers but puppeteer has a good support for chrome browser since it provides chromium browser bundled in the node package itself to test our workflow.
How to use puppeteer
- With puppeteer, we can design a JS script to cover a whole workflow and generate the final metrics. This script will be a customised one and will differ on use case basis.
// This will start the tracing once the workflow starts to execute and
// ends when the workflow ends. This will generate a json file
// with the given FILENAME and will cover all the browser metrics.
await page.tracing.start({ path: ${FILENAME}.json });
            …
            …
            …
await page.tracing.stop();- The above code block generates a JSON file which includes all the profiling JSON data after which you can write another custom script to parse your customised KPIs from it like page load time, time taken by the api’s, time spent during network wait etc.
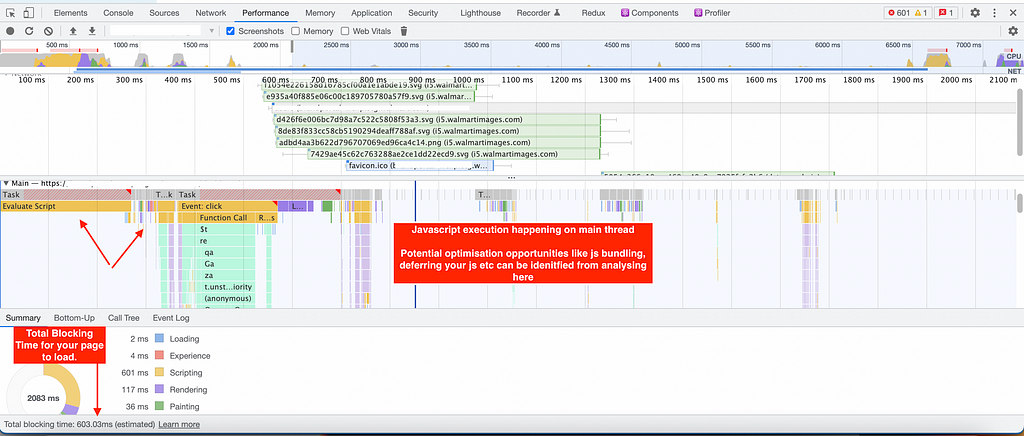
- The json generated from the above step, can also be uploaded in Chrome dev-tools , which will give us a more in depth and visual insights on the javascript execution , css styles calculation, unused javascript / css size etc.
- We can generate predefined generic metrics for a single page in our application by calling native puppeteer api.
await page.metrics();
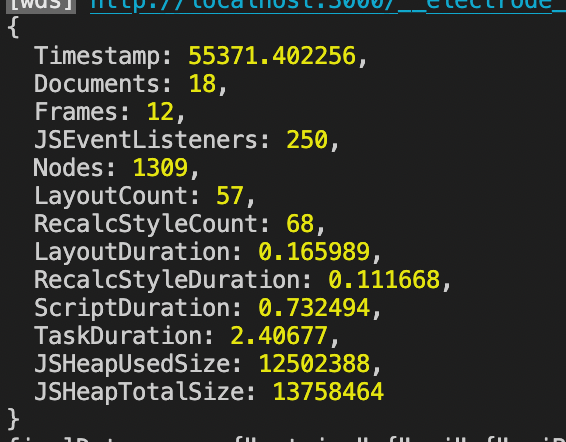 Run time performance Metrics, TaskDuration is the time taken in completing a workflow
More understanding on these metrics can be found here in detail -
https://pptr.dev/api/puppeteer.page.metrics/
https://web.dev/user-centric-performance-metrics/
- We can integrate Lighthouse with Puppeteer, so instead of JSON files, we can see a visual representation of these metrics in our chrome browser. (** Report will only be generated for a single url and not for the whole workflow)
- To conclude this, we can include this customised script to be run individually and based on the requirements, it can also be run as part of the dev/prod build process itself.
BONUS
So far we have got -
- Performance metrics response calculating the total time taken in completing a whole workflow.
- Huge json files covering the workflow run results and all the other metrics (Including some less relevant metrics).
Now what’s the next step here ???
Can we think of automating this process, so that these metrics are captured on a timely basis, monitored regularly and appropriate actions can be taken before releasing the code in prod.
Yes we can do something about it. Let’s look at few of the approaches we could take -
- We can use git hooks to run this report generation script on any code check-in phase (pre-commit, post-commit, pre-merge etc) based on our requirements as it would be easier to analyse these metrics during development phase itself.
More about git-hooks here https://git-scm.com/book/en/v2/Customizing-Git-Git-Hooks - Another approach would be to download another NPM package called node-cron. We can schedule a cron job which will execute our puppeteer script on a timely basis.
How to schedule the cron job on different time values , can be found at this link https://github.com/kelektiv/node-cron/tree/master/examples
This cron job will generate the reports on a timely basis. After that it’s upon us to how to handle this data. We can either -
- Collate all the data in a JSON file
- Write it as a output to HTML file
- Best way is to write a simple NodeJS api and publish this data to the end point. From there we can use any free email service available in the market to send the results across multiple stakeholders.
For getting the hands-on implementation for the BONUS section, lets wait for PART-2 of the article :)
References -
- Header image taken from https://pixabay.com/photos/code-html-digital-coding-web-1076536/
- https://addyosmani.com/blog/puppeteer-recipes/
Frontend Performance Measuring & KPIs
Monitoring Front end Performance using Puppeteer was originally published in Walmart Global Tech Blog on Medium, where people are continuing the conversation by highlighting and responding to this story.
Article Link: Monitoring Front end Performance using Puppeteer | by Sakar Chiplunkar | Walmart Global Tech Blog | Medium