Memory forensics is an important part of incident response and threat analysis, as new threats and sophistication emerge in the evolving cybersecurity landscape. Unlike traditional methods focusing on hard drive analysis, memory forensics dives into the volatile memory, aiming to uncover evidence of malware infections and other illicit activities that leave footprints in a system’s RAM.
Investigators use memory forensics to collect valuable information and evidence from compromised systems. As threat actors try to evade detection using various techniques, fileless malware is particularly challenging. This technique allows malicious code to be executed directly in memory without being written to the disk. Memory forensics proves very handy in these situations.
Memory forensics is the process of analyzing the contents of a computer’s memory to investigate and identify potential security threats or forensic evidence. This analysis is valuable immediately after a security breach or as part of a comprehensive, proactive security assessment. By examining the raw binary data residing in memory, investigators can access different types of information, from running processes and network connections to the previously executed commands and malware artifacts.
As we explore the complexities of memory forensics in the subsequent sections, we will examine its applications, the challenges faced by practitioners, the distinctions between in-memory and disk-based threats, and the leading tools and methodologies in this captivating field. (If you already know the basics of memory forensics, you can jump to the section Memory Forensic Tools in Action.)
Through this examination, we aim to highlight the critical role of memory forensics in contemporary cybersecurity strategies and the continuous fight against digital menaces lurking in our systems’ memory.
Table of contents
What’s Memory Forensics?
Memory forensics is the process of capturing and analyzing a computer’s memory to uncover valuable digital artifacts. These artifacts can include information about currently running processes, open files, network connections, system and user configurations, and, crucially, evidence of malware or hacker activity that might not be detectable through traditional disk-based analysis. This is because many advanced threats operate solely in memory, leaving little to no footprint on the hard drive.
Memory forensics is a specialized branch of digital forensics that analyzes volatile data in a computer’s memory (RAM). Unlike disk forensics, which examines data stored on hard drives and other permanent storage media, memory forensics targets the transient, fleeting data that exists only while a device is powered on. This volatile nature of RAM data presents unique challenges and opportunities for forensic analysts.
Types of Data Retrieved
Memory forensics can retrieve a wide array of data types that provide a snapshot of the system’s state at the time of capture. Some of these data types include, but are not limited to:
- Running Processes: Details about processes currently running on the system, including their memory addresses, execution state, and parent-child relationships.
- Network Connections: Information about active and listening network connections, which can help trace back network-based attacks or data exfiltration attempts.
- Binary Executables and Loaded DLLs: Insights into the executable files and dynamic link libraries loaded into memory, which are crucial for identifying unauthorized or malicious code execution.
- Registry Keys and Configuration Settings: Real-time data on system configuration and registry settings, which can indicate system tampering or policy violations.
- Digital Artifacts: User actions, such as command history, file access, and clipboard contents, can be pivotal in reconstructing user behavior or attacker activities.
On-Disk vs. In-Memory Cyber Attacks
The distinction between in-memory threats and those residing on disk lies in their method of operation and persistence mechanisms, each presenting unique challenges for detection and mitigation. In-memory threats and fileless malware execute and reside entirely within a system’s volatile memory. This volatile nature allows them to evade traditional antivirus and disk-based forensics tools that rely on scanning files and persistent storage for indicators of compromise.
On the other hand, threats that persist on disk involve malware or malicious activities that write files or configurations for non-volatile storage. These threats often include executable files, scripts, or altered system files. In some cases, they are designed to initiate malicious activities upon system startup, thereby ensuring their persistence even after a reboot. Disk-based threats are more readily detectable by conventional security solutions, as they involve tangible artifacts that can be scanned, analyzed, and remediated. However, the increasing sophistication of attackers who employ advanced obfuscation and evasion techniques complicates the detection of both in-memory and on-disk threats, necessitating a comprehensive security strategy that includes memory forensics to uncover and address the full spectrum of cyber threats.
Challenges That Make Manual Memory Forensics Painful
Despite memory forensics’ critical importance in cybersecurity and digital forensics, it is challenging to analyze memory manually. These challenges stem from various technical, logistical, and operational factors contributing to the complexity and sometimes the frustration associated with memory forensics.
Technical Challenges
- Volatile nature of memory: The essence of what makes memory forensics valuable also complicates it. Data in RAM is transient, existing only while a system is powered on and constantly changing. Capturing a truly representative memory snapshot requires precise timing and can be influenced by different factors, from running processes to the system’s load at the moment of capture.
- Large volume of data: Modern systems come with gigabytes to gigabytes of RAM, leading to massive datasets for analysis. Sifting through this vast amount of data to find relevant artifacts is time-consuming and requires significant computational resources.
- Maintaining the integrity of the data: The volatility of RAM means crucial evidence can be lost upon power loss or system reboot, making it difficult to preserve data in its original state. Additionally, because data extraction requires the system to run, the tools used for collection can inadvertently modify the memory contents. Furthermore, as the system operates, ongoing processes may overwrite memory areas containing valuable evidence, complicating efforts to keep the collected data intact.
Logistical Challenges
- Collection Difficulties: Memory dumps must be collected carefully to avoid altering or damaging the data. This may requires physical access to the machine, which is not always feasible, especially in remote or distributed environments.
- Skill Gap: Memory forensics is a highly specialized field that requires deep technical knowledge and expertise. There is a significant skill gap in the industry, with a shortage of professionals who understand advanced analysis techniques.
- Legal and Ethical Considerations: The process of memory capture and analysis must navigate legal and ethical considerations, particularly regarding privacy and data protection. Analysts must ensure compliance with laws and regulations, adding an additional layer of complexity to forensic investigations.
Mitigating These Challenges with Advanced Memory Forensics Tools and Best Practices
While memory forensics presents significant challenges for many organizations, advancements in tools, techniques, and training help to mitigate these difficulties. Automation and machine learning are leveraged to sift through large datasets more efficiently. Community-driven efforts are improving the sharing of knowledge and best practices. Furthermore, the development of more intuitive and powerful forensic tools is gradually lowering the barrier to entry, making memory forensics more accessible to a broader range of professionals. (More on this below!)
Examples of Memory Threats
Regarding examples of threats in memory, we do not lack choice. From novices using snippets of code and scripts, to sophisticated APT groups, many malicious actors use memory payloads.
Cobalt Strike
One of the most famous examples of a memory threat is the penetration testing tool Cobalt Strike. Used by both red teams and threat actors alike, Cobalt Strike has multiple ways to sneakily inject its Beacon into memory. The easiest way is using a stageless payload artifact. The stageless Cobalt Strike payload starts by executing an EXE or script that involves the creation of a thread that sets up a named pipe for privilege escalation. Once the shellcode is written to the named pipe, it is decrypted and executed in a separate thread in memory. More commonly with Cobalt Strike, a stager is used. A stager is an extra step in the deployment of the Beacon payload that uses a small snippet of shellcode that can be delivered using any multitude of methods. Cobalt Strike stagers are designed to be loaded and executed only in-memory. This opens up many possibilities for how this shellcode is shipped, making signature-based detection on the delivery method a cat-and-mouse game. Depending on how the code is delivered, the code can be injected into other legitimate running processes, bypassing defenses that do not scan legitimate processes or code in-memory.
Operation HamsaUpdate
In the Operation HamsaUpdate campaign, a payload was delivered and executed only in memory. The chain started with a Delphi executable that dropped an AutoIt interpreter and an obfuscated AutoIt script. The AutoIt script contained shellcode and an encrypted payload. First, the shellcode was injected into memory. The shellcode is an RC4 decryption routine that was used to decrypt the payload, and the decrypted payload was itself then executed in memory.
Hijacking Execution Flow
A really common method used to execute malware in memory is using DLL Side-Loading. To perform this, some threat actors use a trifecta of a legitimate EXE, a malicious DLL loader, and an encrypted payload to execute payloads in memory. This method is especially prevalently used by China-based threat actors to execute payloads such as PlugX or ShadowPad.
Popular Tools for Manual Memory Forensics
There are a number of existing tools for memory forensics, many of which are open-source. Let’s talk about a few of the options for manual analysis now. (We’ll look at one more tool for automating memory analysis at the end of the blog.)
Volatility Framework
One of the most popular frameworks for memory forensics is the Volatility Framework, which contains a collection of tools that can extract digital artifacts from memory samples. It supports a variety of file formats and has a plethora of community plugins that extend its capabilities. Intezer also has a plugin for Volatility, which helps you efficiently analyze memory dumps.
YARA
YARA is mostly known for its ability in signature-based malware detection, and is also invaluable in memory forensics. With YARA, forensics investigators are able to to easily identify and characterize malware residing solely in RAM. YARA’s flexibility and ease of use make it a very popular tool for rapid and accurate identification of malicious artifacts within volatile memory dumps.
WinPmem
Originally part of the Rekall Framework, WinPmem is a memory acquisition tool to dump the volatile memory of a machine. With WinPmem, analysts can extract a snapshot of the system’s memory state, including running processes, network connections, and loaded kernel modules, facilitating in-depth forensic analysis and incident response.
Memoryze
Memoryze is a free tool provided by Mandiant for data collection and analysis. It is able to acquire memory images; it has analysis features built in that are similar to some of the plugins provided by Volatility.
GRR
GRR is a tool maintained by Google that is an incident response framework focused on remote live forensics. It works by installing an agent on target systems that an admin is able to use to query the live system. GRR used the physical memory analysis functionality that came from the Rekall Forensics Framework, as well as using YARA for detection.
Traditional Memory Forensic Tools in Action
If you’re looking to understand the basics and explore memory forensics, then starting with a free and open-source tool that is popular in the industry, like the Volatility Framework, is a great place to start. Let’s take an example using this classic forensic tool.
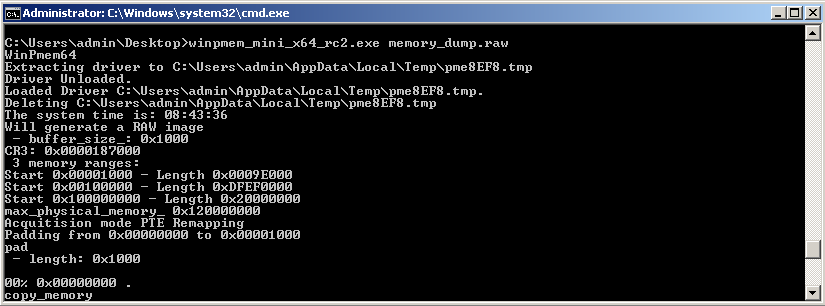
First, we need to dump the volatile memory of our machine. For the purpose of this, we will use WinPmem, to dump a raw image.
With this raw image we can now analyze using the Volatility Framework. First, we can look at what running processes there were when the image was taken by running the pslist command.
python3 vol.py -f <your_memory_dump.raw> windows.pslist | less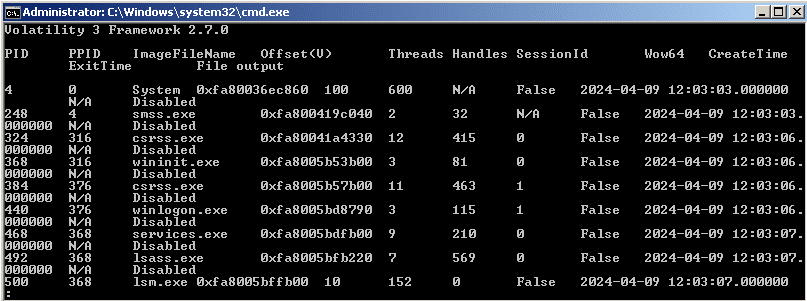
This is useful as it provides a comprehensive list of all processes running in memory, including their process IDs (PIDs), parent process IDs (PPIDs), and other relevant information such as process names and command line arguments.
Maybe there is nothing that immediately sticks out to you. With Volatility, you can also check all the network connections that were established at the time that the image was taken. It might be easier to read if you pipe out the results to a text file, rather than trying to scroll through a terminal.
python3 vol.py -f <your_memory_dump.raw> windows.netscan > netscan.txtMaybe that connection to 10.0.0.13 is suspicious?

Another very helpful plugin for Volatility is the “malfind” plugin. Malfind helps find hidden or injected code/DLLs in user mode memory, based on characteristics such as VAD tag and page permissions. The malfind plugin looks for specific anomalies or indicators that suggest the presence of injected code. These indicators may include characteristics such as executable code in non-executable memory regions, suspicious memory permissions (e.g., executable memory in read-only regions), or unexpected changes in memory protection flags.
python3 vol.py -f <your_memory_dump.raw> windows.malfind.Malfind > malfind.txtMalfind brings up quite a lot of results, as even many legitimate programs can have suspicious indicators, such as Microsoft Edge, but one result really sticks out to us, the very stealthily named “my_payload.exe”.

One thing that may be obvious to some experienced malware researchers or forensics investigators is this snippet of shellcode. The very obvious stub looks like the Reflective Loader Stub for Cobalt Strike. Here is it annotated below:
pop r10 ; MZ Header push r10 ; undo action above
push rbp ; save the stack base pointer
mov rbp, rsp ; create a new stack frame
sub rsp, 0x20 ; create shadow space (x64 __fastcall)
lea rbx, [rip – 0x16] ; obtain shellcode base address
mov rdi, rbx ; save shellcode base address
add rbx, 0x16EA4 ; add file offset of ReflectiveLoader to shellcode base
call rbx ; call ReflectiveLoader (returns DllMain address)
mov r8d, 0X56A2B5F0 ; EXITFUNC value
push 4 ; push 4 to stack
pop rdx ; pop the value into rdx (second argument of call)
mov rcx, rdi ; move shellcode base address to rcx (first argument of call)
call rax ; call DllMain
There may be a way to double confirm whether this is indeed a Cobalt Strike infection. In this case we are going to use YARA. You have the option of using YARA stand alone by itself, but there are also plugins in Volatility to run YARA also. In this case we will use VadYaraScan. The ruleset that we will provide it with is going to be the really great YARA rule set created by Avast Security.
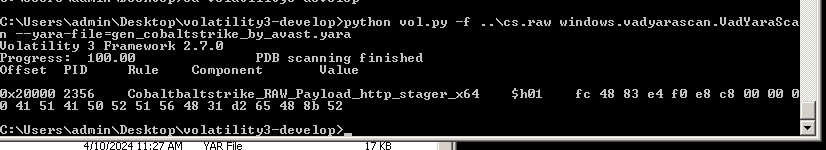
Nice! We see that we have detected a CobaltStrike HTTP stager in memory! If you wish to investigate it further, we recommend that you use the dumpfiles module to isolate the memory of the target process. Another helpful tool is a Beacon parser provided by SentinelOne.
Many investigators are familiar with forensic tools like Volatility, which are valuable for learning about memory analysis or security research. But they also bring along challenges as discussed, like a steep learning curve and time-intensive process required for manually analyzing memory.
Automating Memory Forensics, At Scale
In a real-life Security Operations Center (SOC), a team could receive thousands of daily alerts and need to respond promptly. Ideally, every alert potentially indicating an in-memory threat would be investigated. However, due to the high volume of alerts and the complexity and time required for memory forensics, this is not always feasible. Tools like Volatility simplify the analysis, but they do not address all challenges related to manual memory acquisition and analysis.
One solution can be automating memory acquisition and forensic processes upon receiving certain alerts. For instance, imagine if SOC teams could automatically initiate a memory forensics process whenever an alert about “suspicious behavior detected” is received. The acquisition and analysis of memory would occur automatically, and the analyst would receive a final report with the findings, based on which they can decide if the alert should be escalated. Based on this report, they could decide whether the alert should be escalated. This automated approach would help SOC teams overcome both technical and logistical challenges.
At Intezer, this automated approach is how we perform memory forensics for customers using our Endpoint Scanner. This memory forensics process can be initiated automatically based on the original alert, or manually to provide flexibility based on the user’s needs. The Endpoint Scanner efficiently handles the acquisition and analysis of memory, culminating in a detailed report for further action.
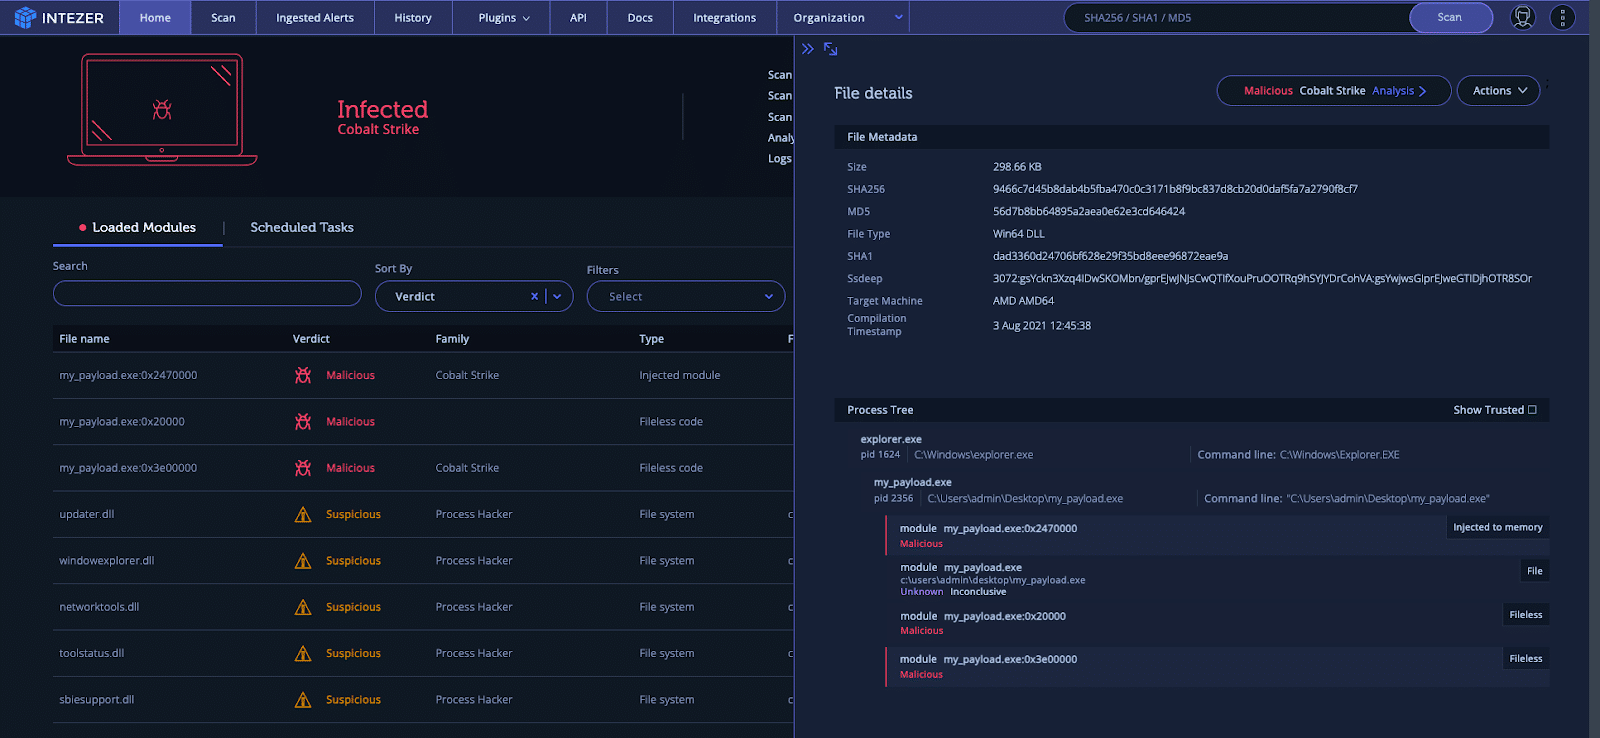
Let’s look at an example of a memory threat using the Endpoint Scanner manually first: simply double-click on the Scanner executable, enter your API key, and watch the magic happen! After a few short seconds, the endpoint scanner will scan the running processes, look for injected memory modules and dump any suspicious code. The whole process takes anywhere from 15 seconds up to one minute.

Looking at the scan result, we very clearly see that we have identified Cobalt Strike injected into memory (and which offsets that the payload lies) and under which process. The UI is designed to be very easy to identify suspicious processes. You never know what you might find in memory!
The endpoint scanner will also provide IOCs and check points of persistence, allowing you to understand how the payload might be maintaining its presence on the victim machine.
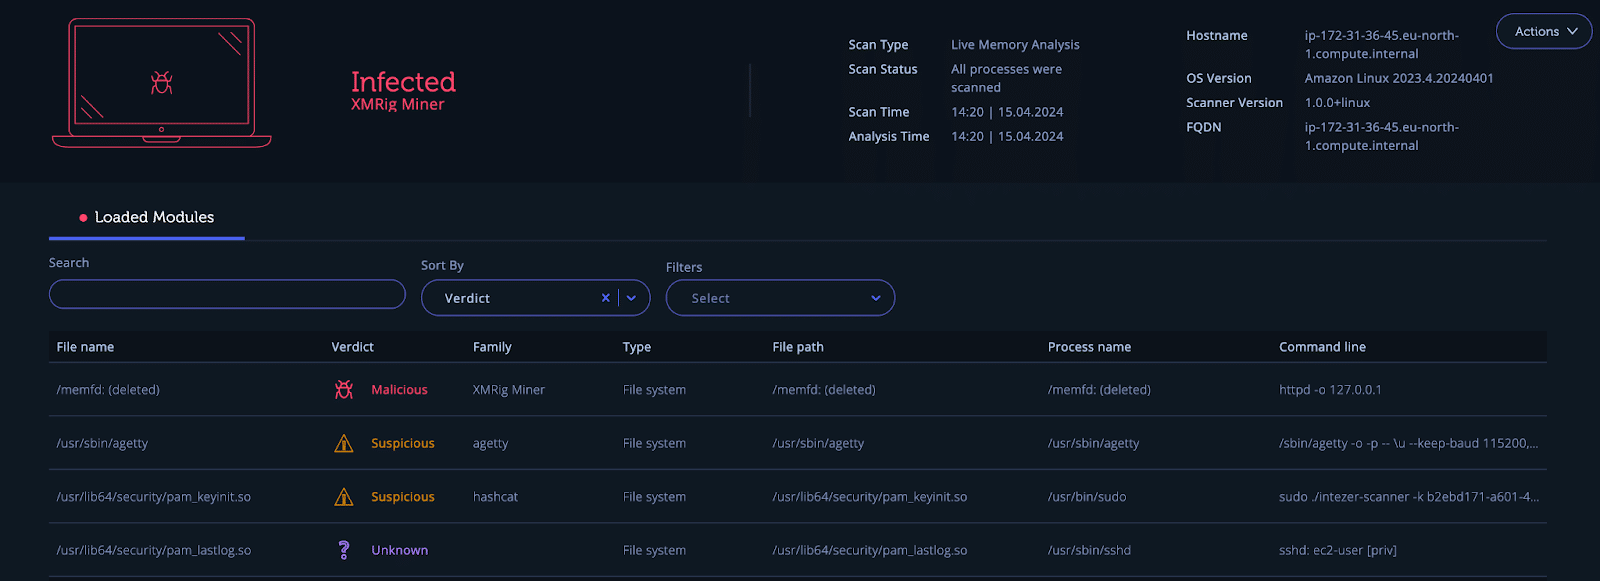
The endpoint scanner also works for Linux. It works similarly to what we have seen in Windows: download the scanner and run it with your API key:
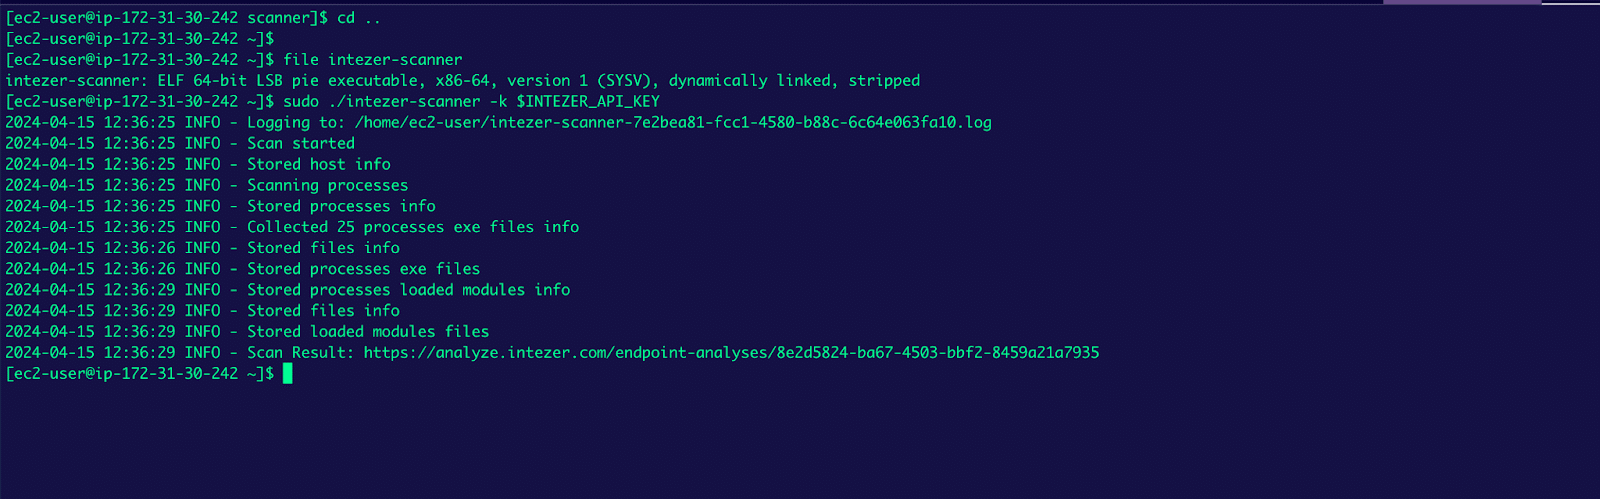
And we can see the result of the scan as can be seen in the screenshot below:
Best Practices for Memory Forensics Automation
Our scanner is designed with automation at its core. Because of the demands of incident response and proactive hunting workflows, analysts often lack the time to execute endpoint scans manually. Since many security teams leverage Endpoint Detection and Response (EDR) or Mobile Device Management (MDM) products to monitor and manage their endpoints, we can
With this, we built an easy way to automate the endpoint analysis process. Intezer provides stand-alone executables integrates with MDM solutions, providing the API key either as a command line parameter or as an environment variable.
Endpoint protection and XDR products, such as SentinelOne and CrowdStrike, have automation capabilities that enable Intezer’s endpoint scanner to integrate easily. Detailed instructions for integrating with CrowdStrike, SentinelOne, and Microsoft Defender for Endpoints can be found here.
For added convenience, Intezer provides scripts for both Windows and Linux platforms, which can be easily uploaded as automation within EDR products, For example, SentinelOne:

Conclusion
Memory forensics is very important in the ongoing battle against cyber threats. This area helps us find harmful activities that normal checks might miss, especially the sneaky attacks that don’t leave files behind. While manual memory forensics is tricky because it deals with complex data and fast-changing malware, now the cybersecurity community has more advanced, new solutions like Intezer’s endpoint memory scanner for Windows and Linux which make memory forensics more accessible for every analyst and incident investigation.
Try Intezer for free or book a demo to learn more.
The post Memory Analysis 101: Understanding Memory Threats and Forensic Tools appeared first on Intezer.
Article Link: Memory Analysis 101: Memory Threats and Forensic Tools