Introduction to Memory Forensics with Volatility 3
At a digital crime scene, data stored on the hard disk is as critical as the data stored in the system’s memory (RAM). Memory forensics deals with the analysis of data stored in a working computer’s RAM. This RAM analysis aids in responding to security incidents, understanding potential internal threats, and decrypting the operations of malicious software.
Importance and Applications of Memory Forensics
Memory forensics holds critical importance in the fields of cybersecurity and digital forensics. Where traditional file and network analyses fall short, memory forensics offers much more detailed and dynamic analyses. From the detection of malicious software to rapid and effective incident response, from accessing confidential and sensitive information to collecting reliable evidence for legal proceedings, it has significant advantages in various areas. Especially during or after security breaches, it is an indispensable tool for quickly and accurately analyzing events that occurred on the system.
Memory Structure and Memory Management
A computer’s memory (RAM) serves as temporary storage that the processor can immediately access and operate upon. Memory consists of two main parts: physical and virtual. Physical memory refers to actual physical memory cells. This memory is represented by physical addresses located in the computer’s RAM or other physical memory devices. Virtual memory is an abstract concept provided by the operating system. Operating systems provide each process with its own private virtual address space. During execution, the memory manager and the Memory Management Unit (MMU) work together to translate virtual addresses into physical addresses. If a thread accesses a virtual address, that data is retrieved back into physical memory.
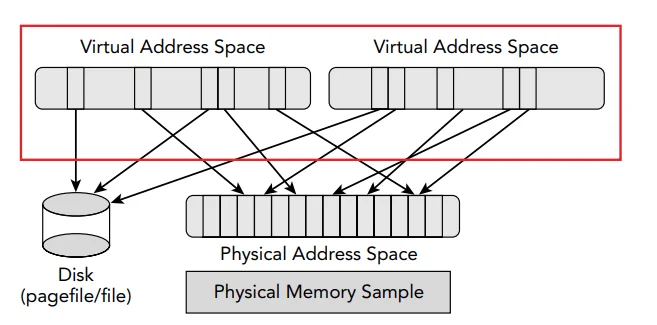
Figure 1: Illustration of multiple virtual address spaces sharing memory
Memory Dump Capture
Different tools and methods are available for capturing memory dumps across different operating systems and scenarios. If the system to be examined is running within a virtual machine, you can use the snapshot feature of the virtual machine management tools to record the current state of the system. The snapshot file is then copied to the system, where analysis will be conducted. For Windows operating systems, various free tools are available to capture RAM images; one of the most popular ones is DumpIt, another is FTK Imager. Both tools successfully enable you to save the system memory as an image, so you can perform various analyses on this image later. For Linux operating systems, the ‘dd’ command or the ‘lime’ application is generally preferred for capturing memory dumps. Although the ‘dd’ command is a simple terminal command, it is powerful and can directly copy the memory to a disk file. ‘Lime’ is a tool specifically designed for the Linux Kernel that allows for the creation of more complex and detailed images.
Volatility 3
Volatility 3 is an open-source memory analysis framework. This tool is used to examine the system, processes, and other dynamic activities from either a running operating system or memory dumps. Volatility 3 came as a continuation of Volatility 2 and brought many important innovations and improvements. This version has a more flexible and performance-oriented architecture.
To use Volatility 3, you must have Python 3.7 or a higher version installed on your computer. You can install Volatility 3 from GitHub. It operates based on the command line. You can navigate to the directory where Volatility 3 is installed and run ‘vol.py’. By using the -h parameter, you can view available parameters and plugins. In the command line below, the -f parameter is used to specify the RAM image, and then the plugin is run.
C:Volatility3vol.py -f path_to_memory_dump.raw plugin_name
Analyzing Process Activity
One of the strongest features of Volatility is its ability to detect hidden or deleted processes. Basic operating system tools and other security applications usually provide access to runtime data, which can be easily manipulated by malicious software. However, Volatility is a tool capable of directly analyzing data in RAM, enabling it to detect such manipulations. This sets it apart from other basic tools and applications. Therefore, Volatility’s most critical feature is its plugins that analyze process activity. These plugins and their functions:
pslist: Tracks the operating system’s process list. Lists all processes known by the operating system.
pstree: Takes the output from pslist and organizes it in a tree-like format to clearly display parent-child relationships among processes.
psscan: Directly scans physical or virtual process blocks in memory. Has the ability to find terminated or disconnected (hidden) processes as well. This allows for a more comprehensive process list to be obtained.
Let’s examine the Volalitity 3 tool through a sample memory dump I created. First, I run the pslist plugin.
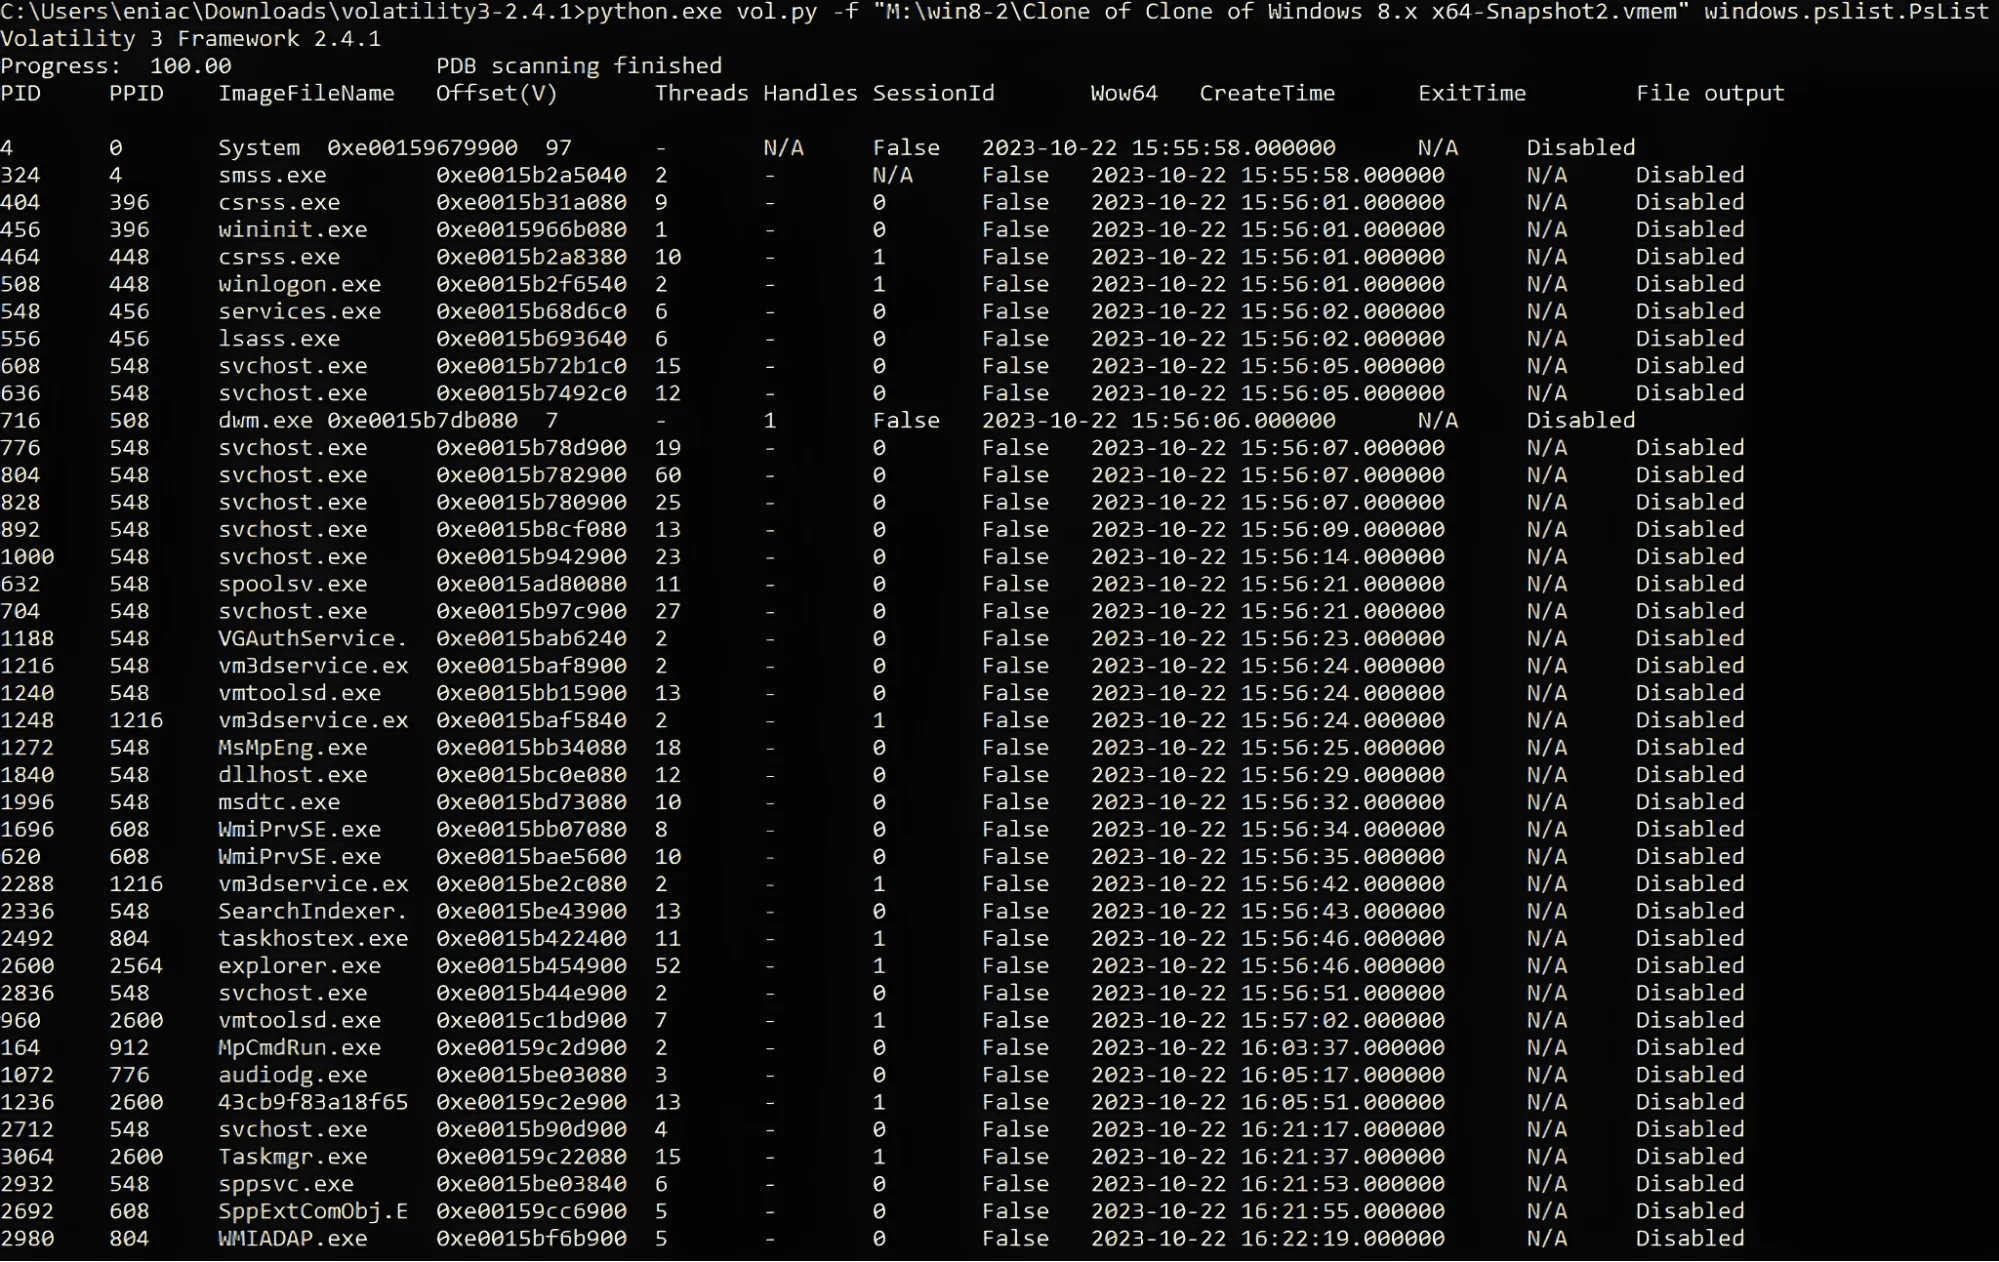
Pslist output
In the output from Volatility’s pslist command, you can see a list of processes running on a Windows system, captured from a memory dump. Each row shows details about a single process, such as its Process ID (PID), Parent Process ID (PPID), the name of the executable (ImageFileName), and the virtual memory offset, the number of threads, handles, Session ID, and other information such as its creation time.
When you’re analyzing this output for potentially malicious or suspicious activity, there are a few things to keep in mind:
Unusual Process Names: Processes with names that don’t match standard Windows executables or installed software could be malicious.
Parent-Child Relationships: Normal parent-child process relationships (like explorer.exe spawning cmd[.]exe) are typically fine, but you might be suspicious of abnormal relationships, like svchost[.]exe spawning a non-system process.
Duplicate Processes: Multiple instances of processes that are typically run only once (like lsass[.]exe) can be a sign of something malicious.
High Thread Count: A high number of threads for a given process could indicate it is performing a lot of actions, which could be suspicious depending on what the process is.
Non-Standard File Paths: Processes running from temporary or cache folders could be indicative of malicious software.
In the given output, the process 43cb9f83a18f65 stands out. The ImageFileName appears to be an unusual string and is not a recognizable executable file name. This makes the process a candidate for further investigation.
Comparing Pslist and Psscan
Using these two tools together allows for obtaining a more comprehensive and detailed process list, including hidden or terminated processes. After running pslist and then the psscan command, align the two lists side by side and identify the processes that do not match. Further in-depth analysis is conducted on the mismatched processes to investigate whether they are malicious or not. In the sample memory dump, a comparison between pslist and psscan revealed no hidden processes. Screenshot 2 shows the compared Psscan list.
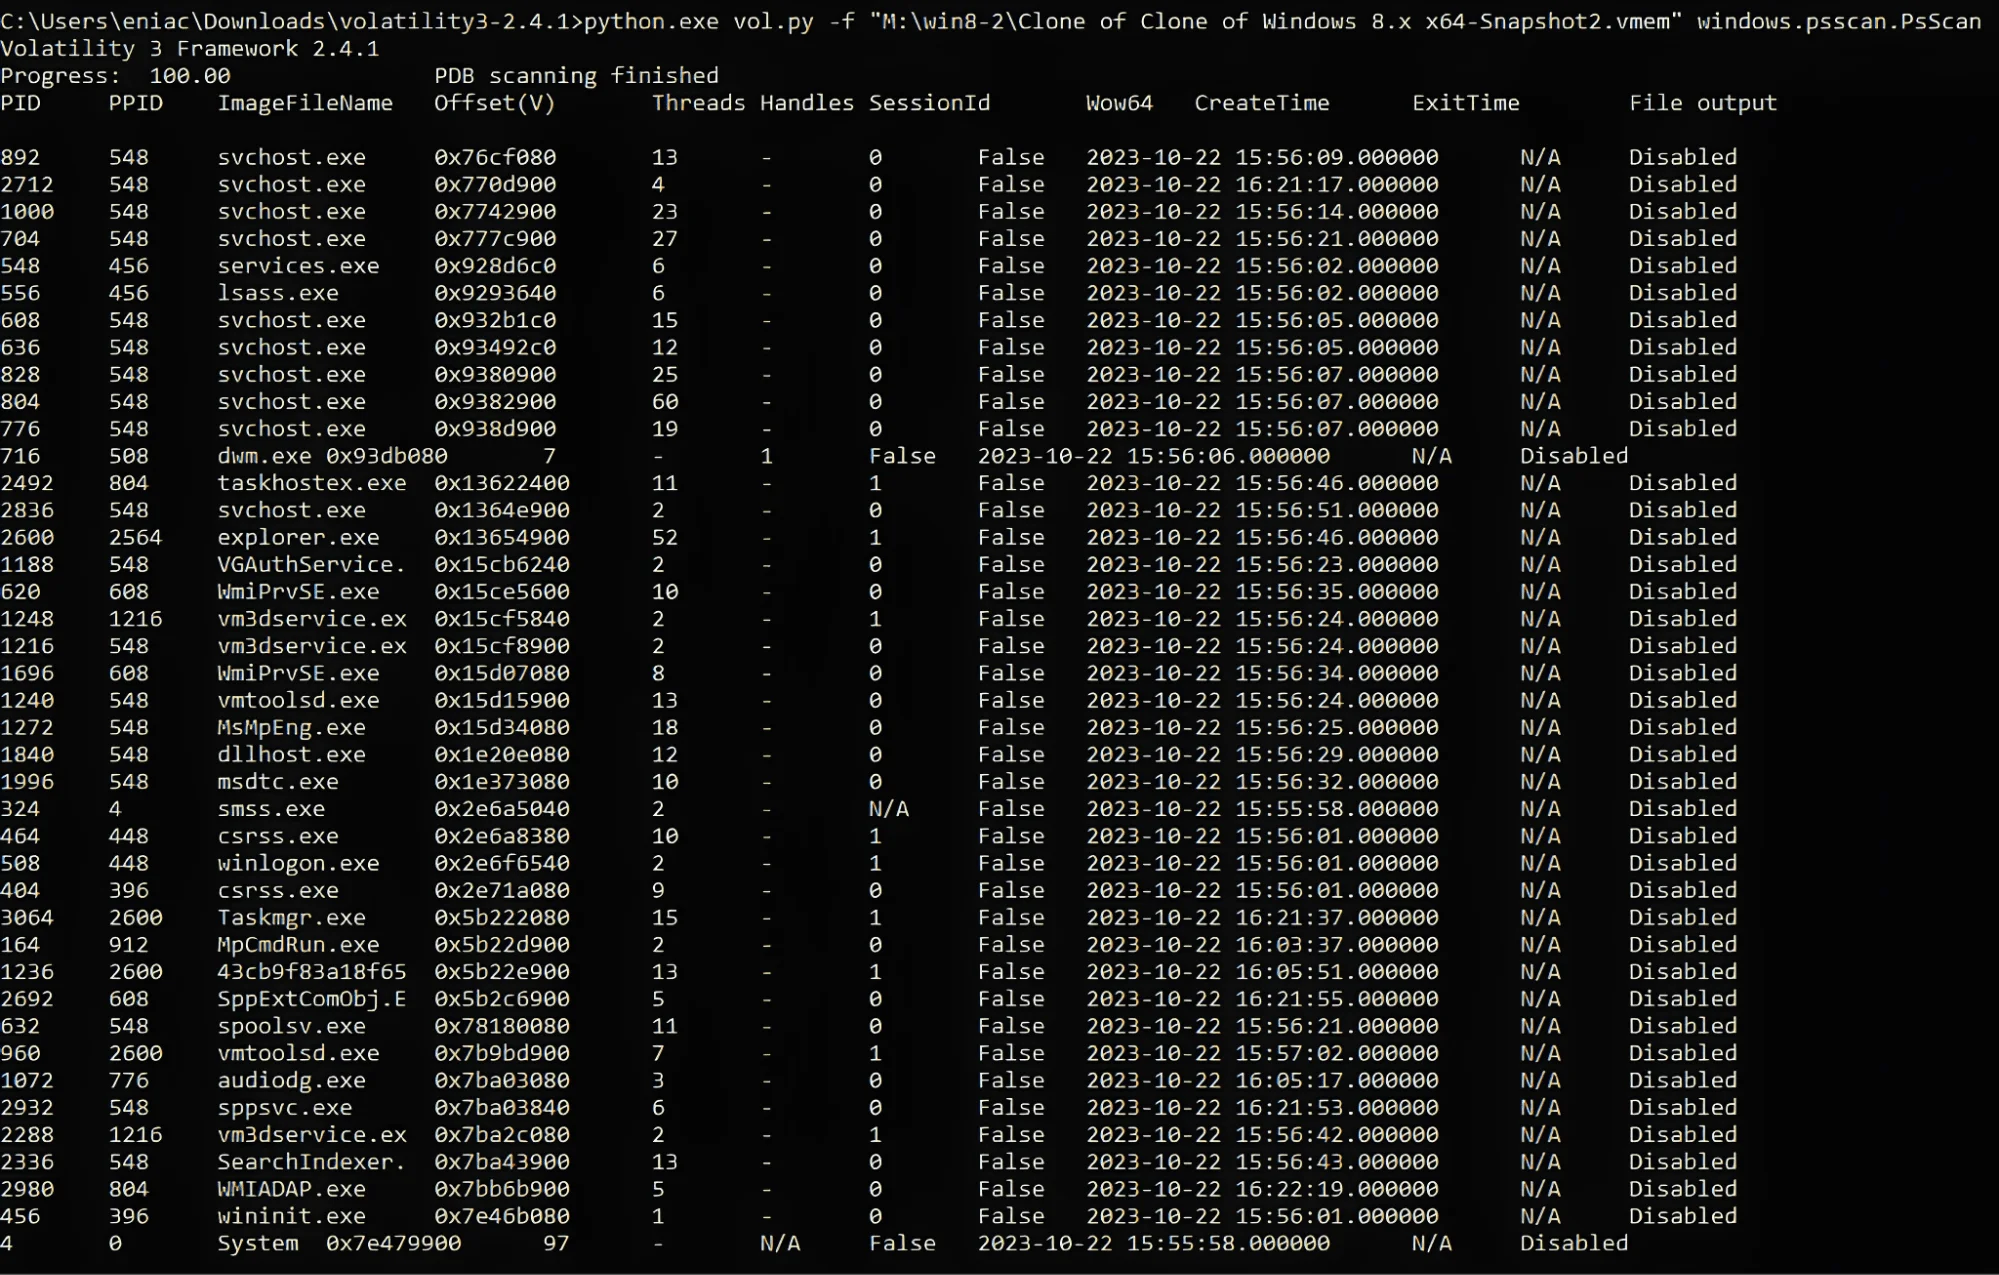
Psscan output
Examination of suspicious process
We are using Volatility 3’s malfind plugin to gather more information about the suspicious process. The malfind plugin is used to detect potential malicious activities and code injections in the system memory dump.
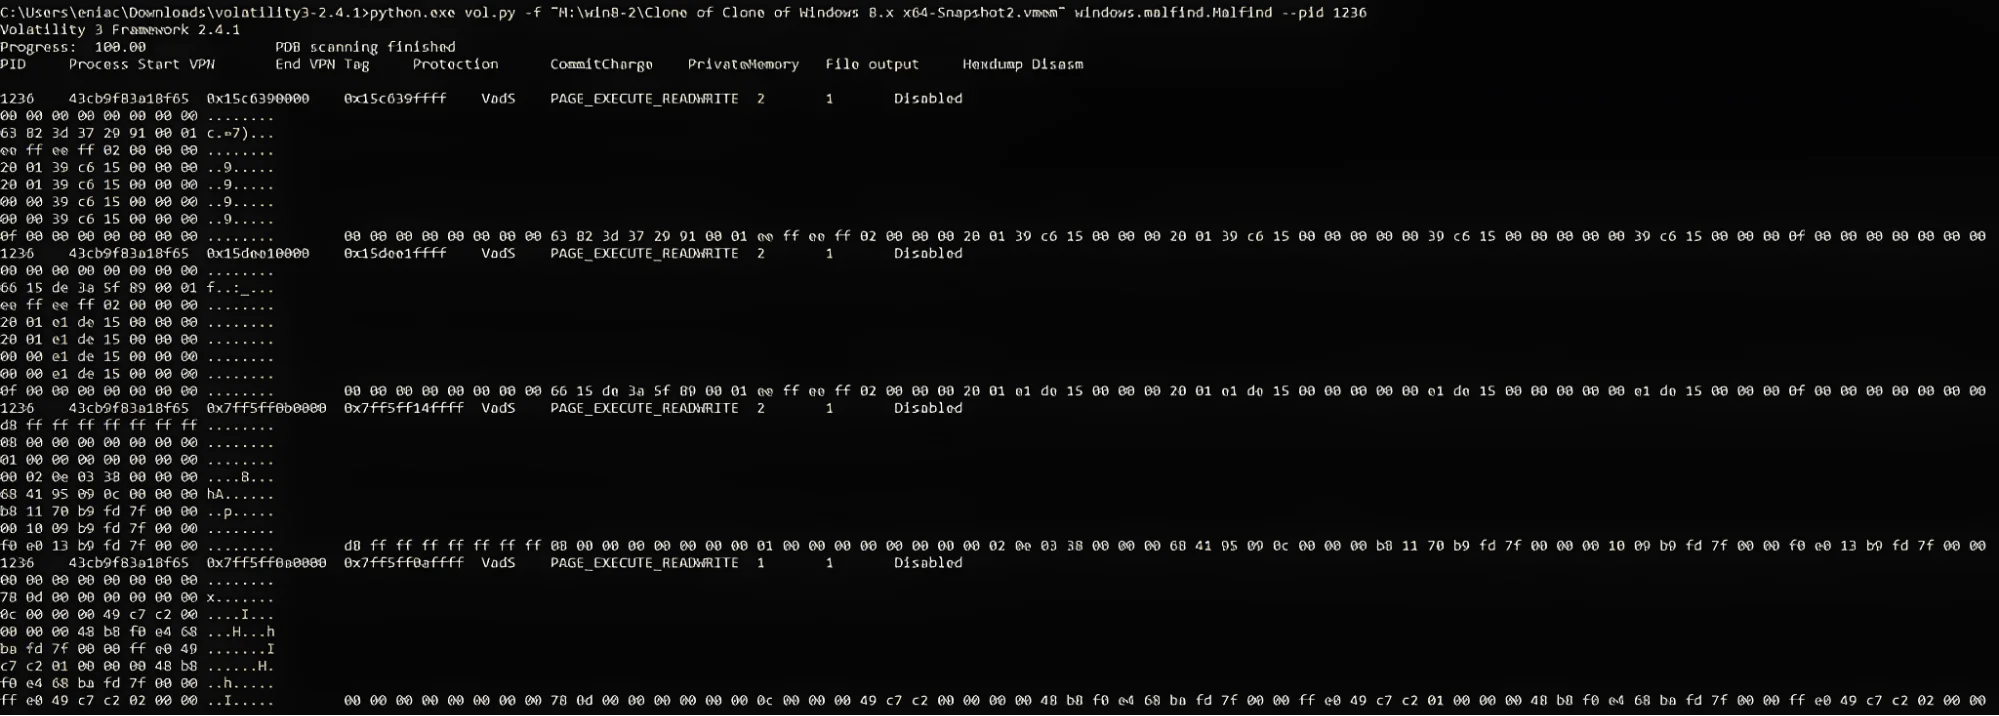
Malfind plugin output
The malfind output shows Virtual Address Descriptors (VAD) with the PAGE_EXECUTE_READWRITE permissions, which are unusual for normal processes. This serves as an indicator of code injection or other malicious activities for the 43cb9f83a18f65 process.
The process 43cb9f83a18f65 was dumped using Volatility’s dump plugin and its file hash was obtained.

Process 43cb9f83a18f65 was dumped
To determine whether this process is malicious, the file hash was searched in SOC Radar’s free tool, IOC Radar.
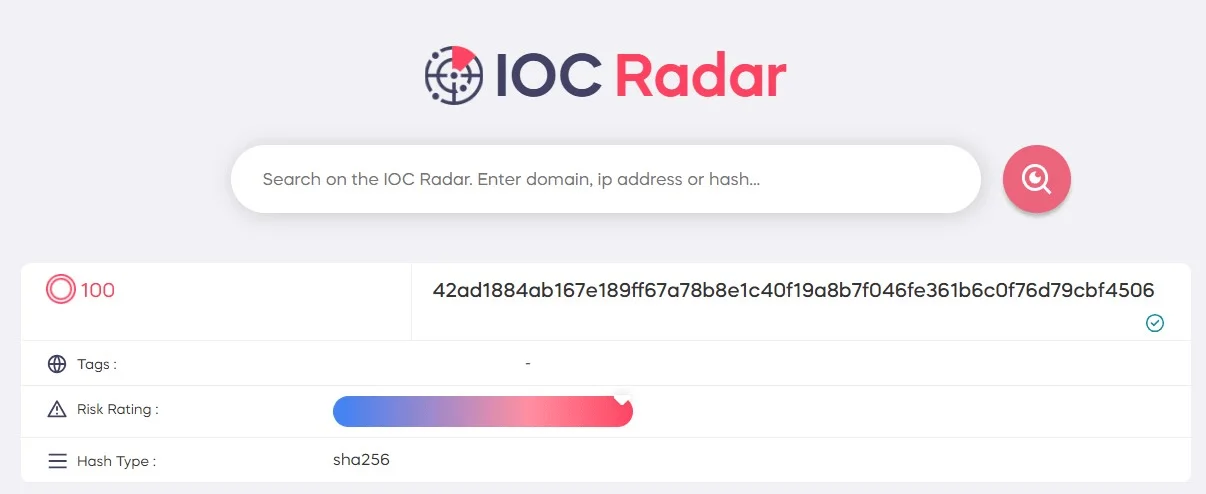
Searching 43cb9f83a18f65 process hash on IOC Radar
The IOC radar gave us a risk score of 100/100 for the file hash, indicating that the process is malicious. Through SOC Radar’s free IOC Radar tool, you can examine the domain, IP, and file hashes obtained from your RAM dump.
Other Volatility Plugins and Features
Sessions: Lists Processes with Session information extracted from Environmental Variables
DLLList: Can list DLLs loaded by running processes.
Handles: Provides information about open file handles, registry handles, and other resource handles.
MBRScan: Scans for and parses potential Master Boot Records (MBRs)
Registry Plugins: Used for analyzing the system registry, similar to tools like RegRipper.
File Extraction: Plugins like dumpfiles allow you to extract files from the memory dump.
Strings: Reads output from the strings command and indicates which process(es)
In this write-up, Volatility 3 stands out as one of the most powerful tools in the field of memory forensics. With the aid of Volatility 3, it becomes possible to access data and traces that conventional analysis methods cannot reach.

Article Link: https://socradar.io/introduction-to-memory-forensics-with-volatility-3/