Written by Moitreyee Dasgupta, Leihua Ye
 Photo Credit: Julien BLOT
Introduction
As a Fortune 1 company, at Walmart we continuously strive to provide an amazing customer experience with everyday low prices. We do this by constantly testing new features, machine learning models, and ideas on our website and app. Through these tests, Walmart is able to make data-informed decisions to build next generation retail. The company uses a centralized experimentation service across the organization. It runs on a fully automated data pipeline and a single centralized UI to create and manage experiments and display analytical reports.
As one of the biggest stakeholders in the retail industry, Walmart is quickly expanding its online presence both within the US and globally. The company is always trying to improve their system to better serve their growing customer base. To achieve this goal, product teams need to continuously test new business ideas and launch new features.
Running online controlled experiments (OCEs, a.k.a. A/B Testing) has become the industry standard of product innovation in the technology sector. All major companies adopt active testing strategies and leverage data to guide their decision-making process under uncertainty. Walmart is no different. We support hundreds of concurrent experiments across multiple tenants (website, Android, and iOS) and have run thousands of experiments every year.
However, running experiments on such a large scale is not an easy task. The sample size (n) is big by nature, and it is resource-intensive to process, store, and compute the big data; integrating with various internal infrastructures and systems requires inter-team collaboration; the target metrics tend to have huge variations, which makes it challenging to detect the delta. It takes an army of software/data engineers, product/test managers, product analysts, and data scientists to meet the testing needs across the organization. In today’s post, we explain how Walmart leverages a Variance Reduction (VR) method and speeds up the production development cycle.
Large Variance in OCEs
In OCEs, experimenters take a small sample from the entire customer base and try to infer the population parameters (e.g., mean) as described in Figure 1:
 Fig. 1: Sampling Process of OCEs
The sampling process resembles the traditional Randomized Controlled Trial (RCT) designs that are widely used in the medical field. However, OCEs have a few unique attributes. First, the traditional RCTs typically have a limited and small n, unlike their online cousins. Once the infrastructure is in place, the complexity of adding hundreds, thousands, or even millions of users to an experiment is negligible. Naturally, OCEs are big data settings. To put it into perspective, biostatisticians would jokingly call a 100-n big data.
Second, unlike the traditional RCTs with minimal variations, OCEs often come with heterogeneous users with divergent purchasing patterns and result in large variations. In the medical field, scientists intentionally recruit similar or even identical research subjects, which is not feasible in the online world. We are living in a chaotic world with many factors out of our direct control. For companies that provide online services and products (e.g., Walmart) , there are many moving factors like holiday sale spikes, seasonal fluctuation, special occasions, celebrities sharing a picture of the product on social media, etc. With so many sources of potential influences, it becomes intrinsically difficult to decide if the difference between the control and treatment groups are useful signals or just random noise. In addition, OCEs are cursed with small metric lifts. The unique combination of small treatment lifts with large variance often requires millions of samples, according to the power analysis formula (Van Belle, 2011).
To ensure well-powered tests, there are several possible ways to go. The linear remedy is to run the tests longer and recruit more users. However, the sensitivity is inversely proportional to the n squared: if the delta changes by 10 times, the corresponding n needs to be changed 100 times (Deng et al., 2013). Besides, running experiments longer has diminishing marginal returns as there are finite customers (Xu et al., 2018).
A more cost-efficient solution is to leverage Controlled-experiment Using Pre-Experiment Data (CUPED), which was developed by a group of talented Data Scientists at Microsoft (Deng et al., 2013). Up until today, 100+ companies have utilized the method, and it is one of the most popular statistical methods in the A/B testing sphere.
What is CUPED?
CUPED is an unbiased estimator that leverages a covariate to reduce the target metric variance (Deng et al., 2013). At a high level, CUPED can be summarized into two steps. First, we find the most relevant covariate to the target metric and construct a coefficient theta (θ) at the group level (i.e., control or treatment). Here is the construction formula: θ = cov(Y, X)/var(X)
Where:
- Y: the target metric for a user
- X: the relevant covariate for the same user
- cov(Y, X): the covariance between the target metric and the covariate at the group level
- var(X): the variance of the covariate at the group level
Second, we apply the θs to transform the target metric and run statistical tests on the transformed data. We will describe the detailed implementations in the remainder of the post.
Design Principles
As part of Walmart’s experimentation team, we strongly believe in the power of practical science and more in the organic integration of science and business, which is why we spend so much time and energy to properly integrate the method into our pipeline. In this section, we introduce three Design Principles that guide us through the integration process of CUPED.
Design Principle 1: The integration should be straightforward and avoid black boxes at all costs.
Within Experimentation Setup Platform, the main analytical pipeline pulls data from multiple upstream sources and processes customer telemetry and transaction data in a daily batch fashion. The ETL pipeline has multiple components:
- Sessionization component: runs on a daily cadence to collect session-level telemetry data.
- Accumulation component: aggregates all session-level data at the user level.
- Summary component: apply statistical procedures for different types of metrics.
Design Principle 2: The integration should be tailored to Walmart’s context to the largest extent.
As explained in the original paper [1] , the success of CUPED relies heavily on the correlational strength between the target metric and the covariate: the higher the correlation, the higher the Variance Reduction (VR) effect. In general, Walmart customers keep coming back to the website and placing orders. Large number of returning customers gives us significant historic data for each customer. After some validation work, we pick the past data as the covariate. Next, we run simulations and use real historic experiments to decide the most appropriate past duration. In the development stage, we chose a key business metric (details undisclosed) and compared the following past durations: 1, 2, 4, 6, 8, and 16 weeks. As it turns out, the effectiveness of VR plateaus after 4 weeks, with marginal lifts extending through the 16 weeks. So, we made a strategic decision and picked 4-weeks as the optimal past duration.
Design Principle 3: The integration should serve the business goals.
At Walmart, we have the luxury of a self-served A/B testing platform that does the heavy lifting behind the scenes so that product teams can focus on new business ideation and hypothesis generation. The last thing we want our customers to worry about is data interpretation, big data jobs, data pipeline etc. and feel confused about the test readout. In the development stage, we learned that product teams rely heavily on group means for making feature launch decisions. To avoid any confusion in the result tab, we decided to implement the de-meaned version of CUPED that allows us to keep the original group mean value unchanged after the transformation (Jackson, 2018) [2].
How to Integrate the CUPED Method into the Pipeline
Given Walmart’s large scale, the analytical pipeline must be capable of processing the petabyte data size and generating analytical reports efficiently. Below is the overall depiction of the pipeline before the CUPED implementation (Fig. 2). At a high level, all user activity (i.e., telemetry data) in different platforms (browser, mobile, etc.) has been captured, flows through complex ETL pipelines, and lands into storage buckets. Then, the analytical pipeline reads that telemetry data from the bucket and enriches it with the experiment metadata, adding more dimensional information to it. The pipeline then further processes, aggregates, and transforms the dataset that can generate statistical reports for A/B tests. The results are displayed in the Experimentation Setup UI.
 Fig. 2: Experimentation Analytics Pipeline
We have divided the CUPED process into three main phases (Fig. 3) –
- Pull and aggregate the pre_metric data by processing the last 28 days before the experiment start date.
- Compute the thetas.
- Calculate cuped-adjusted-metric.
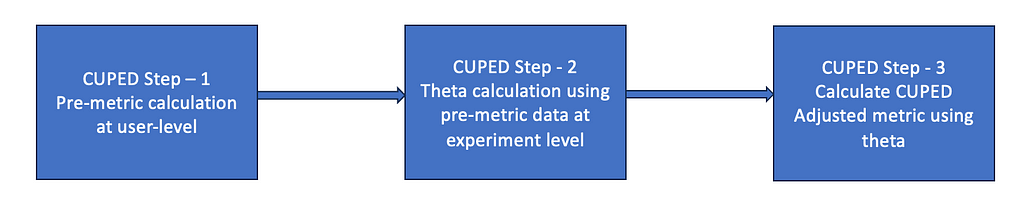 Fig. 3: CUPED processing in 3 steps
Step 1 — pre-metric calculations
At the user level, pre_metric = aggregate (metric in the past 28 days prior to the start date). The aggregation function could be either sum or count, based on the metric type. In our use case, we decided to aggregate the prior data. Repeat the same process for all the experiments currently running across the platforms.
Step 2 — theta calculations
Theta calculation needs to happen at the group level. For the control (treatment) group, we calculate the following statistical values: sum, mean, and variance for both the target metric and pre-metric, the covariance between the metric and the pre_metric, and the theta between the covariance and the variance. Below is an example of the theta calculations.
var(Y)  = SUM(POWER(Y - mean(Y), 2)) / n
cov(Y, X) = SUM((Y - mean(Y)) * (X - mean(X))) / (n - 1)
θ = cov(Y, X)/var(Y),

where, Y = pre_metric , x = metric, n = total_user
Step 3 — cuped_adjusted_metric calculations
In Step 3, we transform the raw data using the theta obtained from the above step. There are many first-time buyers with no prior history of purchasing information with the website. For these new visitors, we retain the raw data and do not make any changes while transforming the raw data. In the CUPED Implementation section below, we have discussed in detail how we solved each of these steps.
For each user, if Y > 0 Then
cuped_adjusted_metric =  X - (Y - mean(Y)) * θ
Else
cuped_adjusted_metric = X

where, Y = pre_metric , x = metric
The diagram below describes how we have integrated the above processing flow with the existing pipeline. The beauty of the proposed model is its integration does not increase the pipeline SLA, though it is processing-heavy. The pre_metric calculation is the most processing-heavy part of the CUPED implementation. It needs to pull the past 28 days of session-level user telemetry data and map it to a set of concurrent experiments. This is because each user can be a part of multiple concurrent experiments in an overlapping design. It then further processes and aggregates the metric data from session level to user level for all the currently running experiments. Since each of these processes takes significant time, it results in a T +1 latency. At Experimentation platform, we have decided to generate pre_metric using session data and leverage the existing pipeline to aggregate the pre_metric data to the user level. The rest of the CUPED steps (steps 2 and 3) are light in terms of processing costs since they are calculated at the experiment group level and can be done on top of user-level aggregation data. Finally, we leverage the existing pipeline to generate statistical values for the metrics and push data to Experimentation Setup UI.
 Fig. 4: CUPED Integration with the existing analytical pipeline
CUPED Implementation
Below is the step-by-step implementation process of CUPED method on simulated data. For the simulation process, we consider “revenue” as our target metric. We have simulated past 28 days of sum(“revenue”) as “pre_revenue”. Let us consider that subset of total users is part of control group, and they are marked as “C”. Others are part of the treatment group and marked as “T” in the dataset. For any experiment say “abc” below dataset shows the value of “revenue” and “pre-revenue” metric for each user identified with a unique value termed as “user_id”.
Step 1 — Calculate pre_revenue data.
import org.apache.spark.sql.SparkSession
import org.apache.spark.sql.functions._
import org.apache.spark.sql.types._
import org.apache.spark.sql.DataFrame

val df = spark.read.options(Map("inferSchema"->"true","delimiter"->",","header"->"true")).csv("your_path/sample_pre_revenue.csv")
df.show()

+---+-----+-------+-------+-----------+
|exp|group|user_id|revenue|pre_revenue|
+---+-----+-------+-------+-----------+
|abc|    C|      1|   9.45|     300.12|
|abc|    C|      2|  14.75|      90.27|
|abc|    C|      3|   2.52|      16.94|
|abc|    C|      4|   5.09|      56.84|
|abc|    C|      5|    0.0|     298.13|
|abc|    T|      6|   9.94|      61.82|
|abc|    T|      7|   3.97|      36.35|
|abc|    T|      8|   5.99|     682.09|
|abc|    T|      9|   8.49|     237.57|
|abc|    T|     10|   2.81|       70.0|
+---+-----+-------+-------+-----------+
Step 2 — Calculate aggregated functions like, sum, mean, standard deviation, variance and total number of users for revenue and pre_revenue metric.
// Calculate standatd sum, mean, std-deviation, variance
df.createOrReplaceTempView("input_table")


val sqlquery =
    s"""
    |select exp,
    |group,
    |SUM(revenue) AS total_revenue,
    |AVG(revenue) AS mean_revenue,
    |COUNT(revenue) AS total_user,
    |SUM(pre_revenue) AS total_pre_revenue,
    |AVG(pre_revenue) AS mean_pre_revenue,
    |VARIANCE(pre_revenue) AS variance_pre_revenue
    |FROM input_table
    |GROUP BY exp, group
    |"""stripMargin

val df_stat = spark.sql(sqlquery)

df_stat.show()

+---+-----+-------------+------------+----------+-----------------+------------------+--------------------+
|exp|group|total_revenue|mean_revenue|total_user|total_pre_revenue|  mean_pre_revenue|variance_pre_revenue|
+---+-----+-------------+------------+----------+-----------------+------------------+--------------------+
|abc|    T|         31.2|        6.24|         5|          1087.83|217.56599999999997|   73763.62152999999|
|abc|    C|        31.81|       6.362|         5|            762.3|152.45999999999998|  18599.918850000002|
+---+-----+-------------+------------+----------+-----------------+------------------+--------------------+
Step 3 — Calculate covariance of revenue and pre_revenue metric.
// Calculate co-variance

val covarDf = df.groupBy("exp","group").agg(covar_pop("revenue", "pre_revenue"))
val covar = covarDf.withColumnRenamed("covar_pop(revenue, pre_revenue)","covar")
covar.show()

+---+-----+------------------+
|exp|group|             covar|
+---+-----+------------------+
|abc|    T| 54.02589999999998|
|abc|    C|-70.02633999999996|
+---+-----+------------------+
Step 4 — Calculate Theta.
// Calculate theta

df_stat.createOrReplaceTempView("variance")
covar.createOrReplaceTempView("covariance")

val sqlQuery =
  s"""
     |SELECT
     |  v.exp,
     |  v.group,
     |  v.mean_pre_revenue,
     |  cov.covar / v.variance_pre_revenue AS theta
     |FROM
     |  variance v
     |JOIN covariance cov
     |ON v.exp = cov.exp
     |AND v.group = cov.group
     |""".stripMargin

val thetaDf = spark.sql(sqlQuery)
thetaDf.show()

+---+-----+------------------+--------------------+
|exp|group|  mean_pre_revenue|               theta|
+---+-----+------------------+--------------------+
|abc|    T|217.56599999999997| 7.32419299370048E-4|
|abc|    C|152.45999999999998|-0.00376487341502...|
+---+-----+------------------+--------------------+
Step 5 — Calculate cuped_adj_revenue.
//Calculate cuped_adjusted_revenue

thetaDf.createOrReplaceTempView("theta")

val sqlQuery =
  s"""
     |SELECT
     |  a.*,
     |  CASE
     |    WHEN a.pre_revenue > 0 THEN
     |       a.revenue - (a.revenue - c.mean_pre_revenue) * c.theta
     |    ELSE a.revenue
     |  END AS cuped_adj_revenue
     |FROM input_table a
     |left join theta c
     |ON
     |a.exp = c.exp AND
     |a.group = c.group
     |""".stripMargin

val cuped_adj_revenue = spark.sql(sqlQuery)
cuped_adj_revenue.show()

+---+-----+-------+-------+-----------+-------------------+
|exp|group|user_id|revenue|pre_revenue|  cuped_adj_revenue|
+---+-----+-------+-------+-----------+-------------------+
|abc|    C|      1|   9.45|     300.12|  8.911585452917178|
|abc|    C|      2|  14.75|      90.27| 14.231539282016815|
|abc|    C|      3|   2.52|      16.94|   1.95549488015105|
|abc|    C|      4|   5.09|      56.84|  4.535170604827666|
|abc|    C|      5|    0.0|     298.13|-0.5739926008548146|
|abc|    T|      6|   9.94|      61.82| 10.092069289451006|
|abc|    T|      7|   3.97|      36.35|  4.126441832668245|
|abc|    T|      8|   5.99|     682.09|  6.144962345683518|
|abc|    T|      9|   8.49|     237.57|  8.643131297435092|
|abc|    T|     10|   2.81|       70.0|  2.967291439055514|
+---+-----+-------+-------+-----------+-------------------+
Let’s look at Table 1 for the desired data frame for implementation.
 Table 1: The Data Frame of the De-Meaned CUPED (Not Real Data)
After the deployment, we observed sizeable VR effects across different tenants: CUPED reduces the variance ranging from 5% to 20% based on the tenants. Specifically, app tenants perform better than the web tenant, which may be explained by the stronger user stickiness . The varying tenant-wise performance is interesting in itself as it suggests our users have divergent purchasing patterns across tenants, which is worth further investigation. Stay tuned for another blog post on this topic. On the computation side, CUPED reduced processing time by over 10% due to the VR over a year. At Walmart, we are uplifted by the large VR performance and the testing time saved. If we can end the test 10% faster, it means 200+ million Walmart customers can experience the new feature 10% earlier. We have a validation script of the CUPED performance that runs quarterly, and the VR fluctuates within the same range.
Conclusion
At Walmart, we have learned a few valuable takeaways during the CUPED deployment and want to share them with the wider community. First, all new statistical methodologies should be fine-tuned to the specific business context. Companies have different customer bases and business models. It’s unlikely anyone can directly borrow from others’ so-called best practices without modification. Hypothetically, had we blindly used the default 2-week past duration, the VR effect would have been <1% instead of a much larger reduction. Second, we should use multiple validation steps to vet the results before the full deployment. At Walmart, data scientists calculated the required statistics values in a Jupyter Notebook, and data engineers ran through the pipeline to obtain these values. We cross-checked the results and made sure the results matched before the full deployment. Data scientists and data engineers collaborate to go through the rigorous testing and validation process to achieve a smooth transition from dev to production environments. Third, think really hard about how to better serve the business goals. With the business goals in mind, we work backwards and pick the technical paths.
Acknowledgement
A big thank you to all our partners/colleagues who have contributed in a way or another. Thanks to Girish Subramanian for all the encouragement to put this blog out, greatly appreciate your time to review and feedback. Thank you Mark Walters for reviewing this article, really appreciate your valuable feedback.
Further References
[1] Deng, A., Xu, Y., Kohavi, R. and Walker, T., 2013, February. Improving the sensitivity of online controlled experiments by utilizing pre-experiment data. In Proceedings of the sixth ACM international conference on Web search and data mining (pp. 123–132).
[2] Jackson, 2018, How Booking.com increases the power of online experiments with CUPED, https://booking.ai/how-booking-com-increases-the-power-of-online-experiments-with-cuped-995d186fff1d
[3] Xu, Y., Duan, W. and Huang, S., 2018, July. SQR: Balancing speed, quality and risk in online experiments. In Proceedings of the 24th ACM SIGKDD International Conference on Knowledge Discovery & Data Mining (pp. 895–904). Van Belle, G., 2011. Statistical rules of thumb (Vol. 699). John Wiley & Sons.
How Walmart Leverages CUPED and Reduces Experimentation Lifecycle was originally published in Walmart Global Tech Blog on Medium, where people are continuing the conversation by highlighting and responding to this story.
Article Link: How Walmart Leverages CUPED and Reduces Experimentation Lifecycle | by Moitreyee Dasgupta | Walmart Global Tech Blog | Medium