
Applications using cloud resources have several benefits including easy accessibility, resource pooling, data recovery and backup to a name of few. Working on a platform that hosts multiple such user applications, each of which uses several cloud resources, it became imperative for us to ensure that our users made optimal use of the cloud resources they had procured for their applications. A way to instrument and provide information to users by which they could visualize the usage of their cloud resources was a much-needed feature for our platform. When we build and manage large scale platforms, we often do not comprehend that there is a plethora of raw data at our disposal. Every second, the system is generating data in the form of logs, metadata, utilization statistics and so on. At first glance, a single log or metadata entry does not give us much information. However, over time, as this data repository builds, patterns emerge, and this can be leveraged to achieve meaningful insights.
This article explains the framework we set up in our platform that provided our users insights on the usage of cloud resources in each of their applications.
Instrument and Aggregate Data
We manage a multi-tenant platform that hosts numerous user applications running across multiple clouds. The underlying infrastructure of our platform consists of several microservices deployed on a Kubernetes cluster with MSSQL and InfluxDB primarily dedicated for storing metadata information.
Fig.1: Pictorial representation of the platform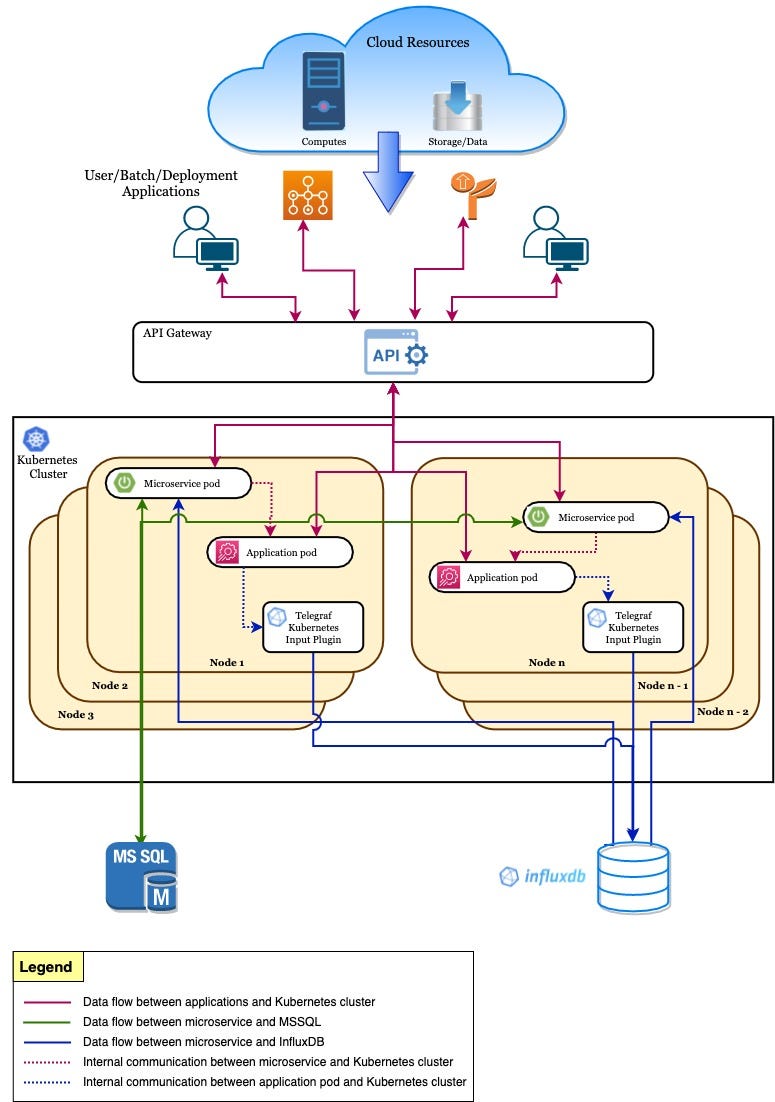
When a user launches their application on our platform, we spawn a pod on one of the nodes of the Kubernetes cluster with compute resources (cores and memory procured from the desired cloud) that the user allocates for the application. This allocation set by users are arbitrary values and may widely differ from the application’s actual resource utilization.
When the application runs, its resource usage, more specifically in our case, the Kubernetes pod resource usage data is captured and stored in a timeseries database — InfluxDB. InfluxData’s open source, plugin-based agent — Telegraf Kubernetes input plugin which runs as part of a DaemonSet within every Kubernetes node is configured and used to gather metrics about the running pods and stores it in InfluxDB.
In InfluxDB, all data is associated with a timestamp. Timestamps in InfluxDB can have a precision of seconds, microseconds or even nanoseconds. The data itself is stored in form of “measurements” which is conceptually similar to a relational table. “Measurements” consists of “fields”, “tags” and the “time” columns. All “field” values are always associated with a timestamp. You can perform computations on them to arrive at the desired metrics. “Tags” are similar to columns that you would generally use for filtering or grouping your data. More on the key concepts of InfluxDB can be found here.
Fig.2: Cloud resource utilization statistics per minute for a single application (id: 7267)
Fig.2 is an example of a typical “measurement” in InfluxDB. For easy visualization, the data has been aggregated over every minute. However, in reality, the measurement captures the cpu and memory used by the application every second. The columns “mean_cpu” and “mean_mem” represent “fields” and are associated with a timestamp. The column “path” is called a “tag” and it represents a unique identifier for an application — the application id, in this case.
Providing every second detail of resource usage does not provide much insight to users. Instead, if we aggregate this data either daily or every fortnight, users will be able to get a better perspective of their resource usage. This is what we did on the measurement.
InfluxQL can be used to query as well as perform aggregations on the measurements. We not only needed to aggregate the data at a daily level, but we also needed a mechanism that could run like a schedule and store the aggregated results. InfluxQL continuous queries were the perfect fit for this use case. Continuous queries are InfluxQL queries that run automatically and periodically on realtime data and store query results in the specified measurement. More on InfluxQL can be found here.
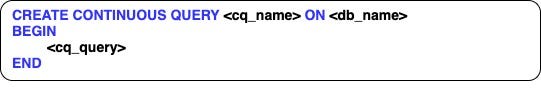 Fig. 3a: Basic Syntax of a continuous query. “cq_name” is the name given to continuous query which is created in the database “db_name”.
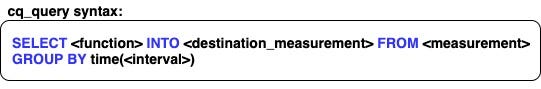 Fig. 3b: Basic syntax of the “cq_query” used in continuous queries. The “destination_measurement” is the name of the new measurement created. The continuous query uses the “GROUP BY” time interval to determine when to execute the query.
We created a continuous query that ran daily for each of the user applications. It calculated the average resource usage of the application aggregated over each day and stored the results in a new measurement.
Fig 4. New measurement capturing cloud resource usage of the application (id: 7267) aggregated on a daily basis.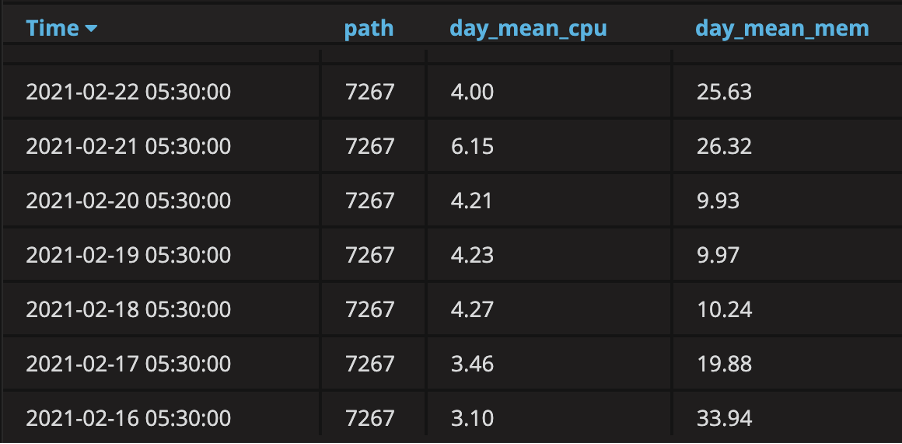
Define Baselines and Derive Insights
Now that we had a daily aggregation of the resource usage for all applications, stored in a separate measurement, we still needed a way to derive meaningful insights from it that would be beneficial for our users.
The first step was to setup thresholds against which we could compare every application’s resource usage. To do so, we needed a baseline. We retrieved the average resource usage of some of the heavily used applications over a span of two weeks from the influx measurement we had set up earlier. We also captured the resources allocated by users to each of these applications in our metadata database, MSSQL. Both these tables were compared to identify patterns in the data.
Some key patterns we found were:
- Many applications were running at an underutilized resource capacity. Applications were allocated a lot more resources than what was actually required for it to run.
- Some applications were cpu intensive applications but didn’t need as much memory allocated to it. While others were memory intensive applications and didn’t need as many cpu cores allocated to it.
- Other applications hit their maximum resource capacity on some days but were underutilized or in some cases unused on other days.
- Few applications were allocated resources which were not being utilized.
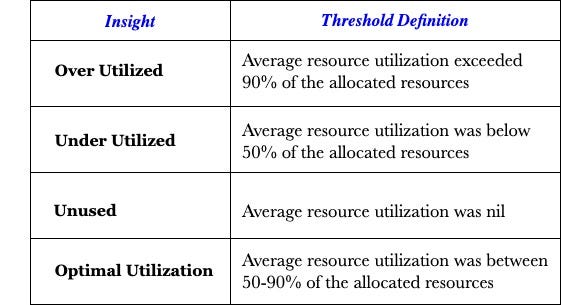
Using these patterns, we identified 4 Insight categories and their corresponding threshold definitions.
Impactful Reporting
Once the thresholds for identifying the applications’ category was set up, we had to extend it to the numerous applications that were running on our platform and convey these derived insights to users for their respective applications. One of the most prominent and impactful ways for us to show these insights to users was when they logged into their application’s user interface. We achieved this by creating RESTful APIs in our Springboot based microservice.
For every application running on the platform, we used the influxdb-java client library to read the application’s aggregated resource usage data from InfluxDB and stored this data in the platform’s metadata database, MSSQL. We then applied the thresholds derived earlier on the user allocated resources of the application. This served as a benchmark against which the application’s aggregated resource usage could be compared. We incorporated all the above computational logic into our APIs and arrived at appropriate insights regarding each application’s cloud resource usage. Lastly, we exposed these API endpoints to our frontend, where users were able visualize and assess their application’s cloud resource usage over a period of two weeks.
Refresh and Realign Insights
The insights provided to users had to be constantly updated so that users do not get any stale information. Providing fresh insights only at the beginning of every other week would not be useful for users to identify bottlenecks due to resource crunches while their applications were running or identifying any areas where resources among different applications could be shared or better managed. For this reason, we ran a daily background process which performed a running average of the applications’ resource usage over the previous two weeks which was used to update and refresh the insights on the application’s user interface.
The intent behind providing insights was for users to be able to have an overview of the resources consumed by all their applications, thereby giving them control and the ability to manage their cloud resources in a more efficient way. Unused resources allocated to underutilized applications could be released to the common resource pool, from where it could be consumed by new or existing applications. Overutilized applications that often ran into resource crunches could consume resources from the common pool as well. As a pre-emptive measure, for overutilized applications, we provided an additional insight regarding the peak resource usage of the application, that is the maximum resources the application used at any point of time it was running. This gave users an indication that allocating resources to the application lesser than the said peak could result in a failure of their applications. In this way, users were able to manage and optimally use cloud resources across all their applications.
While the insights on the applications were proving to be beneficial to users, we also needed a way to reflect the appropriate insight after the user had realigned and managed the resources across applications. While the applications’ insights were refreshed daily, we also wanted our users to see the impact of their actions in real-time. Thus, for any change to the application’s allocated resources, we triggered a process that re-computed the thresholds for that application against which its resource usage could be compared. The updated insight based on the action taken by the user was immediately made visible on the user interface of their applications.
Providing insights on the user interface was just one of the options we had taken considering the ease with which our users can analyse their cloud resource usage and manage them across applications. This could easily be extended by automating a process where users received an in-depth analysis of their application’s resources every week via email. You could plug it into any of the alerting systems to monitor applications hitting resource thresholds. It can also be plugged into any of your existing visualization tools to create dashboards and metrics centred around cloud resource usage.
Conclusion
Utilizing cloud resources definitely allows unlimited scalability for applications. However, being mindful of where and how these resources are being used is vital. On our platform, we achieved this by having a closer look at the data around the system we had built. Using simple techniques, this data was harnessed and converted into meaningful insights for users. Additionally, with this new cognizance about their own applications, users are now able to contribute towards optimising the overall usage of cloud resources across all applications in the organization.
How to optimise cloud resources with utilization insights? was originally published in Walmart Global Tech Blog on Medium, where people are continuing the conversation by highlighting and responding to this story.
Article Link: How to optimise cloud resources with utilization insights? | by Rilda Varghese | Walmart Global Tech Blog | Aug, 2021 | Medium