Monitoring Kubelet is essential when running Kubernetes in production. Kubelet is a very important service inside a Kubernetes cluster.
This Kubernetes component is responsible for ensuring the containers defined in the Pods are running and healthy. As soon as the scheduler designates a node to run the Pod, the Kubelet takes the assignment and runs the Pod and its workloads.

In the event of facing issues with the Kubernetes Kubelet, it is really important to take action and fix the problem as soon as possible, otherwise the Kubernetes node will go into a NotReady state. Thanks to its metrics instrumentation provided out of the box, you can monitor Kubelet, but there are tons of metrics! Which of these should you review?
If you want to learn more about how to monitor Kubelet and what the most important Kubelet metrics are, keep reading and discover how you can prepare yourself for avoiding outages.
What is the Kubelet?
The Kubernetes Kubelet runs in both control plane and worker nodes, as the primary node agent for all the nodes.
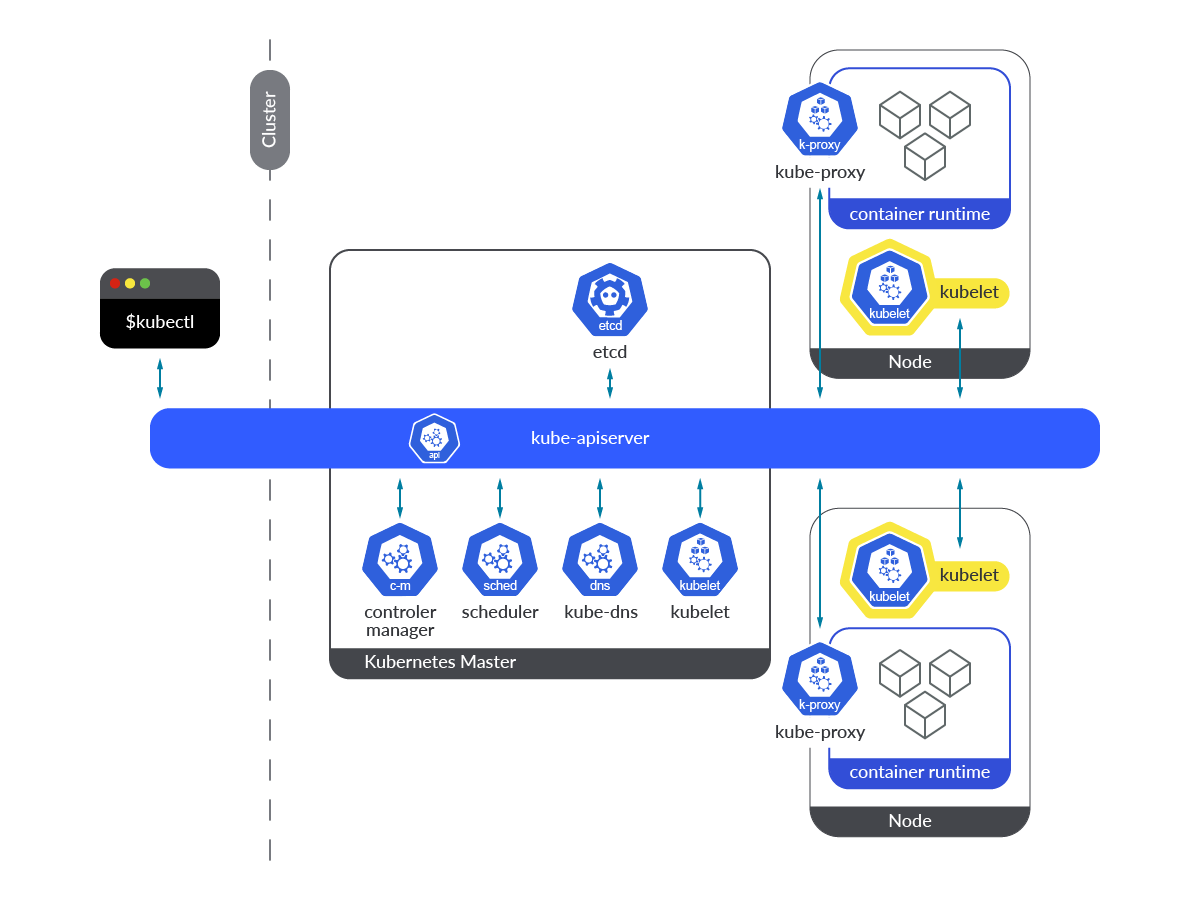
The Kubelet works in a declarative way, receiving PodSpecs and ensuring that the containers defined there are currently running and in a healthy state. By its nature, being an agent running as a service in the OS itself, it’s very different from other components that run as Kubernetes entities within the cluster.
The Kubelet service needs to be up and running permanently. This way it will be able to take any new PodSpec definition from the Kubernetes API as soon as the Pod is scheduled to run in a particular node. If the Kubelet is not working properly, has crashed, or it is down for any reason, the Kubernetes node will go into a NotReady state, and no new pods will be created on that node.
Another important thing to take into consideration when Kubelet is down or not working properly is this; Neither Liveness nor Readiness probes will be executed, so if a workload already running on a Pod starts to fail or doesn’t work properly when Kubelet is down, it won’t be restarted, causing impact on stability, availability, and performance of such application.
How to monitor Kubelet
The Prometheus node role discovers one target per cluster node with the address defaulting to the Kubelet’s HTTP port, so you can still rely on this Prometheus role as a way to scrape the Kubelet metrics from your Prometheus instance.
Kubelet is instrumented and exposes the /metrics endpoint by default through the port 10250, providing information about Pods’ volumes and internal operations. The endpoint can be easily scraped, you just need to access the endpoint through the HTTPS protocol by using the required certificates.
In order to get the Kubelet metrics, get access to the node itself, or ssh into a Pod, this service is listening on 0.0.0.0 address, so in terms of connectivity there are no restrictions at all. If the Pod has access to the host network, you can access it using localhost too.
Code language: Perl (perl)$ curl -k -H "Authorization: Bearer $(cat /var/run/secrets/kubernetes.io/serviceaccount/token)" https://192.168.119.30:10250/metrics # HELP apiserver_audit_event_total [ALPHA] Counter of audit events generated and sent to the audit backend. # TYPE apiserver_audit_event_total counter apiserver_audit_event_total 0 # HELP apiserver_audit_requests_rejected_total [ALPHA] Counter of apiserver requests rejected due to an error in audit logging backend. # TYPE apiserver_audit_requests_rejected_total counter apiserver_audit_requests_rejected_total 0 # HELP apiserver_client_certificate_expiration_seconds [ALPHA] Distribution of the remaining lifetime on the certificate used to authenticate a request. # TYPE apiserver_client_certificate_expiration_seconds histogram apiserver_client_certificate_expiration_seconds_bucket{le="0"} 0 apiserver_client_certificate_expiration_seconds_bucket{le="1800"} 0 (output truncated)
If you want your Prometheus instance to scrape the Kubelet metrics endpoint, you just need to add the following configuration to the scrape_configs section in your prometheus.yml config file:
Code language: Perl (perl)- bearer_token_file: /var/run/secrets/kubernetes.io/serviceaccount/token job_name: kubernetes-nodes kubernetes_sd_configs: - role: node relabel_configs: - action: labelmap regex: __meta_kubernetes_node_label_(.+) - replacement: kubernetes.default.svc:443 target_label: __address__ - regex: (.+) replacement: /api/v1/nodes/$1/proxy/metrics source_labels: - __meta_kubernetes_node_name target_label: __metrics_path__ scheme: https tls_config: ca_file: /var/run/secrets/kubernetes.io/serviceaccount/ca.crt insecure_skip_verify: true
Then apply the new configuration and recreate the prometheus-server Pod.
Code language: Perl (perl)$ kubectl replace -f prometheus-server.yaml -n monitoring $ kubectl delete pod prometheus-server-5df7b6d9bb-m2d27 -n monitoring
Now, you will see the Kubelet metrics available in your Prometheus instance.
Monitoring the Kubelet: Which metrics should you check?
You already have a Prometheus instance up and running, and configured for scrapping the Kubelet metrics. So, what’s next?
Let’s talk about the key Kubelet metrics you should monitor.Disclaimer: Kubelet metrics might differ between Kubernetes versions. Here, we used Kubernetes 1.25. You can check the latest metrics available for Kubelet in the Kubernetes GitHub repo.
-
Number of Kubelet instances: Here, you will find a way to easily count the number of Kubelet instances running in your Kubernetes cluster. Just sum thekubelet_node_namemetric. The expected value for this PromQL query is the number of nodes of your cluster.sum(kubelet_node_name)
Another way to count the number of
Readynodes is:
Note: If you want to get the number of not-ready nodes, filter bystatus="false".sum(kube_node_status_condition{condition="Ready", status="true"})
-
kubelet_running_pods: Kubelet provides insight to the number of pods running in the node. Check this value regularly and measure if you reach the Pod limits per node, or if these numbers are within the expected range for your Kubernetes cluster.# HELP kubelet_running_pods [ALPHA] Number of pods that have a running pod sandbox # TYPE kubelet_running_pods gauge kubelet_running_pods 12
-
kubelet_running_containers: This metric is quite similar to the previous one, but it counts the number of containers in each node. The information is broken down into three differentcontainer_state: created, exited, and running. Use this metric to get a better understanding on the number of containers running in each node, and measure whether the number of containers is what you expect based on your setup.# HELP kubelet_running_containers [ALPHA] Number of containers currently running # TYPE kubelet_running_containers gauge kubelet_running_containers{container_state="created"} 1 kubelet_running_containers{container_state="exited"} 18 kubelet_running_containers{container_state="running"} 14
-
volume_manager_total_volumes: The Kubelet mounts the volumes indicated by the controller, so it can provide information about them. This metric can be useful to identify and diagnose issues with volumes that are not mounted when a Pod is created. Each plugin_name provides two different state fields: desired_state_of_world and actual_state_of_world. That way, if you mix both values you can easily look for discrepancies.# HELP volume_manager_total_volumes [ALPHA] Number of volumes in Volume Manager # TYPE volume_manager_total_volumes gauge volume_manager_total_volumes{plugin_name="kubernetes.io/configmap",state="actual_state_of_world"} 5 volume_manager_total_volumes{plugin_name="kubernetes.io/configmap",state="desired_state_of_world"} 5 volume_manager_total_volumes{plugin_name="kubernetes.io/downward-api",state="actual_state_of_world"} 1 volume_manager_total_volumes{plugin_name="kubernetes.io/downward-api",state="desired_state_of_world"} 1 volume_manager_total_volumes{plugin_name="kubernetes.io/empty-dir",state="actual_state_of_world"} 2 volume_manager_total_volumes{plugin_name="kubernetes.io/empty-dir",state="desired_state_of_world"} 2 volume_manager_total_volumes{plugin_name="kubernetes.io/host-path",state="actual_state_of_world"} 45 volume_manager_total_volumes{plugin_name="kubernetes.io/host-path",state="desired_state_of_world"} 45 volume_manager_total_volumes{plugin_name="kubernetes.io/projected",state="actual_state_of_world"} 8 volume_manager_total_volumes{plugin_name="kubernetes.io/projected",state="desired_state_of_world"} 8 volume_manager_total_volumes{plugin_name="kubernetes.io/secret",state="actual_state_of_world"} 3 volume_manager_total_volumes{plugin_name="kubernetes.io/secret",state="desired_state_of_world"} 3
Following, you will find the Golden Signals metrics of every operation performed by the Kubelet (kubelet_runtime_operations_total, kubelet_runtime_operations_errors_total, and kubelet_runtime_operations_duration_seconds_bucket). On the other hand, saturation in the Kubelet can be measured with some of the system metrics available.
-
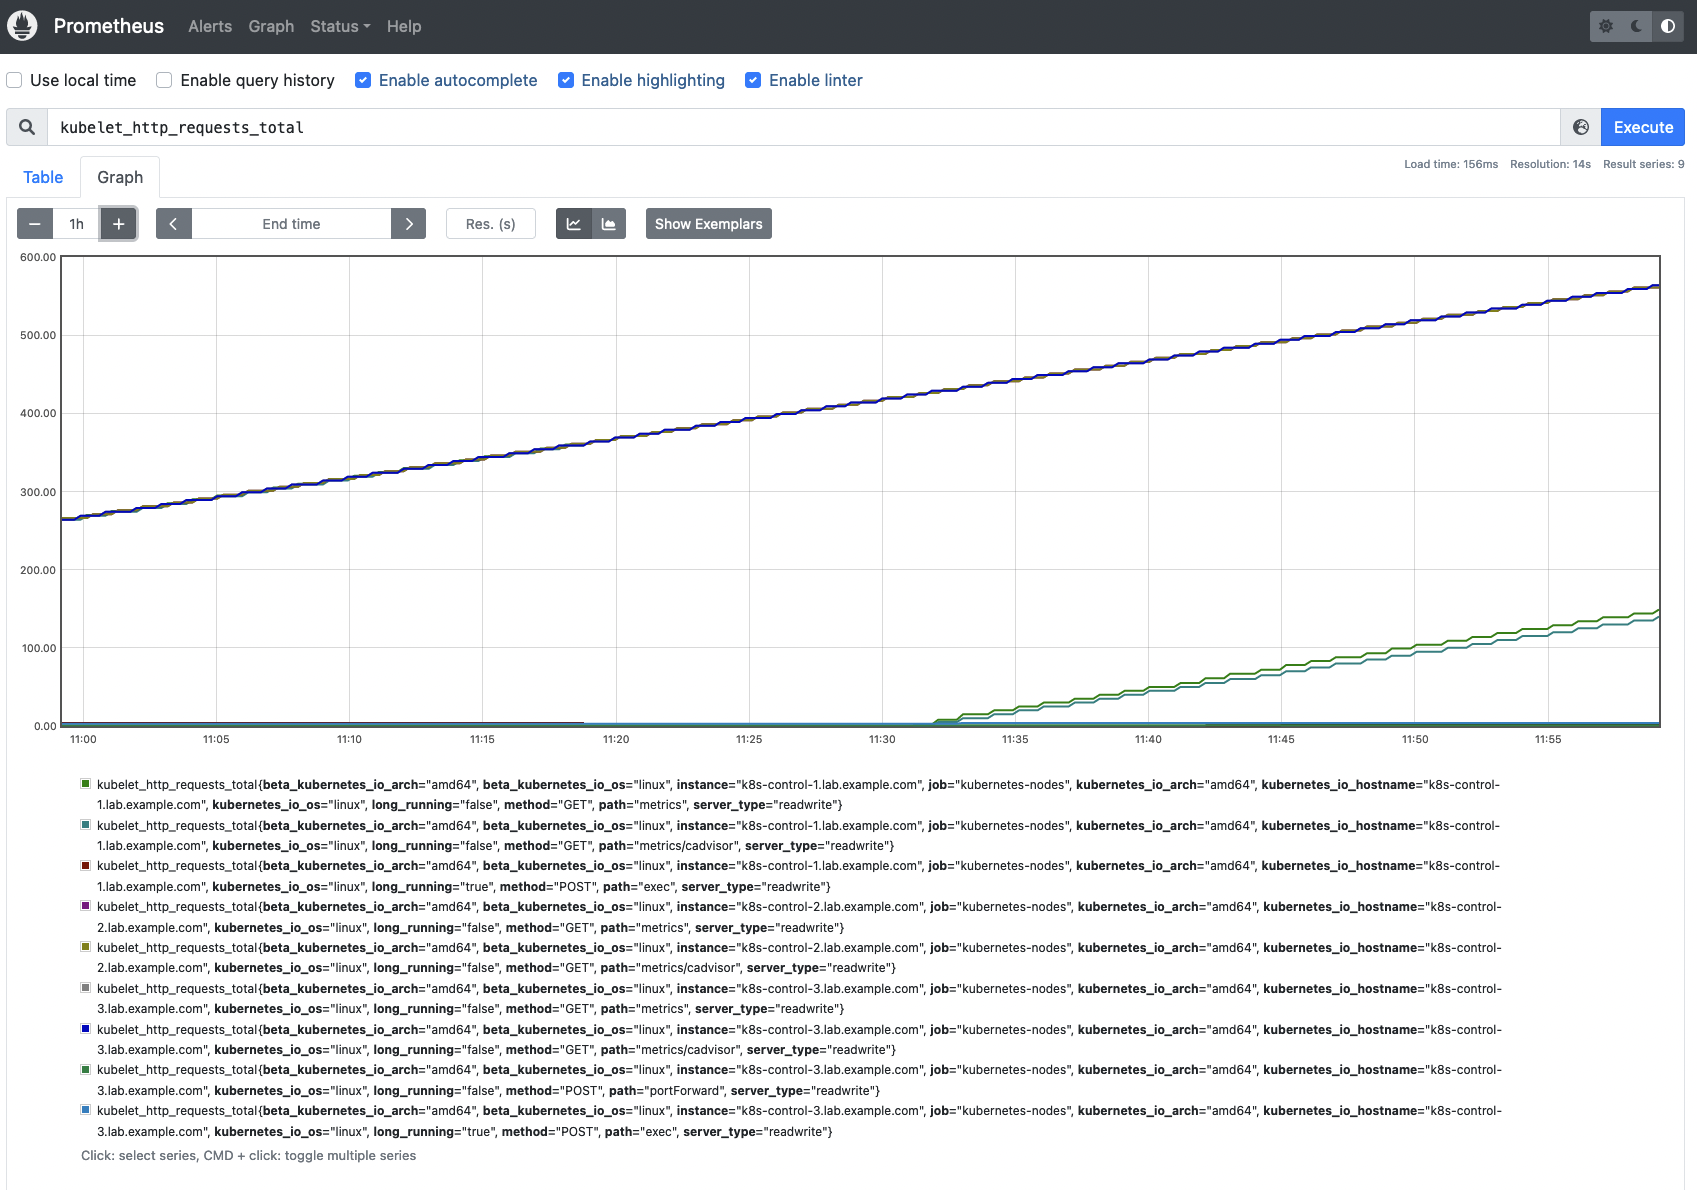
kubelet_runtime_operations_total: This metric provides the number of total runtime operations of each type (container_status, create_container, exec, exec_sync, image_status,list_containers, list_images, list_podsandbox, remove_container, etc).# HELP kubelet_runtime_operations_total [ALPHA] Cumulative number of runtime operations by operation type. # TYPE kubelet_runtime_operations_total counter kubelet_runtime_operations_total{operation_type="container_status"} 744 kubelet_runtime_operations_total{operation_type="create_container"} 33 kubelet_runtime_operations_total{operation_type="exec"} 3 kubelet_runtime_operations_total{operation_type="exec_sync"} 1816 kubelet_runtime_operations_total{operation_type="image_status"} 97 kubelet_runtime_operations_total{operation_type="list_containers"} 16929 kubelet_runtime_operations_total{operation_type="list_images"} 334 kubelet_runtime_operations_total{operation_type="list_podsandbox"} 16777 kubelet_runtime_operations_total{operation_type="podsandbox_status"} 308 kubelet_runtime_operations_total{operation_type="remove_container"} 57 kubelet_runtime_operations_total{operation_type="remove_podsandbox"} 18 kubelet_runtime_operations_total{operation_type="start_container"} 33 kubelet_runtime_operations_total{operation_type="status"} 1816 kubelet_runtime_operations_total{operation_type="stop_container"} 11 kubelet_runtime_operations_total{operation_type="stop_podsandbox"} 36 kubelet_runtime_operations_total{operation_type="update_runtime_config"} 1 kubelet_runtime_operations_total{operation_type="version"} 892This is a counter metric, you can use the rate function to calculate the average increase rate for Kubelet runtime operations.
sum(rate(kubelet_runtime_operations_total{job="kubernetes-nodes"}[5m])) by (operation_type, instance)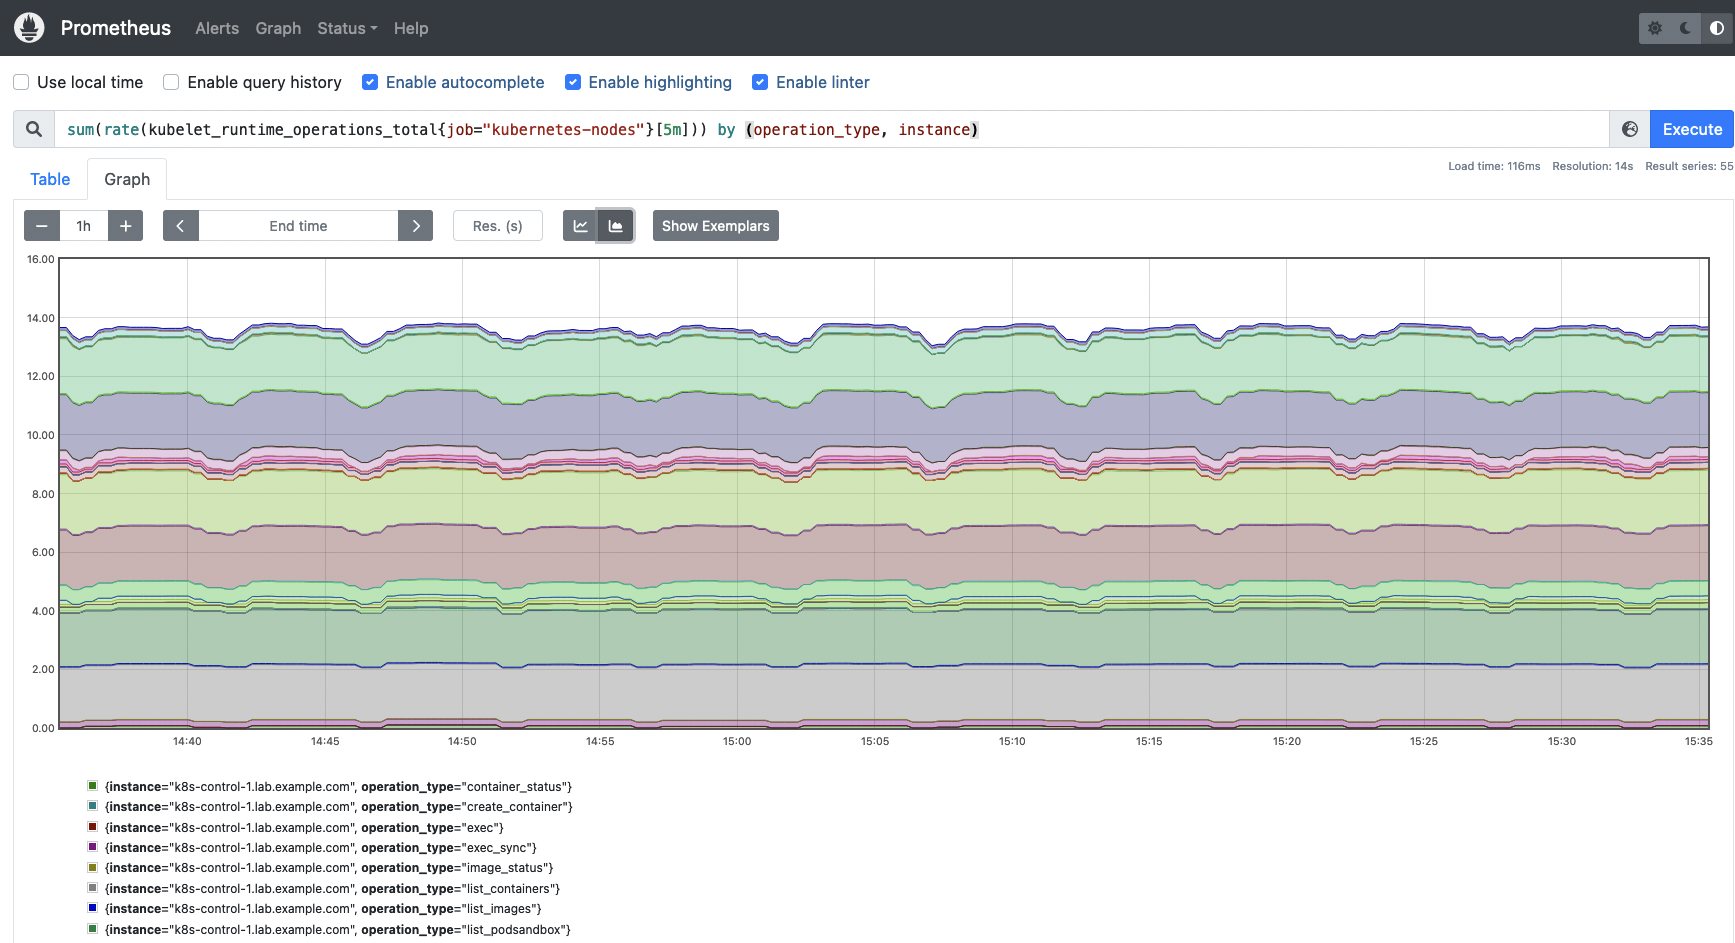
-
kubelet_runtime_operations_errors_total: Number of errors in operations at runtime level. It can be a good indicator of low level issues in the nodes, such as problems with the container runtime. Like the previous metric,kubelet_runtime_operation_errors_totalis a counter, you can use the rate function to measure the average increase of errors over time.
-
kubelet_runtime_operations_duration_seconds_bucket: This metric measures the time of every operation. It can be useful to calculate percentiles.# HELP kubelet_runtime_operations_duration_seconds [ALPHA] Duration in seconds of runtime operations. Broken down by operation type. # TYPE kubelet_runtime_operations_duration_seconds histogram kubelet_runtime_operations_duration_seconds_bucket{operation_type="container_status",le="0.005"} 837 kubelet_runtime_operations_duration_seconds_bucket{operation_type="container_status",le="0.0125"} 840 kubelet_runtime_operations_duration_seconds_bucket{operation_type="container_status",le="0.03125"} 840 kubelet_runtime_operations_duration_seconds_bucket{operation_type="container_status",le="0.078125"} 840 kubelet_runtime_operations_duration_seconds_bucket{operation_type="container_status",le="0.1953125"} 840 kubelet_runtime_operations_duration_seconds_bucket{operation_type="container_status",le="0.48828125"} 840 kubelet_runtime_operations_duration_seconds_bucket{operation_type="container_status",le="1.220703125"} 840 kubelet_runtime_operations_duration_seconds_bucket{operation_type="container_status",le="3.0517578125"} 840 kubelet_runtime_operations_duration_seconds_bucket{operation_type="container_status",le="7.62939453125"} 840 kubelet_runtime_operations_duration_seconds_bucket{operation_type="container_status",le="19.073486328125"} 840 kubelet_runtime_operations_duration_seconds_bucket{operation_type="container_status",le="47.6837158203125"} 840 kubelet_runtime_operations_duration_seconds_bucket{operation_type="container_status",le="119.20928955078125"} 840 kubelet_runtime_operations_duration_seconds_bucket{operation_type="container_status",le="298.0232238769531"} 840 kubelet_runtime_operations_duration_seconds_bucket{operation_type="container_status",le="745.0580596923828"} 840 kubelet_runtime_operations_duration_seconds_bucket{operation_type="container_status",le="+Inf"} 840 kubelet_runtime_operations_duration_seconds_sum{operation_type="container_status"} 0.4227565899999999You may want to calculate the 99th percentile of the Kubelet runtime operations duration by instance and operation type.
histogram_quantile(0.99, sum(rate(kubelet_runtime_operations_duration_seconds_bucket{instance=~".*"}[5m])) by (instance, operation_type, le))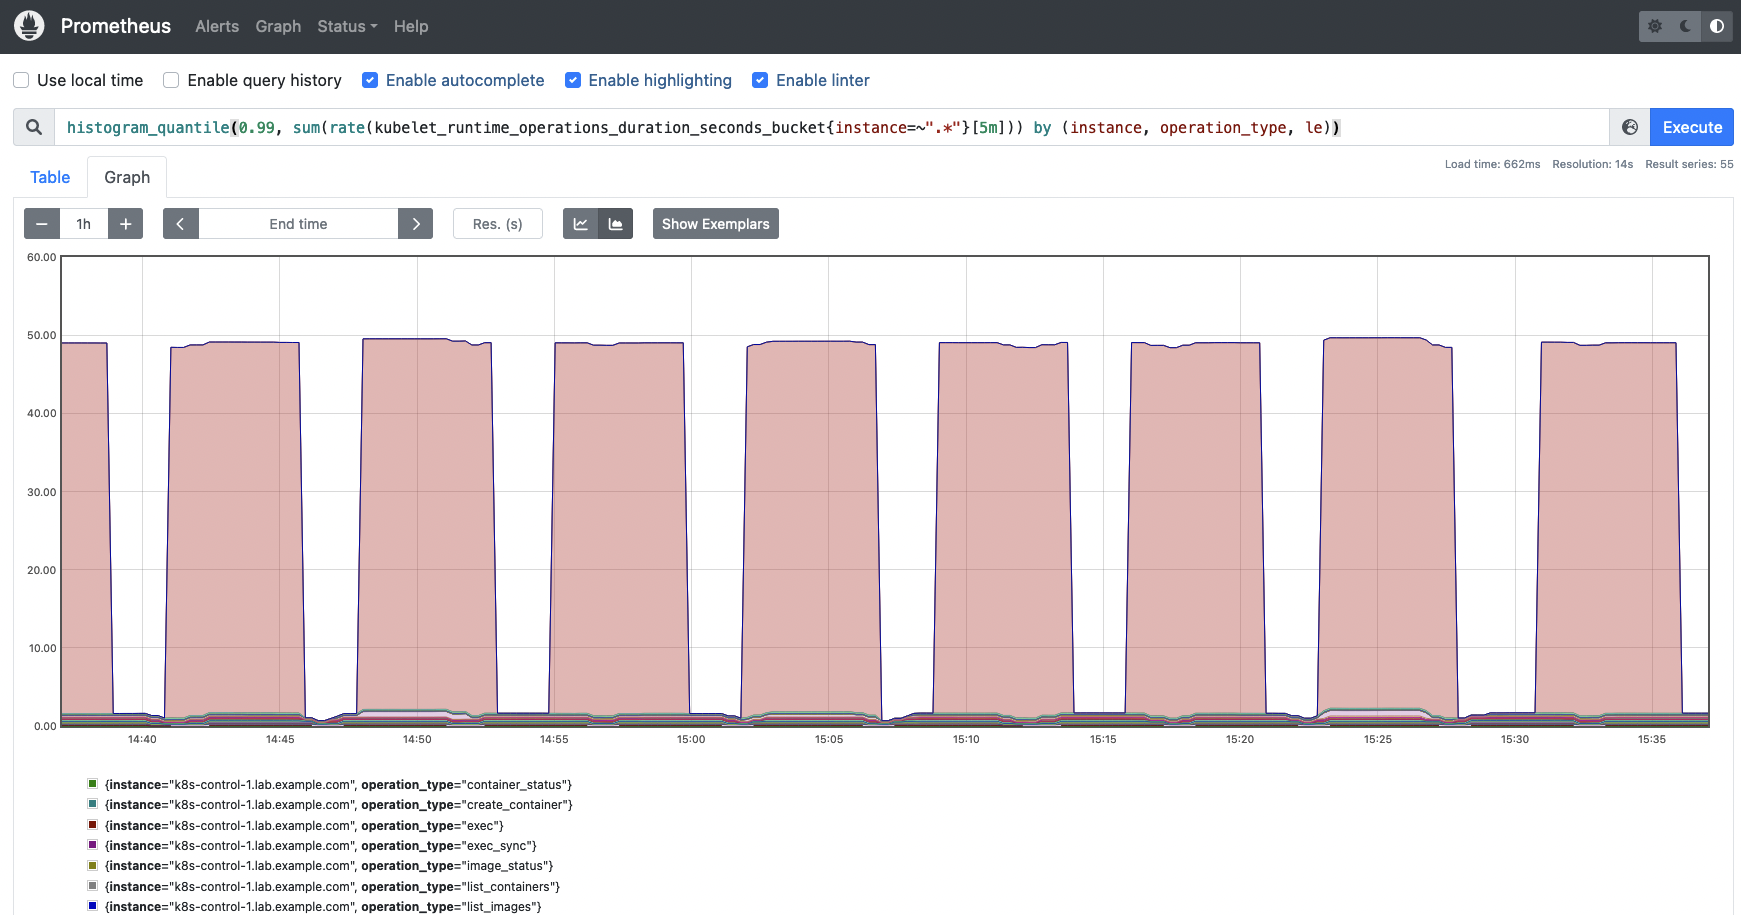
The following metrics provide information about the Pod start rate and its duration. These metrics can be a good indicator of issues with the container runtime.
-
kubelet_pod_start_duration_seconds_count: This metric gives you a count on the start operations for Pods.# HELP kubelet_pod_start_duration_seconds [ALPHA] Duration in seconds from kubelet seeing a pod for the first time to the pod starting to run # TYPE kubelet_pod_start_duration_seconds histogram kubelet_pod_start_duration_seconds_count 14
-
kubelet_pod_worker_duration_seconds_count: The number of create, sync, and update operations for a single Pod.# HELP kubelet_pod_worker_duration_seconds [ALPHA] Duration in seconds to sync a single pod. Broken down by operation type: create, update, or sync # TYPE kubelet_pod_worker_duration_seconds histogram kubelet_pod_worker_duration_seconds_count{operation_type="create"} 21 kubelet_pod_worker_duration_seconds_count{operation_type="sync"} 2424 kubelet_pod_worker_duration_seconds_count{operation_type="update"} 3 -
kubelet_pod_start_duration_seconds_bucket: This metric gives you a histogram on the duration in seconds from the Kubelet seeing a Pod for the first time to the Pod starting to run.# HELP kubelet_pod_start_duration_seconds [ALPHA] Duration in seconds from kubelet seeing a pod for the first time to the pod starting to run # TYPE kubelet_pod_start_duration_seconds histogram kubelet_pod_start_duration_seconds_bucket{le="0.005"} 6 kubelet_pod_start_duration_seconds_bucket{le="0.01"} 8 kubelet_pod_start_duration_seconds_bucket{le="0.025"} 8 kubelet_pod_start_duration_seconds_bucket{le="0.05"} 8 kubelet_pod_start_duration_seconds_bucket{le="0.1"} 8 kubelet_pod_start_duration_seconds_bucket{le="0.25"} 8 kubelet_pod_start_duration_seconds_bucket{le="0.5"} 8 kubelet_pod_start_duration_seconds_bucket{le="1"} 12 kubelet_pod_start_duration_seconds_bucket{le="2.5"} 14 kubelet_pod_start_duration_seconds_bucket{le="5"} 14 kubelet_pod_start_duration_seconds_bucket{le="10"} 14 kubelet_pod_start_duration_seconds_bucket{le="+Inf"} 14 kubelet_pod_start_duration_seconds_sum 7.106590537999999 kubelet_pod_start_duration_seconds_count 14You can get the 95th percentile of the Pod start duration seconds by node.
histogram_quantile(0.95,sum(rate(kubelet_pod_start_duration_seconds_bucket{instance=~".*"}[5m])) by (instance, le)) -
kubelet_pod_worker_duration_seconds_bucket: This metric provides the duration in seconds to sync a Pod. The information is broken down into three different types: create, update, and sync.# HELP kubelet_pod_worker_duration_seconds [ALPHA] Duration in seconds to sync a single pod. Broken down by operation type: create, update, or sync # TYPE kubelet_pod_worker_duration_seconds histogram kubelet_pod_worker_duration_seconds_bucket{operation_type="create",le="0.005"} 0 kubelet_pod_worker_duration_seconds_bucket{operation_type="create",le="0.01"} 0 kubelet_pod_worker_duration_seconds_bucket{operation_type="create",le="0.025"} 0 kubelet_pod_worker_duration_seconds_bucket{operation_type="create",le="0.05"} 0 kubelet_pod_worker_duration_seconds_bucket{operation_type="create",le="0.1"} 0 kubelet_pod_worker_duration_seconds_bucket{operation_type="create",le="0.25"} 0 kubelet_pod_worker_duration_seconds_bucket{operation_type="create",le="0.5"} 4 kubelet_pod_worker_duration_seconds_bucket{operation_type="create",le="1"} 8 kubelet_pod_worker_duration_seconds_bucket{operation_type="create",le="2.5"} 9 kubelet_pod_worker_duration_seconds_bucket{operation_type="create",le="5"} 9 kubelet_pod_worker_duration_seconds_bucket{operation_type="create",le="10"} 21 kubelet_pod_worker_duration_seconds_bucket{operation_type="create",le="+Inf"} 21 kubelet_pod_worker_duration_seconds_sum{operation_type="create"} 80.867455331 kubelet_pod_worker_duration_seconds_count{operation_type="create"} 21It may be worth checking percentiles for the Kubelet Pod worker duration metric as well, this way you will get a better understanding of how the different operations are performing across all the nodes.
histogram_quantile(0.99, sum(rate(kubelet_pod_worker_duration_seconds_bucket{instance=~".*"}[5m])) by (instance, operation_type, le))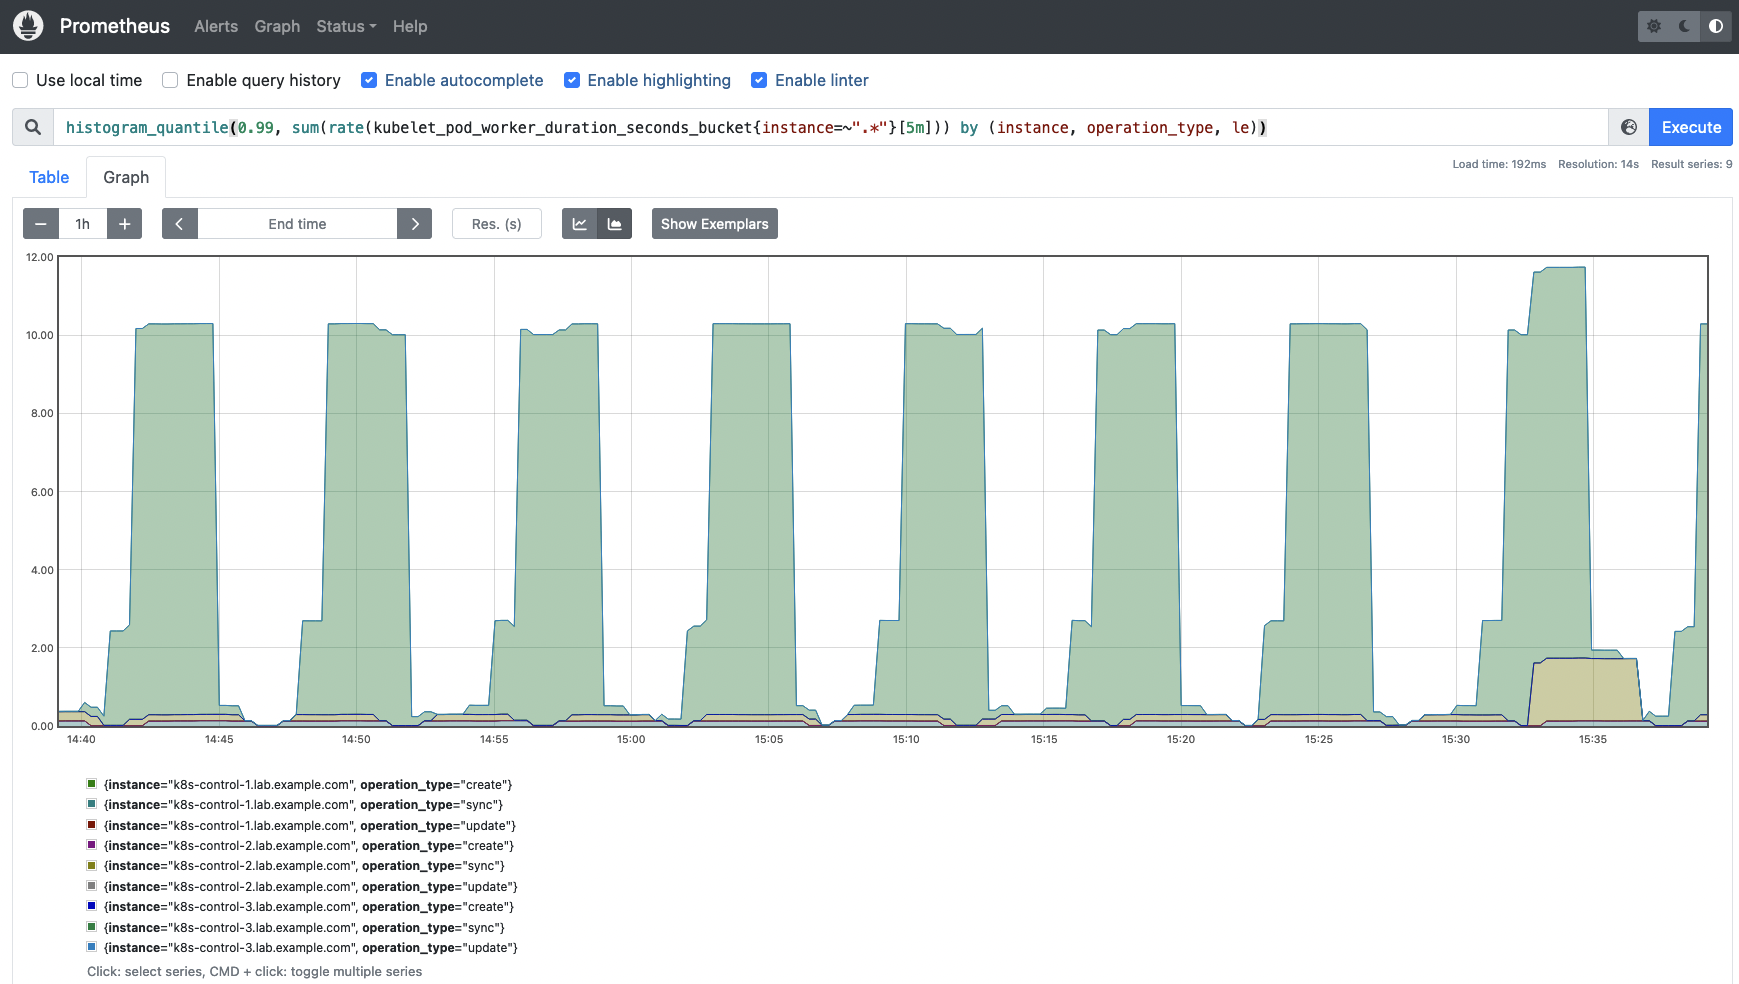
It’s time for the Storage Golden Signals metrics:
-
storage_operation_duration_seconds_count: The number of storage operations for everyvolume_plugin.# HELP storage_operation_duration_seconds [ALPHA] Storage operation duration # TYPE storage_operation_duration_seconds histogram storage_operation_duration_seconds_count{migrated="false",operation_name="verify_controller_attached_volume",status="success",volume_plugin="kubernetes.io/configmap"} 5 storage_operation_duration_seconds_count{migrated="false",operation_name="verify_controller_attached_volume",status="success",volume_plugin="kubernetes.io/downward-api"} 1 storage_operation_duration_seconds_count{migrated="false",operation_name="verify_controller_attached_volume",status="success",volume_plugin="kubernetes.io/empty-dir"} 2 storage_operation_duration_seconds_count{migrated="false",operation_name="verify_controller_attached_volume",status="success",volume_plugin="kubernetes.io/host-path"} 45 storage_operation_duration_seconds_count{migrated="false",operation_name="verify_controller_attached_volume",status="success",volume_plugin="kubernetes.io/projected"} 8 storage_operation_duration_seconds_count{migrated="false",operation_name="verify_controller_attached_volume",status="success",volume_plugin="kubernetes.io/secret"} 3 (output truncated)In order to get the storage operation rate you can use the following query. Get an overview on the different operations performed, the status of each operation and the volume plugin involved.
sum(rate(storage_operation_duration_seconds_count{instance=~".*"}[5m])) by (instance, operation_name, volume_plugin, status)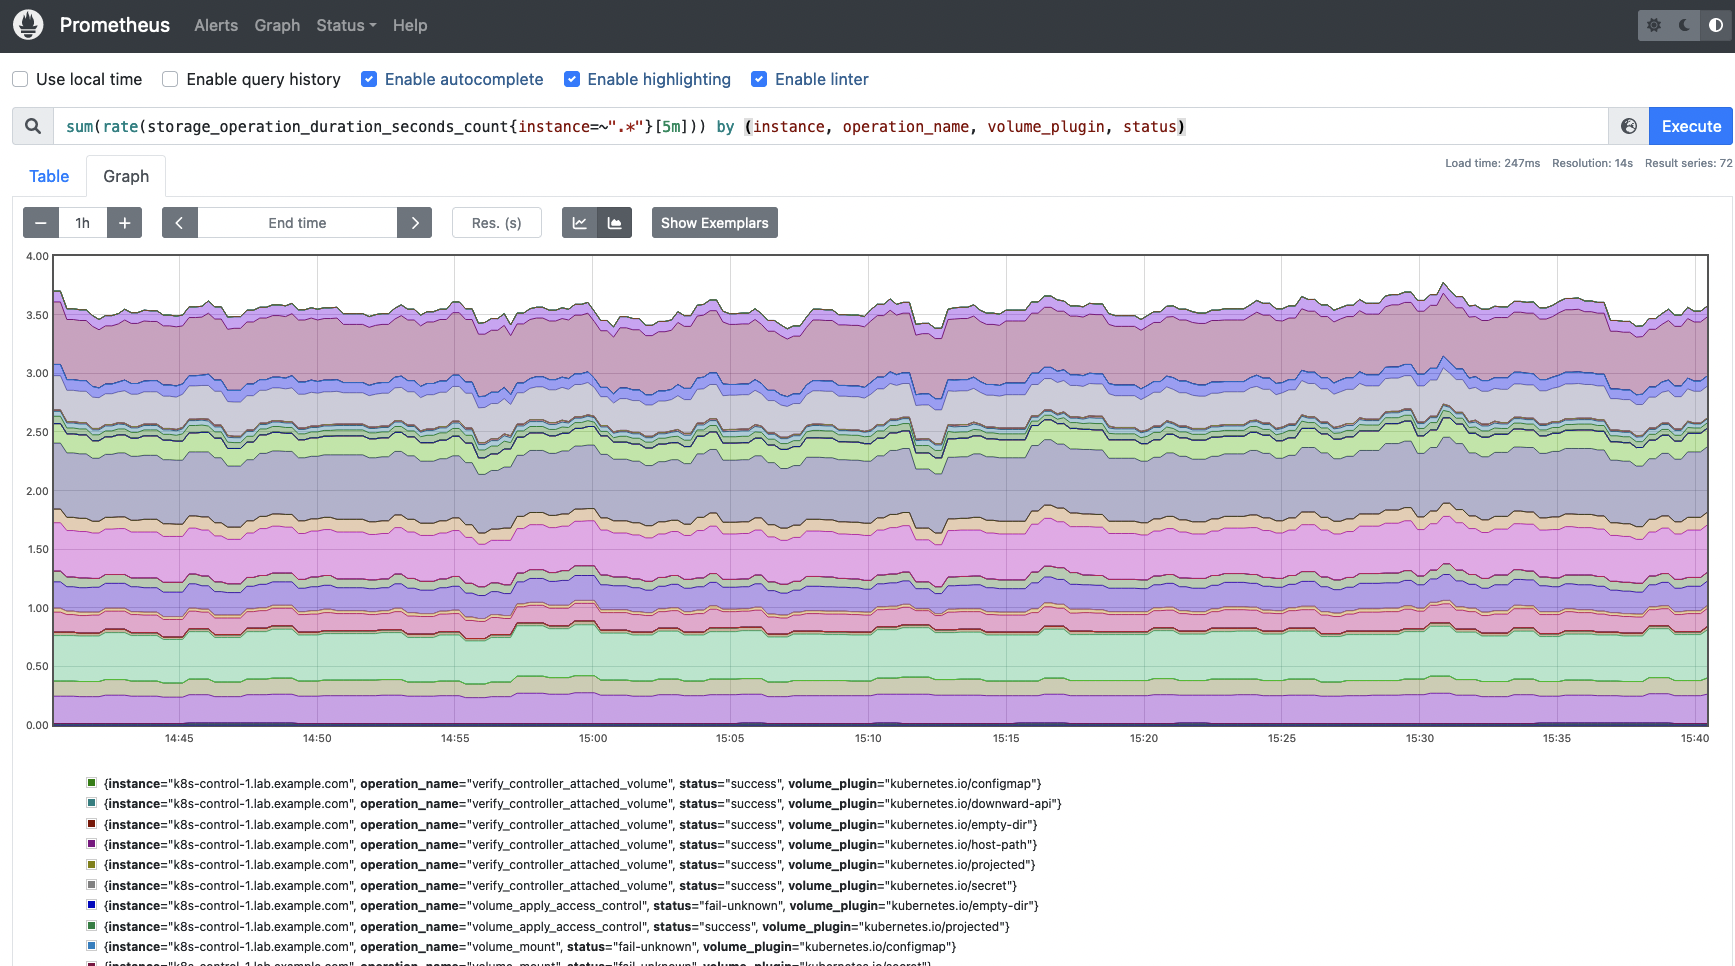
-
storage_operation_duration_seconds_bucket: Measures the duration in seconds for each storage operation. This information is represented by a histogram.# HELP storage_operation_duration_seconds [ALPHA] Storage operation duration # TYPE storage_operation_duration_seconds histogram storage_operation_duration_seconds_bucket{migrated="false",operation_name="verify_controller_attached_volume",status="success",volume_plugin="kubernetes.io/configmap",le="0.1"} 5 storage_operation_duration_seconds_bucket{migrated="false",operation_name="verify_controller_attached_volume",status="success",volume_plugin="kubernetes.io/configmap",le="0.25"} 5 storage_operation_duration_seconds_bucket{migrated="false",operation_name="verify_controller_attached_volume",status="success",volume_plugin="kubernetes.io/configmap",le="0.5"} 5 storage_operation_duration_seconds_bucket{migrated="false",operation_name="verify_controller_attached_volume",status="success",volume_plugin="kubernetes.io/configmap",le="1"} 5 storage_operation_duration_seconds_bucket{migrated="false",operation_name="verify_controller_attached_volume",status="success",volume_plugin="kubernetes.io/configmap",le="2.5"} 5 storage_operation_duration_seconds_bucket{migrated="false",operation_name="verify_controller_attached_volume",status="success",volume_plugin="kubernetes.io/configmap",le="5"} 5 storage_operation_duration_seconds_bucket{migrated="false",operation_name="verify_controller_attached_volume",status="success",volume_plugin="kubernetes.io/configmap",le="10"} 5 storage_operation_duration_seconds_bucket{migrated="false",operation_name="verify_controller_attached_volume",status="success",volume_plugin="kubernetes.io/configmap",le="15"} 5 storage_operation_duration_seconds_bucket{migrated="false",operation_name="verify_controller_attached_volume",status="success",volume_plugin="kubernetes.io/configmap",le="25"} 5 storage_operation_duration_seconds_bucket{migrated="false",operation_name="verify_controller_attached_volume",status="success",volume_plugin="kubernetes.io/configmap",le="50"} 5 storage_operation_duration_seconds_bucket{migrated="false",operation_name="verify_controller_attached_volume",status="success",volume_plugin="kubernetes.io/configmap",le="120"} 5 storage_operation_duration_seconds_bucket{migrated="false",operation_name="verify_controller_attached_volume",status="success",volume_plugin="kubernetes.io/configmap",le="300"} 5 storage_operation_duration_seconds_bucket{migrated="false",operation_name="verify_controller_attached_volume",status="success",volume_plugin="kubernetes.io/configmap",le="600"} 5 storage_operation_duration_seconds_bucket{migrated="false",operation_name="verify_controller_attached_volume",status="success",volume_plugin="kubernetes.io/configmap",le="+Inf"} 5 storage_operation_duration_seconds_sum{migrated="false",operation_name="verify_controller_attached_volume",status="success",volume_plugin="kubernetes.io/configmap"} 0.012047289 storage_operation_duration_seconds_count{migrated="false",operation_name="verify_controller_attached_volume",status="success",volume_plugin="kubernetes.io/configmap"} 5 (output truncated)This time, you may want to get the 99th percentile of the storage operation duration, grouped by instance, operation name and volume plugin.
histogram_quantile(0.99, sum(rate(storage_operation_duration_seconds_bucket{instance=~".*"}[5m])) by (instance, operation_name, volume_plugin, le))
Now, let’s talk about the Kubelet cgroup manager metrics.
-
kubelet_cgroup_manager_duration_seconds_bucket: This metric provides the duration in seconds for the cgroup manager operations. This data is broken down into two different methods: destroy and update.# HELP kubelet_cgroup_manager_duration_seconds [ALPHA] Duration in seconds for cgroup manager operations. Broken down by method. # TYPE kubelet_cgroup_manager_duration_seconds histogram kubelet_cgroup_manager_duration_seconds_bucket{operation_type="destroy",le="0.005"} 3 kubelet_cgroup_manager_duration_seconds_bucket{operation_type="destroy",le="0.01"} 6 kubelet_cgroup_manager_duration_seconds_bucket{operation_type="destroy",le="0.025"} 9 kubelet_cgroup_manager_duration_seconds_bucket{operation_type="destroy",le="0.05"} 9 kubelet_cgroup_manager_duration_seconds_bucket{operation_type="destroy",le="0.1"} 9 kubelet_cgroup_manager_duration_seconds_bucket{operation_type="destroy",le="0.25"} 9 kubelet_cgroup_manager_duration_seconds_bucket{operation_type="destroy",le="0.5"} 9 kubelet_cgroup_manager_duration_seconds_bucket{operation_type="destroy",le="1"} 9 kubelet_cgroup_manager_duration_seconds_bucket{operation_type="destroy",le="2.5"} 9 kubelet_cgroup_manager_duration_seconds_bucket{operation_type="destroy",le="5"} 9 kubelet_cgroup_manager_duration_seconds_bucket{operation_type="destroy",le="10"} 9 kubelet_cgroup_manager_duration_seconds_bucket{operation_type="destroy",le="+Inf"} 9 kubelet_cgroup_manager_duration_seconds_sum{operation_type="destroy"} 0.09447291900000002 kubelet_cgroup_manager_duration_seconds_count{operation_type="destroy"} 9 kubelet_cgroup_manager_duration_seconds_bucket{operation_type="update",le="0.005"} 542 kubelet_cgroup_manager_duration_seconds_bucket{operation_type="update",le="0.01"} 558 kubelet_cgroup_manager_duration_seconds_bucket{operation_type="update",le="0.025"} 561 kubelet_cgroup_manager_duration_seconds_bucket{operation_type="update",le="0.05"} 561 kubelet_cgroup_manager_duration_seconds_bucket{operation_type="update",le="0.1"} 561 kubelet_cgroup_manager_duration_seconds_bucket{operation_type="update",le="0.25"} 561 kubelet_cgroup_manager_duration_seconds_bucket{operation_type="update",le="0.5"} 561 kubelet_cgroup_manager_duration_seconds_bucket{operation_type="update",le="1"} 561 kubelet_cgroup_manager_duration_seconds_bucket{operation_type="update",le="2.5"} 561 kubelet_cgroup_manager_duration_seconds_bucket{operation_type="update",le="5"} 561 kubelet_cgroup_manager_duration_seconds_bucket{operation_type="update",le="10"} 561 kubelet_cgroup_manager_duration_seconds_bucket{operation_type="update",le="+Inf"} 561 kubelet_cgroup_manager_duration_seconds_sum{operation_type="update"} 1.2096012159999996 kubelet_cgroup_manager_duration_seconds_count{operation_type="update"} 561Let’s see how to get a histogram that represents the 99th percentile of the Kubelet cgroup manager operations. This query will help you understand better the duration of every Kubelet cgroup operation type.
histogram_quantile(0.99, sum(rate(kubelet_cgroup_manager_duration_seconds_bucket{instance=~".*"}[5m])) by (instance, operation_type, le))
-
kubelet_cgroup_manager_duration_seconds_count: Similar to the previous metric, this time it counts the number of destroy and update operations.
Lastly, let’s talk about the PLEG metrics provided by the Kubelet. PLEG (Pod Lifecycle Event Generator) is a module in the Kubelet responsible for adjusting the container runtime state. To achieve this task, it relies on a periodic listing to discover container changes. These metrics can be useful for you to determine whether there are errors with latencies at container runtime.
-
kubelet_pleg_relist_interval_seconds_bucket: This metric provides a histogram with the interval in seconds between relisting operations in PLEG.# HELP kubelet_pleg_relist_interval_seconds [ALPHA] Interval in seconds between relisting in PLEG. # TYPE kubelet_pleg_relist_interval_seconds histogram kubelet_pleg_relist_interval_seconds_bucket{le="0.005"} 0 kubelet_pleg_relist_interval_seconds_bucket{le="0.01"} 0 kubelet_pleg_relist_interval_seconds_bucket{le="0.025"} 0 kubelet_pleg_relist_interval_seconds_bucket{le="0.05"} 0 kubelet_pleg_relist_interval_seconds_bucket{le="0.1"} 0 kubelet_pleg_relist_interval_seconds_bucket{le="0.25"} 0 kubelet_pleg_relist_interval_seconds_bucket{le="0.5"} 0 kubelet_pleg_relist_interval_seconds_bucket{le="1"} 0 kubelet_pleg_relist_interval_seconds_bucket{le="2.5"} 10543 kubelet_pleg_relist_interval_seconds_bucket{le="5"} 10543 kubelet_pleg_relist_interval_seconds_bucket{le="10"} 10543 kubelet_pleg_relist_interval_seconds_bucket{le="+Inf"} 10543 kubelet_pleg_relist_interval_seconds_sum 10572.44356430006 kubelet_pleg_relist_interval_seconds_count 10543You can get the 99th percentile of the interval between Kubelet relisting PLEG operations.
histogram_quantile(0.99, sum(rate(kubelet_pleg_relist_interval_seconds_bucket{instance=~".*"}[5m])) by (instance, le))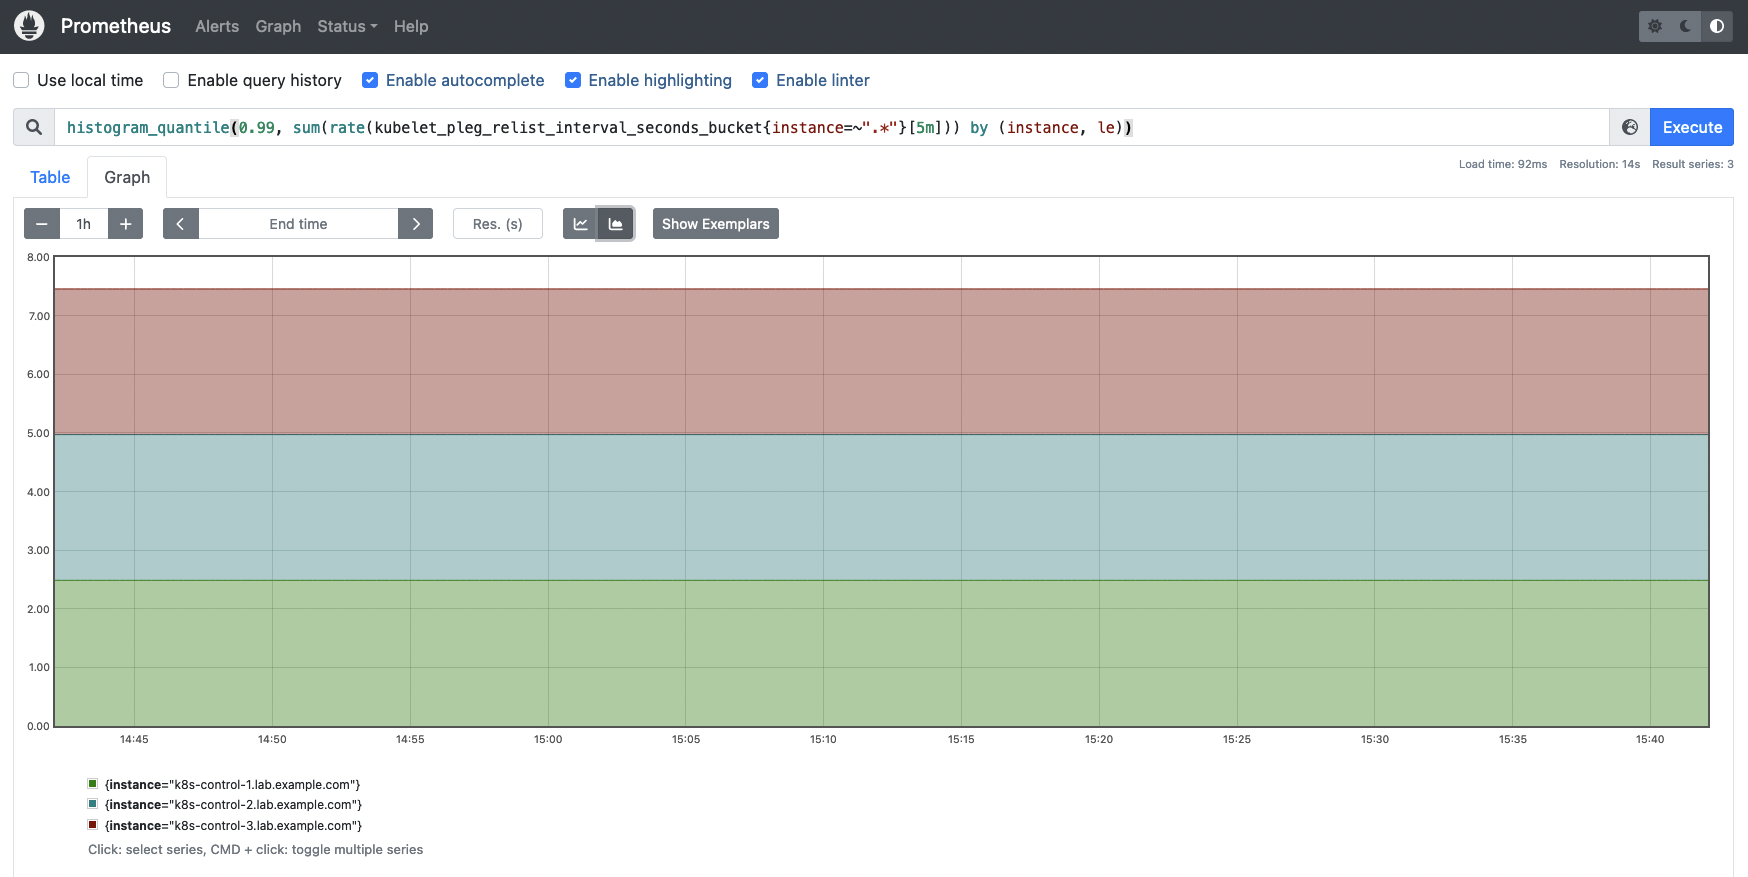
-
kubelet_pleg_relist_duration_seconds_bucket: This is the duration in seconds for relisting Pods in PLEG.# HELP kubelet_pleg_relist_duration_seconds [ALPHA] Duration in seconds for relisting pods in PLEG. # TYPE kubelet_pleg_relist_duration_seconds histogram kubelet_pleg_relist_duration_seconds_bucket{le="0.005"} 10222 kubelet_pleg_relist_duration_seconds_bucket{le="0.01"} 10491 kubelet_pleg_relist_duration_seconds_bucket{le="0.025"} 10540 kubelet_pleg_relist_duration_seconds_bucket{le="0.05"} 10543 kubelet_pleg_relist_duration_seconds_bucket{le="0.1"} 10543 kubelet_pleg_relist_duration_seconds_bucket{le="0.25"} 10544 kubelet_pleg_relist_duration_seconds_bucket{le="0.5"} 10544 kubelet_pleg_relist_duration_seconds_bucket{le="1"} 10544 kubelet_pleg_relist_duration_seconds_bucket{le="2.5"} 10544 kubelet_pleg_relist_duration_seconds_bucket{le="5"} 10544 kubelet_pleg_relist_duration_seconds_bucket{le="10"} 10544 kubelet_pleg_relist_duration_seconds_bucket{le="+Inf"} 10544 kubelet_pleg_relist_duration_seconds_sum 22.989806126000055 kubelet_pleg_relist_duration_seconds_count 10544This time let’s see how to build a histogram representing the 99th percentile of Kubelet PLEG relisting operations.
histogram_quantile(0.99, sum(rate(kubelet_pleg_relist_duration_seconds_bucket{instance=~".*"}[5m])) by (instance, le))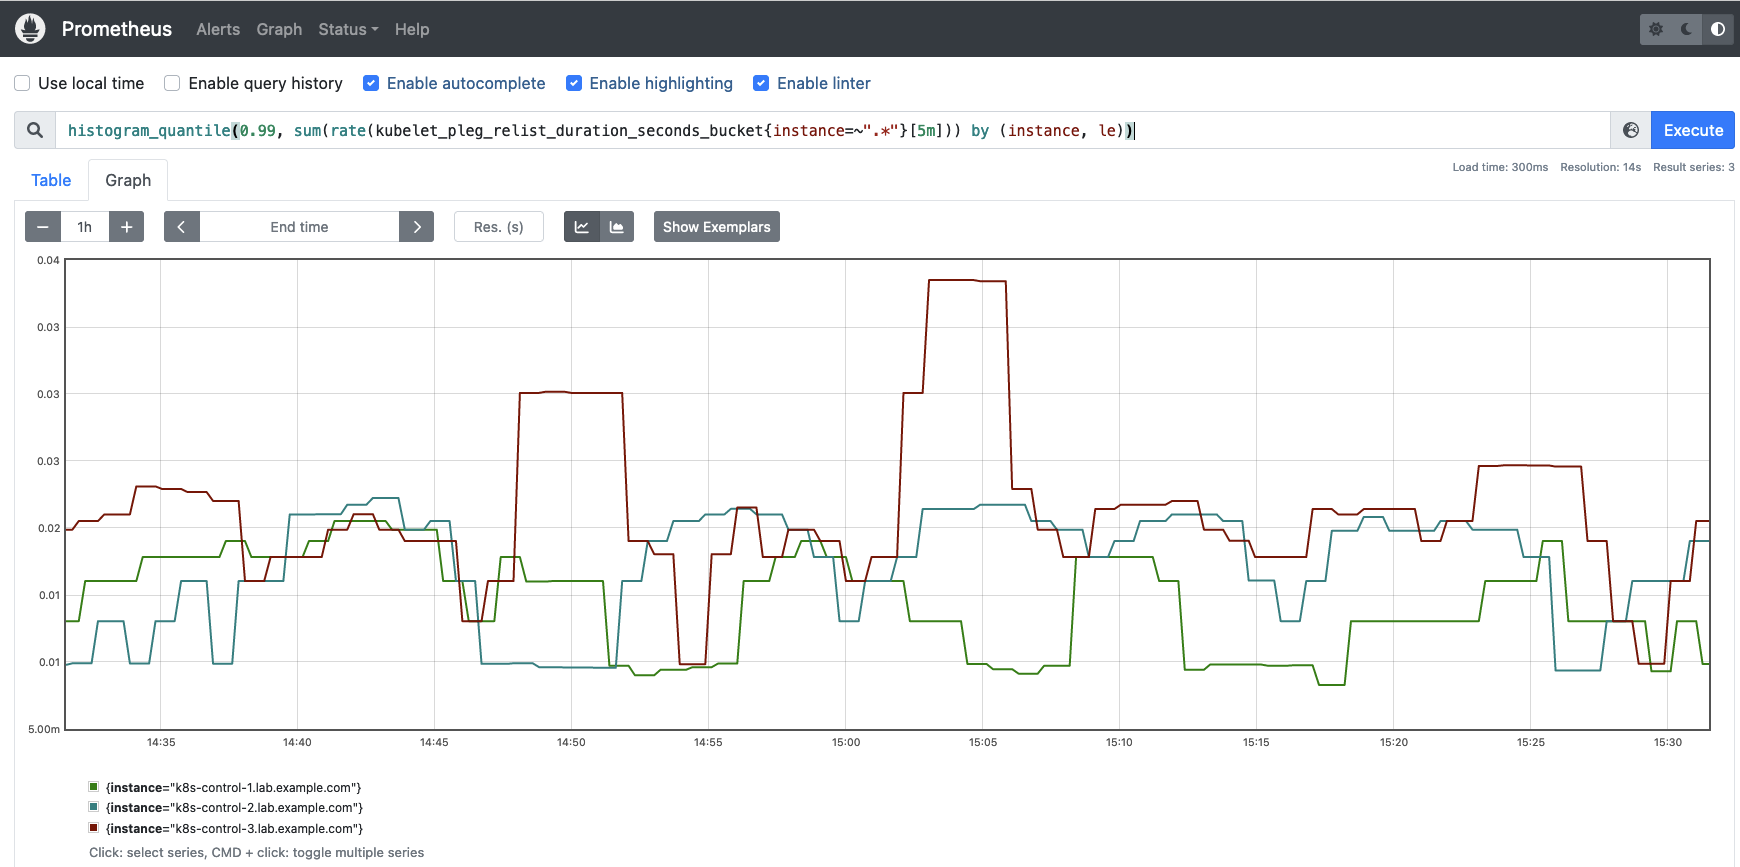
-
kubelet_pleg_relist_duration_seconds_count: The number of relisting operations in PLEG.
Conclusion
The Kubelet is a key component of Kubernetes. This element is responsible for communicating with the container runtime in every node. If the Kubelet is non responsive, has crashed, or is down for any reason, the node will go into a NotReady state, unable to start new Pods, and will fail to recreate any existing Pod if something goes wrong at the container level.
That’s why it is extremely important to understand not only what the Kubelet is and its role within Kubernetes, but how to monitor Kubelet and what the most important metrics you should check are. In this article, you have learned about both sides. Ensure you have all the mechanisms in place and be proactive to prevent any Kubelet issue now!
Monitor Kubelet and troubleshoot issues up to 10x faster
Sysdig can help you monitor and troubleshoot problems with Kubelet and other parts of the Kubernetes control plane with the out-of-the-box dashboards included in Sysdig Monitor. Advisor, a tool integrated in Sysdig Monitor, accelerates troubleshooting of your Kubernetes clusters and its workloads by up to 10x.
Sign up for a 30-day trial account and try it yourself!
The post How to Monitor the Kubelet appeared first on Sysdig.
Article Link: How to Monitor the Kubelet – Sysdig