In the first post in this series, On (Structured) Data, we talked about the gap area of offensive structured data and ended with the question, “If all of our offensive tools produced and worked with structured data, what would be possible?” The second post, Challenges In Post-Exploitation Workflows, covered several challenges we’ve encountered in past engagements such as file store mining, privilege escalation, and data protection application programming interface (DPAPI) abuse. This post will cover our solution to these challenges:

BIG NOTE: the Nemesis code we’re opening sourcing today is an alpha release! Some core parts of Nemesis including its API and data model are going to non-trivially change over the next month as we complete our 1.0.0 release. However, we wanted to get the code and ideas out there now to get some community feedback!
Introduction
So, what exactly is Nemesis? In short, Nemesis is an offensive data enrichment and analytic pipeline meant to help operators. In medium, Nemesis consists of a Kubernetes (k8s) base architecture with Docker-based microservices that perform various file/data automations and enrichments; a rigidly defined data ingestion API; Elasticsearch and PostgreSQL as semi-structured and structured data stores; a dashboard interface for operator interaction; and connectors for a number of command and control (C2) frameworks. In long, check out our Nemesis whitepaper that we’ll be publishing soon.
Our goal with Nemesis was to create a centralized data processing platform that ingests data produced during offensive security assessments, an idea we’ve been talking about for over seven years, and something we’ve been actively working on for the past twelve months. This goes beyond the existing log aggregation approaches that are out there. We’re aiming to demonstrate an approach of unifying all offensive data from a number of sources into a single processing and analytic platform.
There were a few high level goals we wanted to achieve with Nemesis:
- Automate a number of repetitive tasks operators encounter on engagements, such as the ones highlighted in the previous Challenges In Post-Exploitation Workflows post
- Empower operators’ analytic capabilities and collective knowledge, i.e., we want to scale tradecraft and knowledge for our operators
- Create structured and unstructured data stores of as much operational data as possible to help guide future research and facilitate offensive data analysis; this will help guide future data-driven efforts like machine learning/modeling approaches as well as hopefully help enable the emerging field of offensive data analysis
While “take data from tools and shove it in a database” might seem like a fairly simple task (as well as an oversimplification of what Nemesis is), Nemesis grew well beyond a single Python script as we developed it. In the rest of this post, we’ll first cover a quick(ish)start to get Nemesis up and running for anyone interested; then we will hit on some feature highlights. After that, we will dive into details of the Nemesis architecture, API, and data model and wrap up with why this approach is meaningful.
Quick(ish)start
If you want complete details, the documentation in the Nemesis project is fairly extensive; but we will demonstrate here how you can get Nemesis up and running.
Requirements
- Operating system (OS): Debian 11 LTS
- Four processors
- 16 GB RAM
- 100 GB disk
You can likely get away with two processors and eight GB RAM; however, you will need to modify how many CPUs and memory you grant to minikube, but be warned that this may cause performance issues or out of memory errors with Kubernetes. Likewise, other OS may work but the requirements are what we tested with. You will also need a valid AWS account for file storage in S3, which functions as our data lake.
Now we have the software requirements. These are detailed in the setup.md file in the repo, so I won’t reproduce them here. JUST MAKE SURE YOU FOLLOW ALL OF THEM!
Once all the prerequisites are properly installed and working, clone down the Nemesis repo with git clone https://www.github.com/SpecterOps/Nemesis. Change into the cloned directory and run ./nemesis-cli.py to start the Nemesis configuration. There are a lot of configuration values that need to be set, which can be done via flags in the nemesis-cli.py script (use -h to see them all), set in a .config file that’s passed to the CLI, or passed via command line arguments.
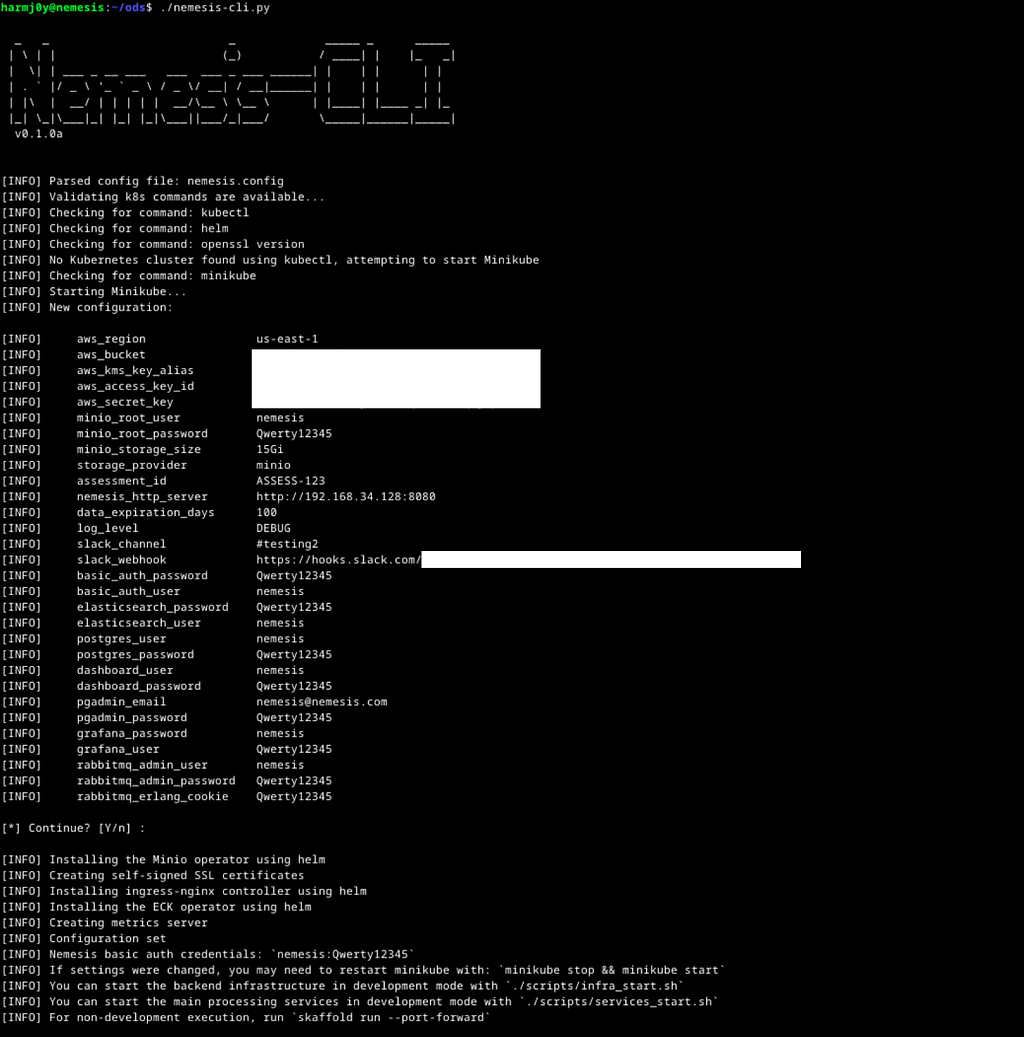 Nemesis configuration with nemesis-cli.py
The Nemesis CLI will create the necessary AWS resources (locked down S3 bucket and Key Management Service/KMS key) or Minio instance depending on the storage_provider config variable (“minio” or “s3”), set all the configuration secrets in kubectl, and install the necessary Kubernetes backend infrastructure (i.e., the metrics server, ingress controller, and elastic operator). Once configuration is done, you can start up Nemesis with skaffold run — port-forward :
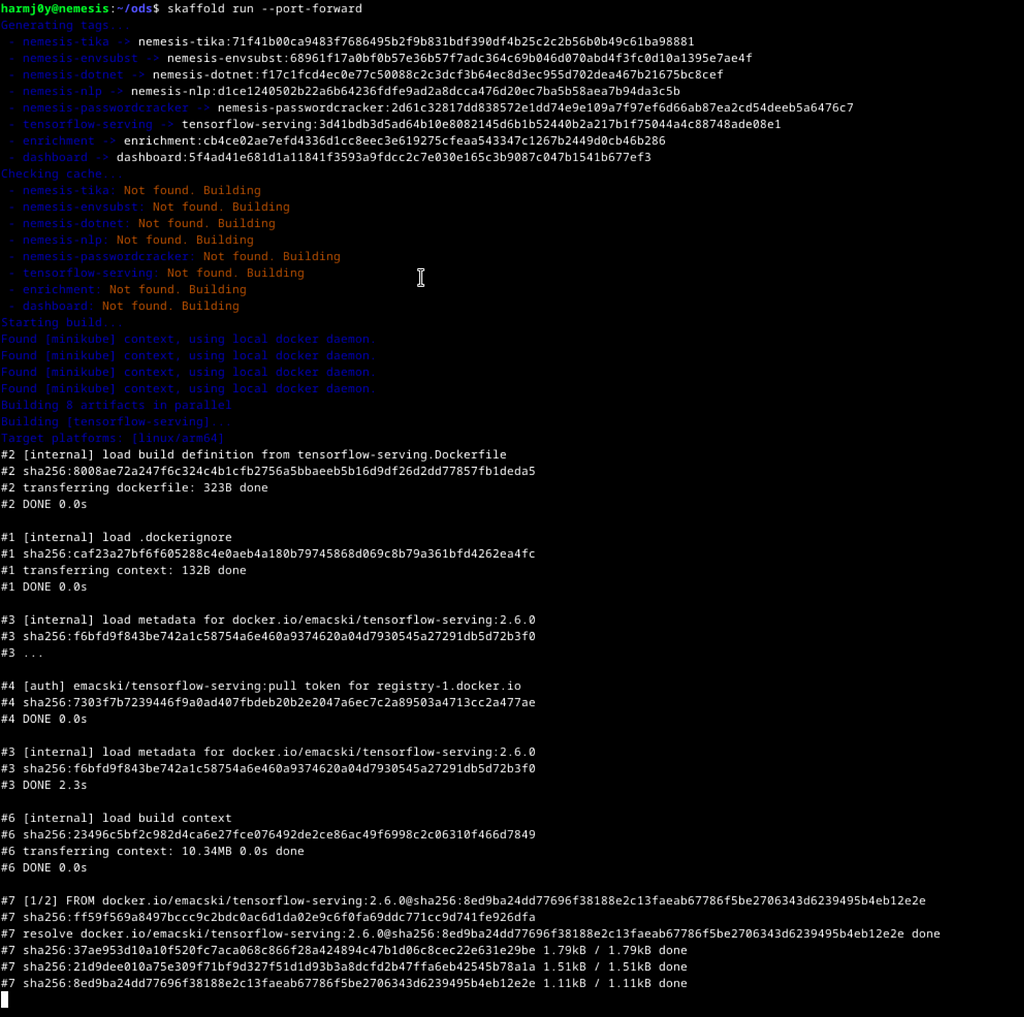 Nemesis starting up
Nemesis will take approximately ten to thirty minutes (depending on your Internet speed) to build all the local Docker containers and kick everything off. We plan to publish pre-built containers to Docker Hub to streamline the process. Once the process is complete it will look like the following:
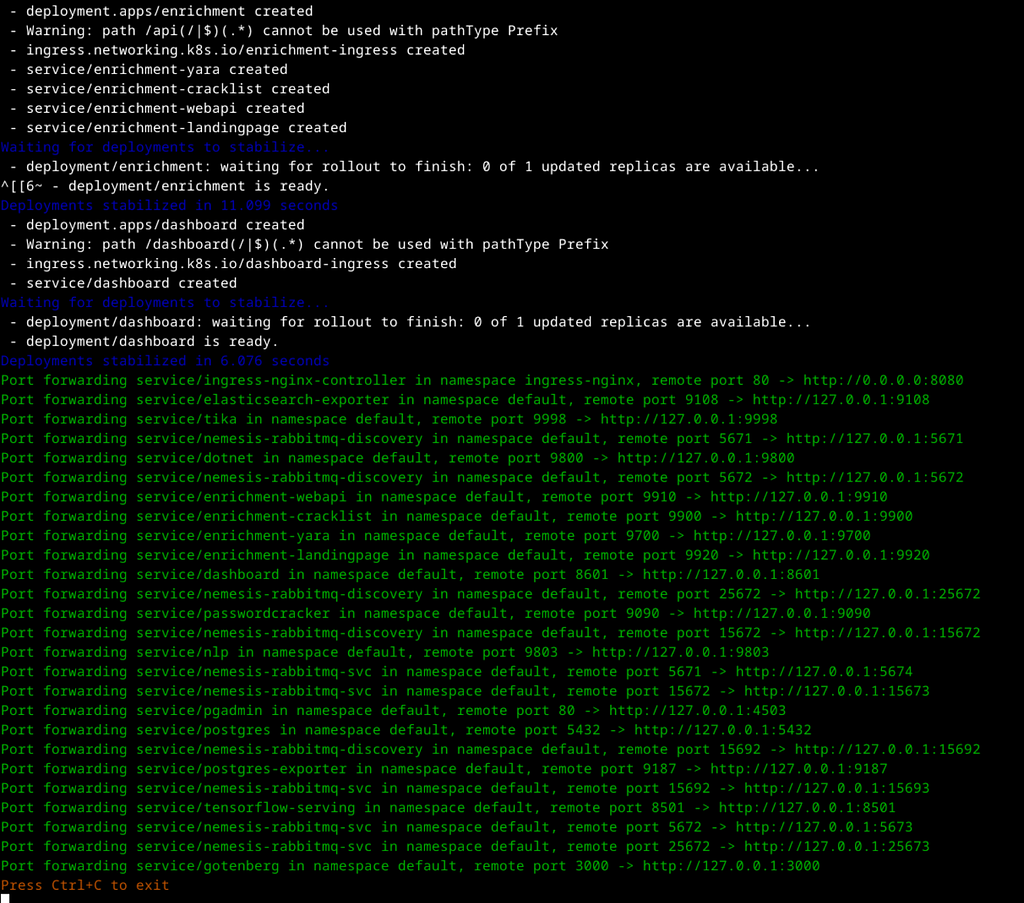 Nemesis starting up (cont)
Note: the only publicly forwarded/exposed ports are 8080 (for the Nemesis API) and 9091 (if Minio is used for storage). This can be modified in the “portForward-ingress” section of the skaffold.yaml file.

We promise you won’t have to go through this process every time! For future runs, you only need to run ./nemesis-cli.py if you make any configuration changes, and skaffold run — port-forward will rebuild the local Docker images if code changes.
Now, let’s get some data into Nemesis!
We have a decent amount of sample files in the Nemesis repo under ./sample_files/ which you can use to check out the initial processing. Running ./scripts/submit_to_nemesis.sh — folder ./sample_files/ will submit everything in the folder; you can also use this to manually submit files or folders during engagements. You can also upload files manually in the Files page of the dashboard (more on that shortly).
Note: for a bit more “real world” usage, we have connectors built for several popular C2 frameworks including Mythic, Cobalt Strike, Meterpreter/MSF, Outflank’s Stage1, and Sliver which live in the ./cmd/connectors/ folder. Each has a detailed README.md that covers how to set up the connector. We’ll cover these connectors in more detail (along with the Chrome plugin) in a future post on data collection.
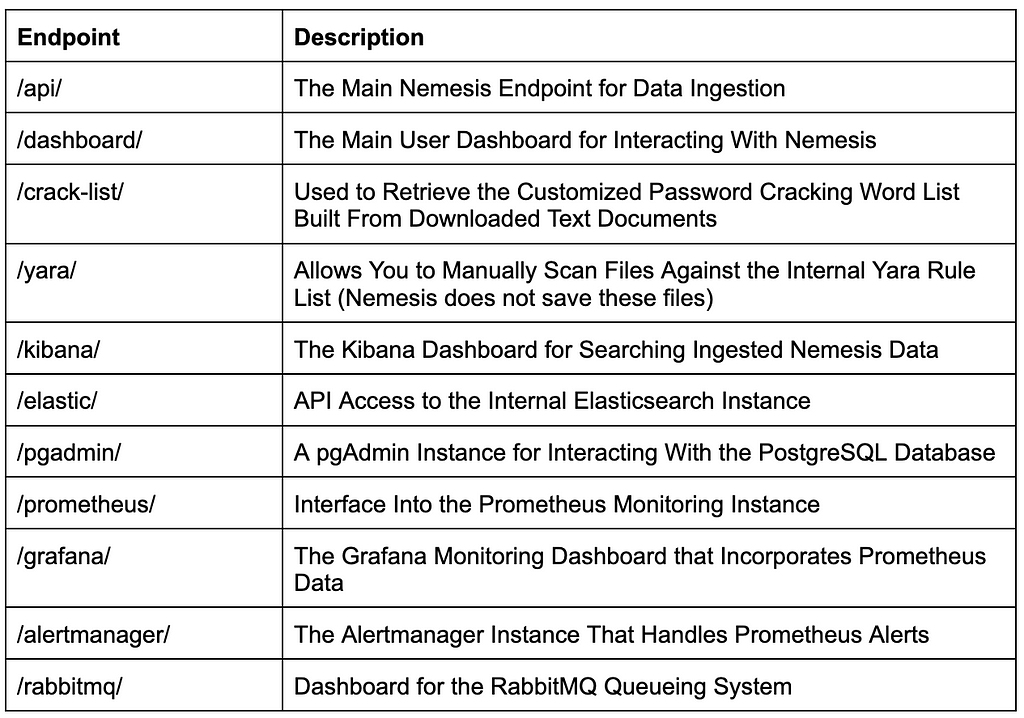
Nemesis uses a Kubernetes ingress controller to route access to exposed services through a single endpoint (instead of forwarding a port for each), so you only need to expose the port defined by X. The endpoint is also wrapped in basic authentication defined in the Nemesis config. Going to http://<NEMESIS_IP>:8080/ will show a simple landing page with all the exposed services.
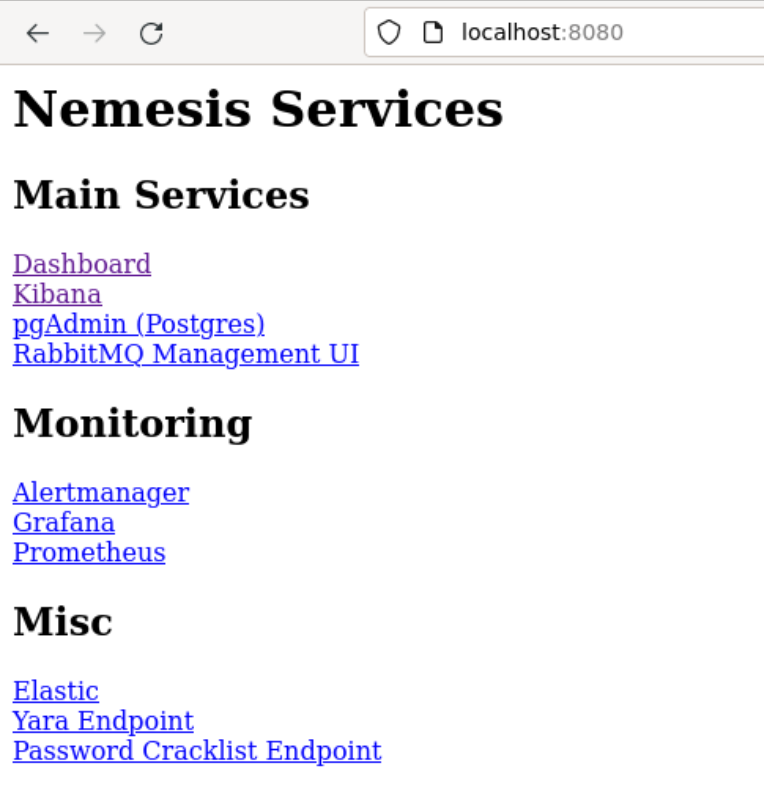 The simple Nemesis landing page.
Here is a brief overview of the services exposed by the endpoint:
 If you don’t want memes, read the whitepaper!
Let’s check out the /dashboard/ route after our data was ingested:
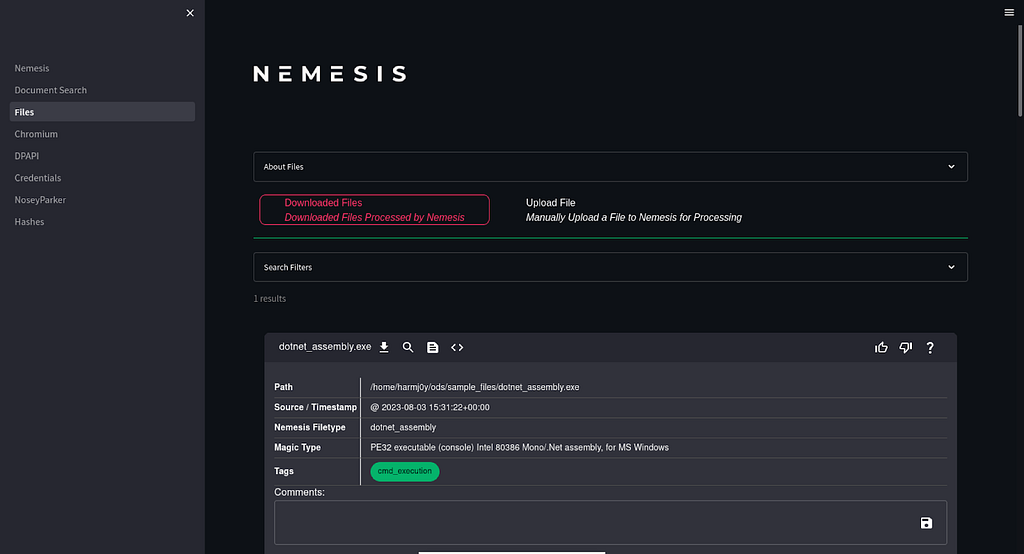 The main Nemesis dashboard.
 Hopefully you, the reader, on seeing this dashboard.
Note: the dashboard was built with Streamlit and is meant as a prototype; we areplanning to build out a revamped and more performant dashboard.
On the left, you can click through the various dashboard pages, summarized here:
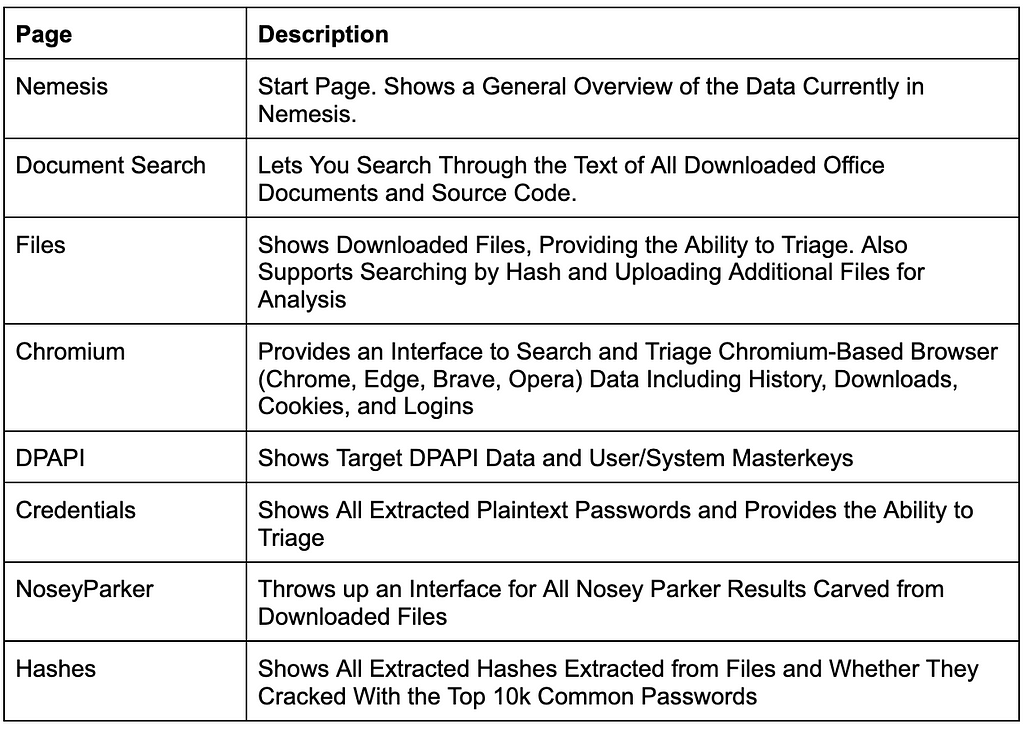
Again, this is meant as a basic demonstration. A much, much better version of the dashboard will be out later this year, but you get the idea.
Feature Highlights
OK. We just spent a chunk of time and RAM to get Nemesis up and running, but what can it actually do?
A big use case is automatic and standardized processing of downloaded files. If you use one of the C2 integrations, any file you download (along with relevant metadata) will automatically be ingested into Nemesis. Otherwise, you can manually submit files through the ./scripts/submit_to_nemesis.sh script or via the dashboard in the Files page. Some of the current things Nemesis can do with files are:
- Basic processing/metadata extraction for all files (i.e., calculating file types and hashes for every file ingested); combined with Nemesis’ focus on metadata, this allows you to tightly track exactly when, where, and how a specific file was downloaded.
- Known file types (Group Policy Preference [GPP] files, web.config files, PE files, etc.) are parsed into standard forms and any decryptable data is automatically decrypted and surfaced as authentication data.
- .NET assemblies are analyzed with a customized version of InspectAssembly; this lets us inspect the assembly’s CIL for calls to deserializers, .NET remoting usage, and command execution methods to aid in triaging potential privilege escalations.
- Office documents have metadata (like author) extracted, and are converted to a PDF with Gotenberg in an isolated container to avoid triggering any document canaries
– Nemesis also extracts any text with Apache Tika, which is indexed in Elasticsearch for ease of searching with the Nemesis dashboard; extracted plaintext is also used to build a custom cracking list for that environment, examined for any passwords, and run through an embedding model for semantic search. - Nemesis has a lot of functionality surrounding DPAPI:
– All files and registry keys are automatically checked for the presence of DPAPI blobs, and any found blobs are carved.
– DPAPI blobs, masterkeys, and domain backup keys are all linked, and can provide forward/backwards decryption of all DPAPI data. - Any History/Downloads, Cookies, Logins, and Local State files from Chromium browsers (currently Chrome, Edge, Brave, Opera) are automatically parsed and made searchable, and decrypted via DPAPI masterkey if applicable.
- Nemesis will extract out a John-the-Ripper hash for encrypted files (such as PDFs, office documents, and zips/7zs, more formats to come) and automatically try to crack the hash against the top 10k most common passwords; in the future, these hashes could be automatically submitted to a cracking rig.
- Every file is scanned with an internal Yara rule set for potential hits; this functionality is exposed as well in the Nemesis API, allowing C2 frameworks to scan files before moving them to a target host
– The Cobalt Strike connector demonstrates this for the upload and execute-assembly commands. - All non-binary files are scanned with Nosey Parker for any sensitive secrets.
 You, the reader, being excited about file processing.
But Nemesis doesn’t just ingest files, it handles a number of different types of data. There are some fairly simple data-based enrichments we can perform, like automatically categorizing processes and services against a list of known endpoint detection and response (EDR)s/etc. Beyond that, part of Nemesis’ true power is its analytic engine (which we’ll cover in depth in a future post). We are completing the base of the service that performs basic analysis of insecure Windows services; one of our goals over the next few months is to greatly expand the analysis performed by Nemesis. Our goal for the analytic engine this year includes things like:
- Providing a collective overview of a network/operation, even if the information has been gathered via multiple tools.
- Any information about the network that can be extrapolated from collected host data
- Local offline privilege escalation on collected data, i.e. “offline-PowerUp”
- Operator assistance; think “I see you’ve downloaded some Chromium files. If you retrieve this (X) specific DPAPI master key, I can decrypt those for you.”
- More ideas to come!
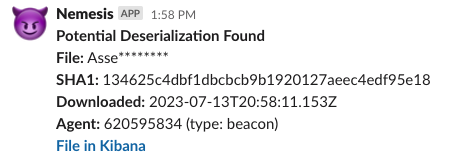
Nemesis will also automatically alert operators via Slack when certain important information is found or things happen, e.g. when a file has Nosey Parker results or a new domain DPAPI backup key is used to decrypt existing masterkeys.
Note: this section covers the main features but it is not exhaustive. Check out our soon-to-be released whitepaper for complete details! Also, we’ve had more ideas than development time, so additional features will be implemented in the coming months.
Architecture
Nemesis has a lot of moving parts. This is heavily due to some of the design requirements we placed on ourselves during our development. Specifically, we wanted something that could both run locally (for development and smaller teams) and scale in the cloud for larger teams and data sets, without being constrained to a specific cloud provider.
There’s also just a lot of small on-the-ground things that Nemesis has to do, from decompiling .NET assemblies, to converting office documents to PDFs, to cracking extracted hashes with the 10k most common passwords, etc. We realized we needed a number of non-trivial file and data processing tasks (many of which are already implemented in public Docker containers like Gotenberg or Tika), multiple databases (Elasticsearch and PostgreSQL), and a queueing system for all the pieces to talk to each other (RabbitMQ). This pushed us towards a containerized approach, and the scaling requirements led us to something that will probably make a few people shutter:
 We promise we’re not going to explain Kubernetes itself.
We developed Nemesis on minikube (a tool to run local Kubernetes clusters) with Skaffold for deployment, meaning anyone with a decently specced system (multicore, 8–12 GB RAM) can run Nemesis locally. And since it’s k8s, we can also deploy a Nemesis instance to a cloud provider and scale resources to our hearts’ content. While some might view this approach as overkill (and maybe some are right?) we felt that this was the best balance for the local/cloud deployment scenarios we wanted to support.
Peeking inside our Nemesis cluster, we can see everything it contains:
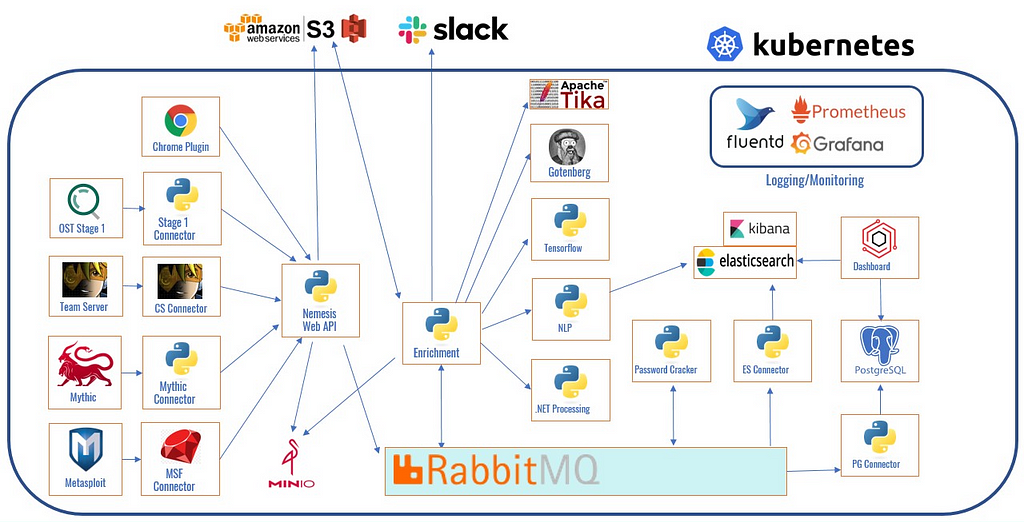 Nemesis architecture.
Data and files are posted to the Nemesis web API (see the API and Data Model section in this post for more details on the API definition) which transforms the posted data into a protocol buffer, aka a protobuf. We use protobufs to rigidly control Nemesis’ internal data schema and to keep communications between containers consistent. This protobuf representation is then published to its topical queue in the internal queueing system, which we use RabbitMQ for. The original implementation was in Kafka, which does give a nice replay capability, but we found Kafka a bit too heavy for our usage. In general, we also just hit a lot of Kafka issues, so we opted to go with the lighter weight RabbitMQ.
Once a piece of data is published to a RabbitMQ queue (try saying that three times fast), any internal enrichment container or service can consume that topic, perform enrichments, and republish the topic to the queue. The main container that interfaces with the other services is called enrichment, which contains a large number of services that each subscribe to different queues. Nemesis actually runs multiple instances of this container with flags to run specific sets of services; this allows us to prevent specific functionality (like password cracking) from DoS’ing other enrichments. A future post will cover all of these enrichments in depth and how they work.
Sidenote: during enrichment, services can publish messages to an alert queue a separate alerting service consumes, which allows for alerting to Slack. For example, if an ingested DPAPI domain backup key is used to decrypt existing master keys; if passwords are carved from files; or if a .NET assembly may be vulnerable to deserialization; we can receive a real-time Slack alert with basic contextual information.
Once enrichments complete, the data is republished to the queue and finally pushed into both Elasticsearch (in semi-structured form) and PostgreSQL (in a highly-structured form). Elasticsearch allows for easy free form searches of our collected data, while PostgreSQL forces our data into the rigidly defined structure we need for complex data correlation and analytics. We’ll talk more about our analytic engine in a future post.
Finally, our front end dashboard gives operators that chance to actually use all of these collected, enriched, and structured data. Results from a lot of the use cases from the Feature Highlights section are accessible here.
 Our data has come a long way.
We know it’s a lot of steps, but, fortunately, you don’t need to know how all the pieces work. All an application needs to do to integrate with Nemesis is post data in a specific form to an exposed API and all an operator needs to know are the links for the Nemesis and Kibana dashboards.
Also, surprise: lots of steps and lots of pieces means lots of things can go wrong! Since we were new to k8s development, we got to learn the hard way how much fun debugging a complex enrichment pipeline can be. To help facilitate this, we spent the time to build our several things to help troubleshoot Nemesis.
To start, all Nemesis containers (especially the enrichment container that does most of the heavy lifting) shoot their stdout logs into the Elasticsearch fluentd-* index via Fluentd. This makes searching container logs and output much easier than watching scrolling output:
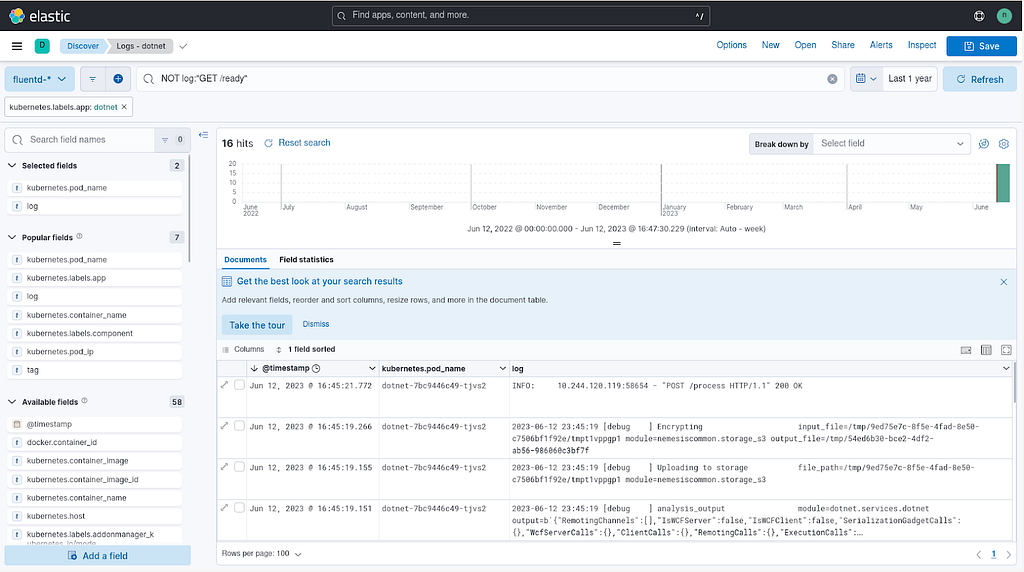 Nemesis Fluentd logs displayed in Kibana.
There are also a lot of things that can go wrong with Kubernetes containers, from out of memory errors to file systems filling up. While Kubernetes in general will tear down and redeploy containers under some circumstances, not all error scenarios will result in a healthy redeployment. To help with these situations, we implemented heavy Prometheus logging throughout the entire cluster, giving us raw monitoring statistics at the fabric, container, and application layers. The Prometheus endpoints are combined with Alertmanager for (you’ll never guess!) alerting on specific situations, and Grafana for monitoring dashboards.
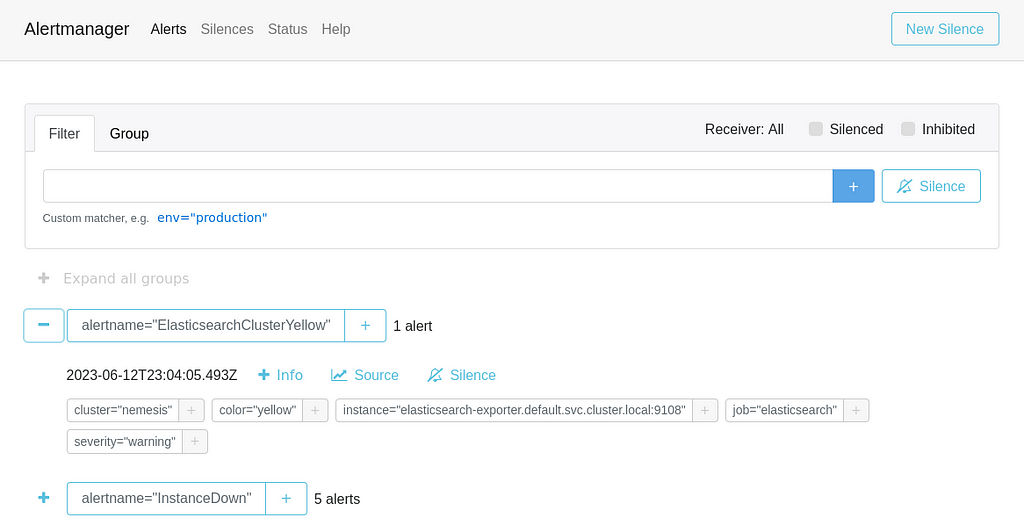 Nemesis Alertmanager interface.
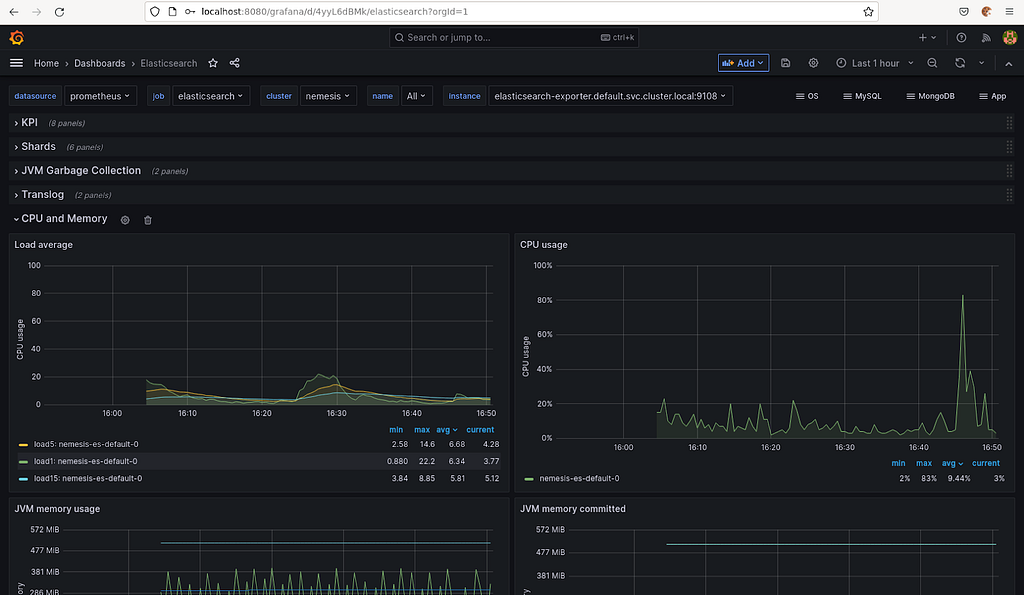 Nemesis Grafana monitoring dashboard.
That said, this isn’t all perfect; the alerts and Grafana deployments will specifically need to be modified as time goes on, but we feel confident that we’ve laid a good foundation that we can build on.
API and Data Model
Note: as we mentioned in the introduction, the Nemesis API and data model are going to change as we complete the 1.0.0 release.
Data has to enter Nemesis through the API. This API and its data definition is the contract we’re offering about exactly what data we support and how it needs to look. We may not be lawyers, but we take our contracts very very seriously.

Before we get into the types of data that Nemesis ingests, we need to talk about Nemesis’ obsession with metadata. Every post to the API endpoint must include a metadata field and then one or more data type entries. The metadata field looks like:
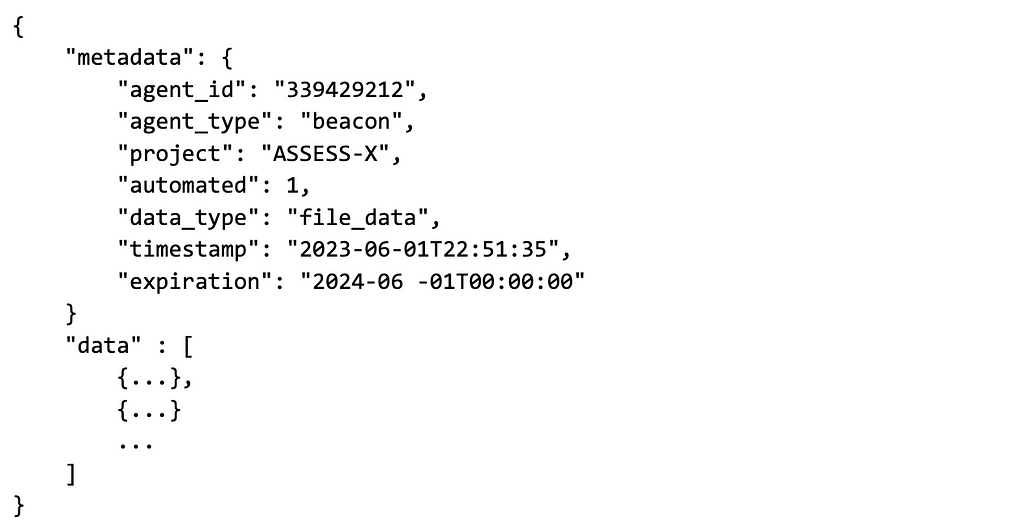
Here’s a brief explanation of each metadata field:
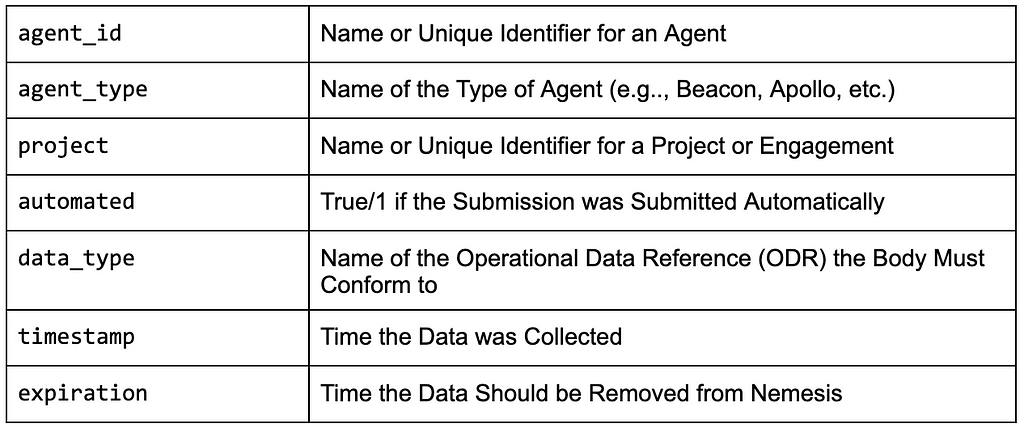
We spent a LOT of time discussing how the front end API data model needs to look and the fields included in the metadata are a direct result of that. This format means that every single piece of data in Nemesis is tagged with these metadata fields, letting us easily track everything back to its origin. The expiration field also means we can effortlessly implement our data retention policies and wipe sensitive assessment data after a certain period of time. We plan to build a housekeeping service in Nemesis that will periodically purge any data that is past its dedicated expiration date.
Now onto the main event: the data that Nemesis can ingest, the ODR! Since the documents in Nemesis break down each data type in detail along with required fields, I’m just going to give a brief overview of each data type.
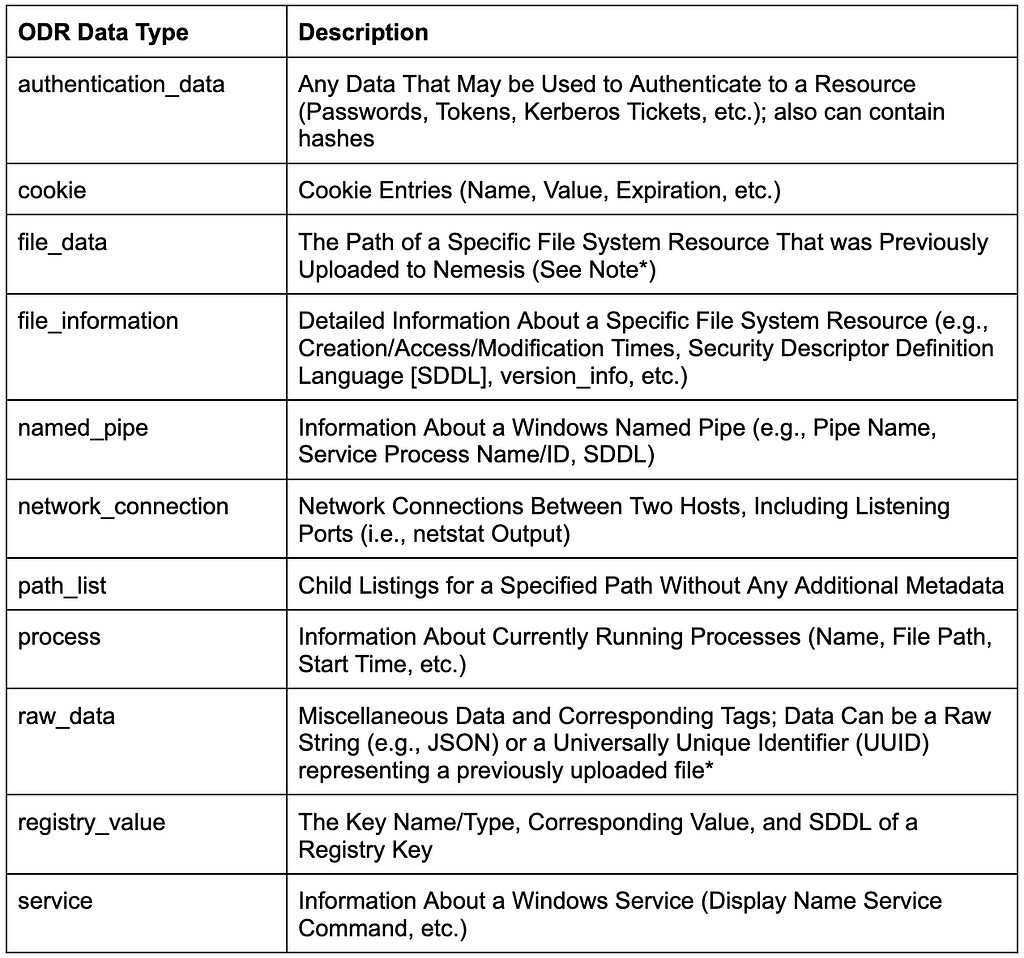
*Note: for file analysis, a file’s binary data must first be updated to the <NEMESIS>/api/file endpoint which encrypts the file and it to the backend data lake (currently S3), returning a UUID that’s then used in additional data messages like file_data.
“But what if I want to include something that’s not in that list? Am I out of luck?” Don’t worry! The raw_data type listed above is for just such occasions; it takes a file upload and an array of one or text tags. The enrichment container has a “raw_data” processing service that can manually process these files; current examples are structured DPAPI domain backup keys and Seatbelt JSON files. However, this should be considered volatile versus the main API definition. While the API will change rarely, the raw_data processing can (and likely will) change frequently, so users beware. It does, however, give you the ability to easily process custom data without the modifications to Nemesis that a new API data type requires.
From this fairly simple set of data types, Nemesis builds a fairly complex internal data model. The file containing our internal protobuf definitions is already 1500+ lines and growing and our Postgres schema is fairly extensive as well. Examples of abstractions Nemesis models the following after processing are:
- File system objects
- Registry entries
- Windows services
- DPAPI data (blobs, master keys, domain backup keys)
- Chromium data (history, downloads, cookies, logins, state files)
- Hashes extracted from files
- Authentication data extracted from files
- Host data
- Agent data
- And More!
Obviously the ODR is going to grow over the next year(s) as we expand Nemesis to handle more types of data. We already have additional types planned like network connections and routes, but we want to be fairly conservative in expanding the front end API types.
Why This Matters
Several people we’ve talked to about Nemesis have been excited about the automation capabilities. There are a lot of repetitive, monotonous tasks in offensive operations and being able to automate some of those workflows not only helps save operators’ sanity, but it helps bring consistency to engagements with fewer missed details.
This approach also makes it very easy to transparently add or update tools into the workflow of ALL operators. We can push a new file enrichment or update a tool to a Nemesis deployment and Kubernetes will autOmAgiCaLlY redeploy anything as needed. There’s also an additive nature to this approach: every additional enrichment or analytic added exists in perpetuity for ALL operators on ALL operations!
But this isn’t just what Nemesis currently does; it’s what this approach allows us to do. We believe this could be a paradigm shift for red teams towards offensive data unification and off-host data processing.
We argued in the Challenges In Post-Exploitation Workflows post that we should continue to move towards an approach of collecting data from hosts in a raw, unprocessed/semi-processed form and process it off the target host. Nemesis is why. Not only can we increasingly move away from some of the complications that lead to “language-hopping” (i.e., PowerUp to SharpUp, BOF-Up, anyone?) but collecting raw data and processing it offline means we can retroactively analyze things as new enrichments/analytics are added as well as searching historic data from an analysis standpoint. That is, as we add additional enrichments and analytics, not only are we taking advantage of these new features for all newly collected data, but we can reprocess existing data as well!
An example we mentioned in the On (Structured) Data post is that tools like PowerUp would calculate and return privilege escalation opportunities, but wouldn’t return all the data it collected. This made sense at the time, as we didn’t want to drown operators in data that could be fairly time consuming to manually process, but this comes with a big disadvantage: we’re essentially compressing the data and losing information. Specifically, if there are additional attacks discovered in the future that could be derived from the raw data, we lose the ability to run that future analysis. With Nemesis’ approach, this is no longer an issue.
Another big advantage is that we can exploit the relationships between disparate pieces of operational data, even if things are collected via different tools or C2s. All of the host-based data that comprises the privilege escalation analytic can be derived from different sources: Seatbelt, the BOF registry collection, Meterpreter post-ex module, manual submission, etc. As Nemesis ingests more and more types of data that we can massage into known and structured forms, the more links we are going to be able to build as we construct an increasingly rich model of a target host and network.
And finally, there’s what we don’t even know yet that this approach can (hopefully) facilitate. This is one of the big reasons we retain data in a semi-structured form in Elasticsearch: we want to enable operators to perform offensive data analysis beyond what Nemesis currently provides. We don’t yet know exactly what this will look like, but if we can mimic the defensive industry we’re certain that there will be a lot of value to come from this approach.
Conclusion
We know that Nemesis is more complicated than running a Python script, but in our defense, Nemesis does a lot of stuff! We will also fully admit that a lot of things Nemesis does are not unique, nor is its approach necessarily revolutionary. Data enrichment pipelines exist in various industries, but no one has applied this approach to the specific post-exploitation problem set we’ve covered here. A lot of blood, sweat, and commits have gone into Nemesis, and we’re happy to finally unveil it to the world!
The code is all open-source and now public on GitHub and our accompanying whitepaper will be up soon on the SpecterOps site. Future posts and documentation will cover data collection, file/date enrichments/automations, and the analytic engine in more depth, as well as how Nemesis can be deployed to a cloud-based Kubernetes cluster and scaled based on need.
Hacking With Your Nemesis was originally published in Posts By SpecterOps Team Members on Medium, where people are continuing the conversation by highlighting and responding to this story.