Introduction and context
While working with geospatial data, many a times we encounter cases where we need to determine the optimal route between a start and end point (latitude and longitude). For example, while trying to understand where to open a new restaurant on a highway or which fuel station will serve most routes, we need to understand the most travelled routes between big cities. While in many use cases, only the drive distance between a set of points is needed, at times we require the details of the entire route with the ability to plot them on the map. This can be done using available Map APIs however those are usually not free. We have open source libraries in python that serve the same purpose like NetworkX and OSMnx, but as the distance between source and destination increases or we move across state / country boundaries, the API tends to take a very long time or crash. Here we propose an open source solution that can give route details even over long distances by combining the capabilities of these two APIs — OSRM (Open Source Routing Machine) & Open Street Map.
About the API
- OSRM (Open Source Routing Machine): It’s an engine for shortest path in road networks. It returns geo nodes which then feeds into Open Street Maps API that returns latitude and longitudes of the points on the route. In OpenStreetMap, a geo node is the fundamental object type carrying geographic positions.
 API format
Various services like route, table etc. can be used to output either the shortest route or travel time. In case multiple paths exist between the coordinates, alternative option returns those as well. We will be using route service for our use case. Profile can be used for customising the mode of transportation to either car, bike or foot. Coordinates lets you add comma separated longitudes, latitudes for source and destination. Format of the output could either be json or flatbuffers.
2. Open Street Map: It is an open and free geographic database. API can be used to convert the node (output from OSRM API ) to coordinates. These are generally 100 meters apart. Based on our use case we can optimise the API call by selecting every nth (in our case 4th) coordinate to improve the performance of our API. Once we have the list of latitudes longitudes of the route, we can leverage it for either visualisation on the map or calculating distance to nearest fuel station, restaurant etc.
Use Case
A big retail unit is looking to lease out available space to a restaurant chain ( or fuel site). It tries to find best potential site for the new joint from a given set of locations. The goal is to pick a location that is close to mahir routes, being able to attract a larger customer share.
In this article we are looking at the following major routes in US. The goal is to identify the best possible locations that serve these routes.
· New York city to Knoxville
· Provo to Ogden to Park City
·. Minneapolis to Milwaukee to Chicago
We will be plotting the potential locations along with the given routes (extracted from OSRM and Open Street Map APIs) on a map and will be picking the best locations.
Note — This is a hypothetical use case to show the capability. Similar framework can be leveraged across various use cases involving spatial data.
Implementation in Python
The code below extracts the coordinates for the first route (New York City to Knoxville). Other routes can be extracted in a similar manner
Step 1
Importing the required libraries
import numpy as np
import pandas as pd

import requests
import xml.etree.ElementTree as ET
from tqdm import tqdm

# Plotting
import plotly.express as px
Step 2
Here we specify the latitude and longitude of the source and destination points.
# Specify the coordinated (longitude, latitude) of origin and destination
# first parameter is longitude, second parameter is latitude

source = (-83.920699, 35.96061) # Knoxville
dest  = (-73.973846, 40.71742)  # New York City
Step 3
Get geo nodes (in OpenStreetMap, a geo node is the fundamental object type carrying geographic positions) for the given source and destination points. For this we use an open source API. The API returns a json file with a set of all geo coordinates referred as nodes for the route. The API also works when we have more than two points. The API is pretty quick and we get the response within a couple of seconds.
start = "{},{}".format(source[0], source[1])
end = "{},{}".format(dest[0], dest[1])
# Service - 'route', mode of transportation - 'driving', without alternatives
url = 'http://router.project-osrm.org/route/v1/driving/{};{}?alternatives=false&annotations=nodes'.format(start, end)


headers = { 'Content-type': 'application/json'}
r = requests.get(url, headers = headers)
print("Calling API ...:", r.status_code) # Status Code 200 is success


routejson = r.json()
route_nodes = routejson['routes'][0]['legs'][0]['annotation']['nodes']
Step 4
Converting the nodes from the previous API to latitude and longitude. These nodes are generally very close to each other (0.1 miles apart). Depending on the use case and precision of the route required, we can consider only every nth point. For example, we can consider every second point. This helps us in reducing the response time of the second API as fewer nodes need to be converted to latitude and longitude. This API is slow and might take some time especially for bigger routes. We tested the API for a route of 6000 miles and results were obtained within 30 minutes.
### keeping every third element in the node list to optimise time
route_list = []
for i in range(0, len(route_nodes)):
    if i % 3==1:
        route_list.append(route_nodes[i])

coordinates = []

for node in tqdm(route_list):
    try:
        url = 'https://api.openstreetmap.org/api/0.6/node/' + str(node)
        r = requests.get(url, headers = headers)
        myroot = ET.fromstring(r.text)
        for child in myroot:
            lat, long = child.attrib['lat'], child.attrib['lon']
        coordinates.append((lat, long))
    except:
        continue
print(coordinates[:10])
Step 5
Now that we have the list of coordinates for the entire route, we will put them in a dataframe and try to visualise the same on a map. For mapping, we are using Plotly library from python.
df_out = pd.DataFrame({'Node': np.arange(len(coordinates))})
df_out['coordinates'] = coordinates
df_out[['lat', 'long']] = pd.DataFrame(df_out['coordinates'].tolist(),

# Converting Latitude and Longitude into float
df_out['lat'] = df_out['lat'].astype(float)
df_out['long'] = df_out['long'].astype(float)

# Plotting the coordinates on map
color_scale = [(0, 'red'), (1,'green')]
fig = px.scatter_mapbox(df_out,
                        lat="lat",
                        lon="long",
                        zoom=8,
                        height=600,
                        width=900)


fig.update_layout(mapbox_style="open-street-map")
fig.update_layout(margin={"r":0,"t":0,"l":0,"b":0})
fig.show()
Results
Below is the graph obtained after plotting coordinates using plotly. We have also marked potential spots for restaurant near this route. Since location B seems to be most accessible to the commuters between New York and Knoxville; it is the best choice among the options.
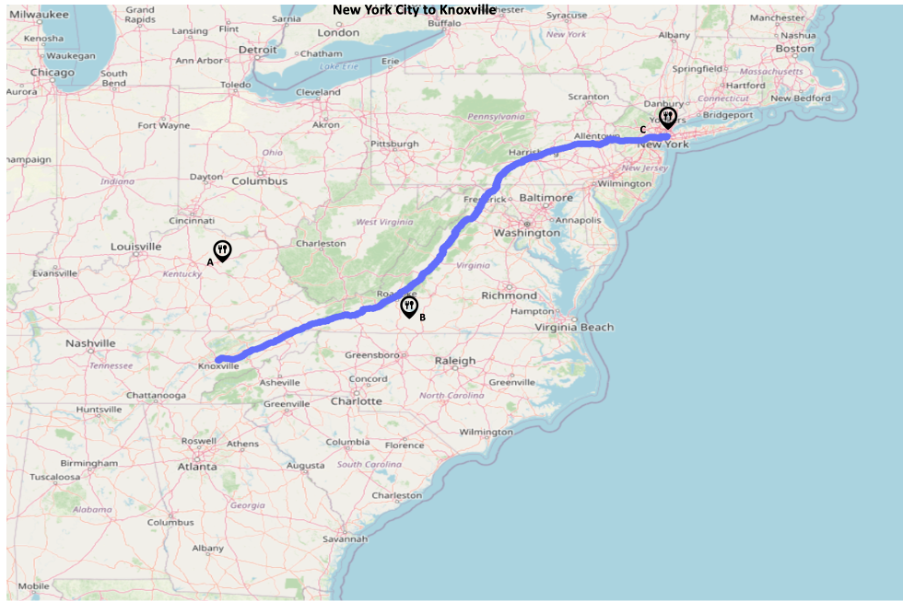 New York City — Knoxville
Provo to Ogden to Park City
This example consists of multiple points A, B & C. Location B & C seems to be more relevant compared to A. In context to our earlier use case, the retail chain might prefer to set up the new joints at B or C as it is closer to the route, especially B as it can serve multiple portions of the route.
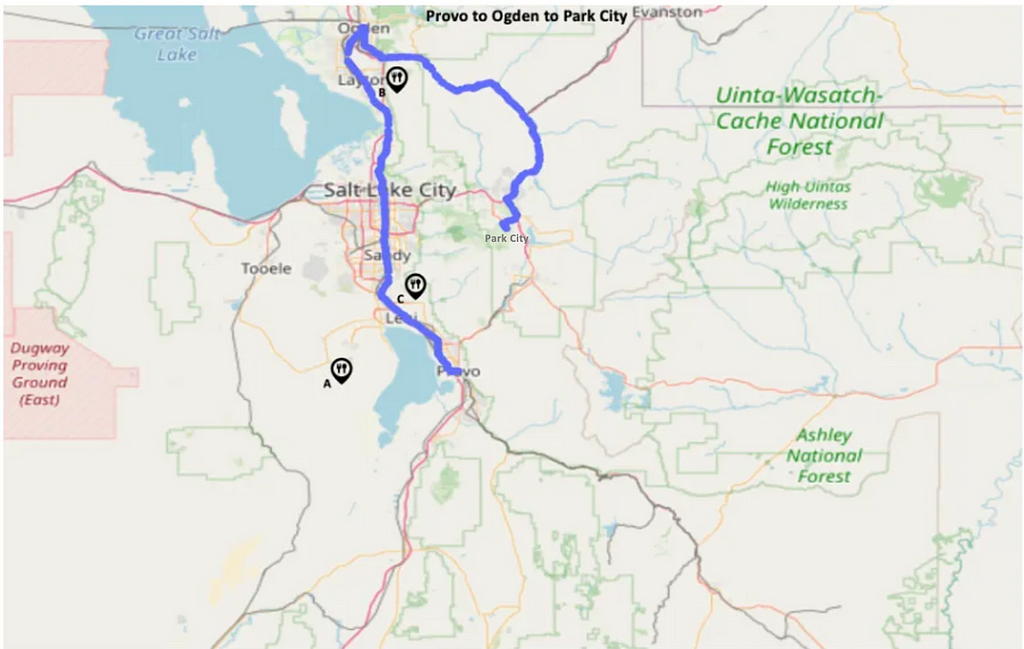 Provo to Ogden to Park City
Minneapolis to Milwaukee to Chicago
Location B & C seems to be more relevant compared to A & D.
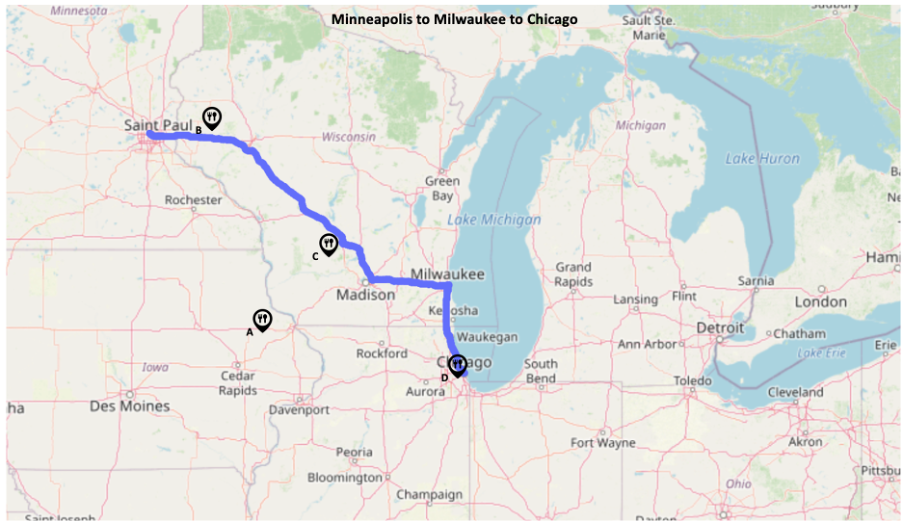 Minneapolis — Milwaukee — Chicago
Closing Remarks
While there are many Map APIs that can perform the above functionality within seconds, most of these are paid. The combination of the above two APIs do a good job of providing the route details even over long distances. Especially when we are looking for a one time dump of the route details. The APIs can be customised to cater to the use case by letting the user play with options like multiple destinations, vehicle mode, shortest time vs shortest route etc. The APIs are not specific for a particular country and do a decent job across borders. We can optimise the second API to improve the performance depending on the use case we are trying to solve.
Written by
- Mandeep Singh (Mandeep Singh)— Data Scientist — Walmart Global Tech
- Kartikeya Gupta (Kartikeya Gupta)- Data Scientist — Walmart Global Tech
References
- https://plotly.com/python/scattermapbox/
- https://thomasafink.medium.com/plotting-the-optimal-route-for-data-scientists-in-python-using-the-dijkstra-algorithm-14e3e9383a0a
- https://towardsdatascience.com/find-and-plot-your-optimal-path-using-plotly-and-networkx-in-python-17e75387b873
- API 1 — http://project-osrm.org/docs/v5.24.0/api/#requests
- API 2 — https://www.openstreetmap.org/copyright
Finding and plotting optimal route using Open Source API in Python was originally published in Walmart Global Tech Blog on Medium, where people are continuing the conversation by highlighting and responding to this story.