Empowering Deeper A/B Test Insights at Walmart through Self-Serve Custom Metrics for Experimentation
Recently, Walmart unveiled an enhanced customer experience on its Homepage, featuring a complete redesign of the page layout and strategically placed product tiles. Walmart’s in-house Experimentation Platform enabled the Homepage Product and Analytics teams to make an informed decision on the impact of the experiment and plan for the eventual release of the revamped experience to all of Walmart’s customers.
However, with such a radical redesign, existing components and sections of the Homepage that would otherwise be present above-the-fold, and be visible to everyone landing on the page, might get reordered and moved to a position below-the-fold. Since these components would require customers to perform the additional step of scrolling down; teams owning these numerous components wanted to understand the impact of their updated positions and evaluate how customers were interacting with them.
The aforementioned experiment is just one example where tangential teams and product owners might want to analyze the impact of an experiment on a very specific interaction and/or component of the entire experience. With a site as big as Walmart.com, we are potentially looking at uncountable number of current and future experiences and interactions. In this article, we will talk about how we tackled this problem statement at Walmart and enhanced our experimentation platform by introducing self-serve custom metrics.
Introduction
Experimentation (A/B Testing) is a critical piece in the development cycle of any product. Companies, including Walmart, spend considerable resources to provide their customers with the best experience and most useful suite of features. Every change to Walmart’s site moves the needle across numerous metric classes and each such interaction might guide business decisions. For our discussion, we will focus on two such classes, Operational and Transactional metrics. To serve such experimentation needs and enable quick setup of experiments, we created our own centralized self-serve experimentation platform, Expo
Expo’s core data pipeline scans and tags multiple data streams with their corresponding experiment exposure information; Experiment Identifier, Variation Specs, Trigger Conditions.
We process —
- Clickstream Data — Customer interactions across devices and browsers
- Transactional Data — Walmart order-related data coming from Order Management and Point of Sale systems
- Ads Data — Ad views and clicks across the site and related customer interactions
- Customer Contact Data — Customer interaction with Walmart Help Center
The intricate stitching of the above data streams with experiment exposure information generates a set of core metrics that are calculated for all experiments that are launched through Expo. The end-result is a comprehensive dashboard that enables experiment owners to make informed decisions around various targeted changes and understand the impact of innovative solutions.
The Bottleneck
Walmart’s online landscape needs to evolve constantly to better serve its customers and drive positive business growth. As the site evolves, Expo must also evolve to better support the varied experimentation requirements. The core metrics, which were once enough to gauge the success or failure of an experiment, evolving experimentation hypothesis demand the inclusion of additional and more tailored metrics.
When the goal is to run hundreds of experiments in parallel, a self-serve product must be created to enable experiment owners to generate the required additional metrics that work best for the experiment in question.
The Solution — Expo UCM (User Custom Metrics)
Expo UCM is a self-serve platform that enables the creation, configuration and experiment linkage of user defined custom metrics.
In designing our solution, we decided to keep the core metrics and custom metrics separate from one another in terms of data processing. We believe that the core metrics are more stable and since they serve all experiments on Expo, they need the alignment of a much larger number of stakeholders in the event any changes and/or additions are needed. Integrating UCMs with the core pipeline would result in a codebase that gets more frequently updated to cater to evolving nature of experiment tailored metrics.
Additionally, to fully support custom metrics, a self-serve solution should be implemented as a BYOD (Bring-your-own-dataset) model; capable of reading data from any dataset in the Walmart ecosystem and generate the required metrics on top of it. Expo UCM is designed to run in-parallel with the core experimentation engine and serve as a plug-n-play solution.
With a minimalistic interface, Expo UCM offers a quick and easy way to create any number of customized metrics and link them to any experiment; thereby allowing experiment owners and analysts to view the impact of an experiment through any facet that best suits their experimentation needs.
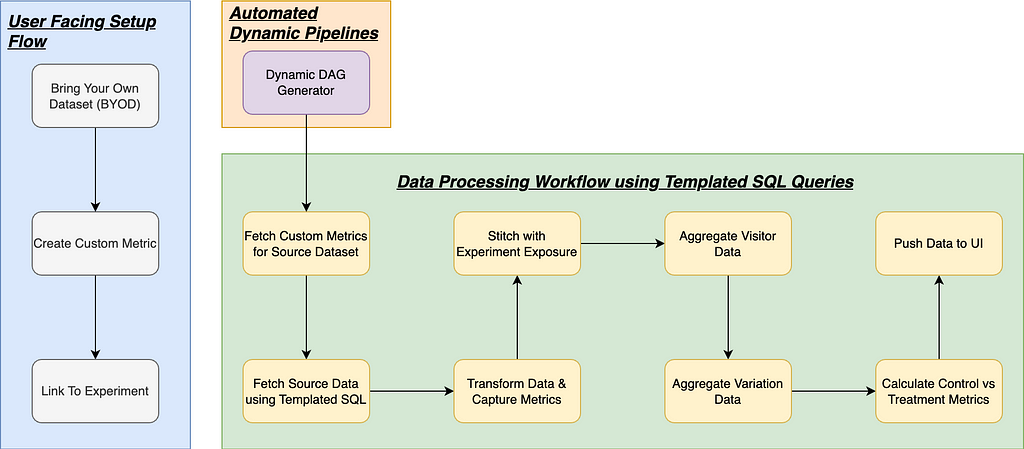
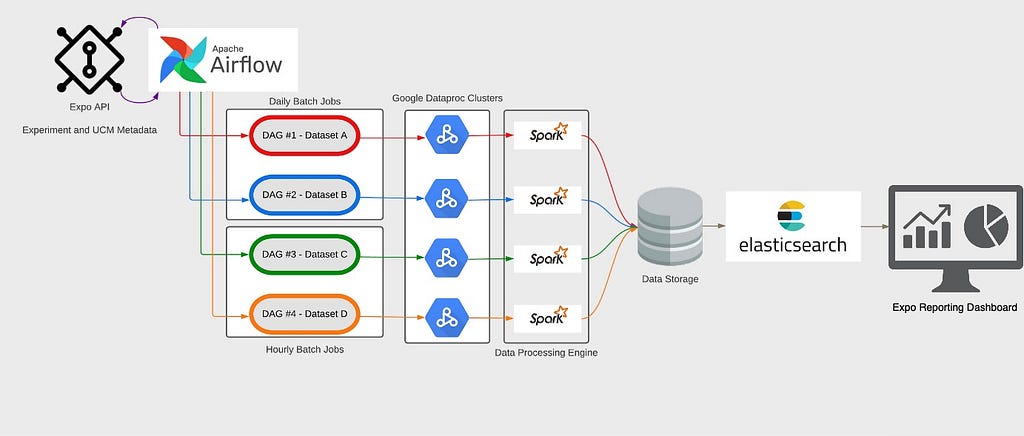 Illustration of Expo UCM Feature Integration
Expo UCM imposes no limit on the number of metrics that can be created and/or linked to experiments. Users can create an unrestricted number of metrics depending on their experimentation needs.
 Everyone Gets A Metric
Let’s look under the hood to better understand how Expo UCM operates and requires minimal user intervention.
BYOD (Bring-your-own-dataset)
Across business functions, teams might maintain their own datasets which are filtered for their domain. Enabling the UCM engine to leverage external datasets provides a few advantages:
- The domain specific logic behind the datasets continues to sit with the analytics team. This eliminates the need to update the UCM engine whenever a source dataset changes.
- External aggregated datasets eliminate the need to re-process the business logic to extract the required data.
- Keeps the metric calculation logic simple and easy to understand.
Datasets that meet the eligibility criteria could be integrated with the UCM engine. Additionally, to ensure the source datasets are only read once there is a guarantee of data completeness, Expo UCM relies on the source dataset readiness indicators before triggering the workflow for a specific day. In addition to ensuring data completeness, this step keeps the process costs in check by eliminating the need to perform restatements due to missing and/or incomplete data.
Templated Querying Logic — SQL Templates
To accurately capture the plethora of metrics defined across multiple datasets and linked to one or more experiments, the UCM engine makes the use of SQL code templating. Pre-defined SQL-based code templates are used to transform the source data to calculate the defined metrics and corresponding statistical components. These templates are sourced and dynamically modified by the engine to process the metric calculation logics defined across multiple datasets.
Additionally, templating simplifies the UCM code library and greatly reduces the effort to make changes to existing processing logic.
Automated Scheduling — Airflow Dynamic DAGs
The UCM data processing workload is distributed across multiple pipelines. We leverage Airflow’s Dynamic DAG offering to automatically schedule a new workflow whenever new datasets are onboarded. Segregating metric processing by source dataset provides numerous benefits –
- Optimized read of source data by fetching all relevant information across all configured metrics in a single scan.
- Better data pipeline management in the event source datasets are decommissioned or run into issues. Only associated metrics are impacted, and workflows can be turned on/off without impacting other metrics.
As datasets are onboarded onto the UCM engine and metrics are configured on top of these datasets, Dynamic DAGs in Airflow allows the engine to create individual DAGs for every configured dataset. These individual DAGs are then responsible to spin up their own Google Dataproc Clusters for each execution cycle and run the data-load process for different sources in parallel. Not only does this approach eliminate redundant queries on the same dataset, but also maximizes the usage of big-data computing to distribute workload across multiple Hadoop clusters.
 Internals of Expo UCM Data Processing
Conclusion
Experimentation is a demanding and complicated domain. A change, no matter how big or small, has the potential to completely redefine customer experience. The introduction of Expo UCM has enabled Expo’s users to get deeper insights into their experiments and eliminate the need to analyze customer interactions between Control & Treatment manually during the experimentation life cycle.
UCMs open a world of possibilities and can aid Product Teams in developing a deeper understanding of their customers, which can in-turn lead to the inception and design of more impactful future experiments.
Acknowledgement
We are grateful to all our partners and colleagues who have contributed to the development and adoption of Expo UCM since its inception. Shoutout to our Product and Leadership Team, Mark Walters, Girish Subramanian and Abhishek Gupta, for their valuable time and feedback on this article.
Additional Reading
We are continuously building new products and features to elevate the capabilities of Expo. Check out the below links to similar articles written by my colleagues.
- How Walmart Leverages CUPED and Reduces Experimentation Lifecycle
- Optimizing Experimentation Resources with Shared Control
- Lessons Learned Developing an A/B Experimentation Tool at Walmart Labs
Empowering Deeper A/B Test Insights at Walmart through Self-Serve Custom Metrics for… was originally published in Walmart Global Tech Blog on Medium, where people are continuing the conversation by highlighting and responding to this story.