Need:
Most developers work in multiple deployment environments, including production, development, and testing. Any delay or bugs in these servers can impact all the development deployments. A widespread practice among developers is to run the code on their local machines in IntelliJ or other IDEs. However, the code sometimes behaves differently when running in IntelliJ than when running on a Docker container.
Docker:
Docker is a powerful tool that allows developers to build, test, and deploy applications quickly. Additionally, using Docker, we can generate an image and push it from lower environments up to PROD, thus maintaining consistency and reducing the scope of introducing bugs in higher environments.
Image source: https://en.m.wikipedia.org/wiki
Use-case:
In some cases, the code was passing in IntelliJ, but once the same code was pushed to DEV, startup of the Spring Boot application failed. The main reason was that our code was reading certs from our class path. The way the class path was getting picked in IntelliJ was different from the way our Docker container was searching for it. This was easily identified once we ran the published Docker image in our local Docker desktop and connected and debugged the same using IntelliJ.
Other important use-cases which can be targeted via this would be:
1. Early identification and fixation of errors instead of catching it later during the deployment phase.
2. Testing and validation of changes in a near production like environment.
3. Debugging images in local can help identify and resolve connectivity issues, resource allocation issues or other problems that may affect the startup and functionality of the application.
Tools Used:
- Docker Desktop
- IntelliJ
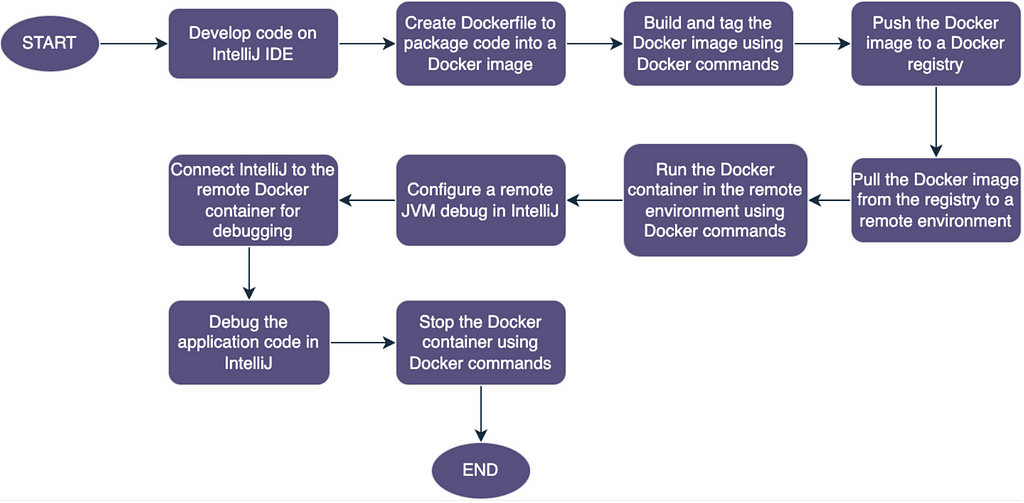
Approach:
1. Run the image on local docker using the command:
docker run -it -p 8080:8080 -e "JAVA_TOOL_OPTIONS=\" agentlib:jdwp=transport=dt_socket,address=8080,server=y,suspend=n\"" <IMAGE_NAME>
2. In IntelliJ, follow these steps:
- Select Edit Configurations
- Add new configuration “Remote JVM Debug”
- Set the port as 8080
- Debug the image and the same will be connected to the running docker image.
Conclusion:
Debugging Docker images is an essential skill for developers, and by following the approach discussed in this article, we can easily identify and fix issues that arise during deployment. The power of docker can easily allow developers to skilfully navigate through the complexities of their applications. Are you ready to hop on the journey of unlocking the potential of Docker and become a great problem solver?
Effortlessly Debugging Docker Images with IntelliJ and Docker was originally published in Walmart Global Tech Blog on Medium, where people are continuing the conversation by highlighting and responding to this story.