PDF files could be still on going attack vector depending on vulnerabilities that been discovered. In this sample the attacker used an old CVE-2010-2883 that performs stack-based buffer overflow for Adobe Reader and Acrobat of version 9.x before 9.4, and 8.x before 8.2.5 on Windows. This vulnerability allows the attacker to execute arbitrary code or cause a denial of service. The sample we are looking for has been posted by @vx-underground in their APT repository in 8 Sep 2021 [1]. The PDF is mostly an email attachment. In this post, we are going to walkthrough analyzing the sample and artifacts that been found beside showing methods and techniques on how to dissect on each step.
Technical Analysis
SHA-256: 4c46e8f35ee5663cff59edcf6d5b9f51f491baf37079d33f8a24417c85a5cd9d
Sample: https://tria.ge/210911-ncy83sbcg6
The first submission of the decoy PDF was in 2011 [2] and the same sample been summited many times then, but there is not any relational files clearly been discovered in public. The PDF itself has 4 blank pages with a check box on top. Depending on your preferences, there’re multiple tools on both Flare-VM and REMnux to analyze PDF files. PDF Stream Dumper is a free GUI based tool, part of Flare-VM set capable to decrypt, analyze, extract malicious code like JavaScript, and extract the original PDF from malicious one. PeePDF.py is part of REMnux tool set which can do just like the PDF Stream Dumper in CLI based mode. When first scanning the PDF file in PeePDF spotting two JavaScript indicator on object 2 and 29. Usually when a PDF doesn’t have any form to fill and when it’s just plain text/images the JavaScript object is suspicious. The (CVE-2010-2883) is a clear indicator which came part of PeePDF scanning.

When dumping Object 29 there appears to be an obfuscated JavaScript with Bese64 encoded scripts at the bottom.

After decoding the Base64 script we get another JavaScript with three shellcodes Base64 encoded stream. To decode and drop the shellcode streams we gonna use base64dump.py part of REMnux tool and check it with any Hex editor. From this shellcode we can see the following APIs:
TerminateProcess
LoadLibraryA
SetFilePointer
ReadFile
CreateFileA
WriteFile
CloseHandle
GetTempPathA

The shellcode is part of CVE-2010-2883 that performs arbitrary code execution which in this case drops an executable file in %TEMP% directory and execute the command for the first stage. Which of course makes the PDF file nothing but dropper. The malicious executable name appears in shellcode as below

Stage one: DLL
File Name: dhq.dll
SHA-256: EBB22358CC0CE4BC40C76E1C02DF8D304FD0B27E9793C7CBCC02F23B4E3C1C89
Sample: https://tria.ge/210913-vj9rqahbhp
For 712.82 KB file size there doesn’t appear to be much imports when looking at the Dll in PeStudio. The Dll file could be packing another executable.
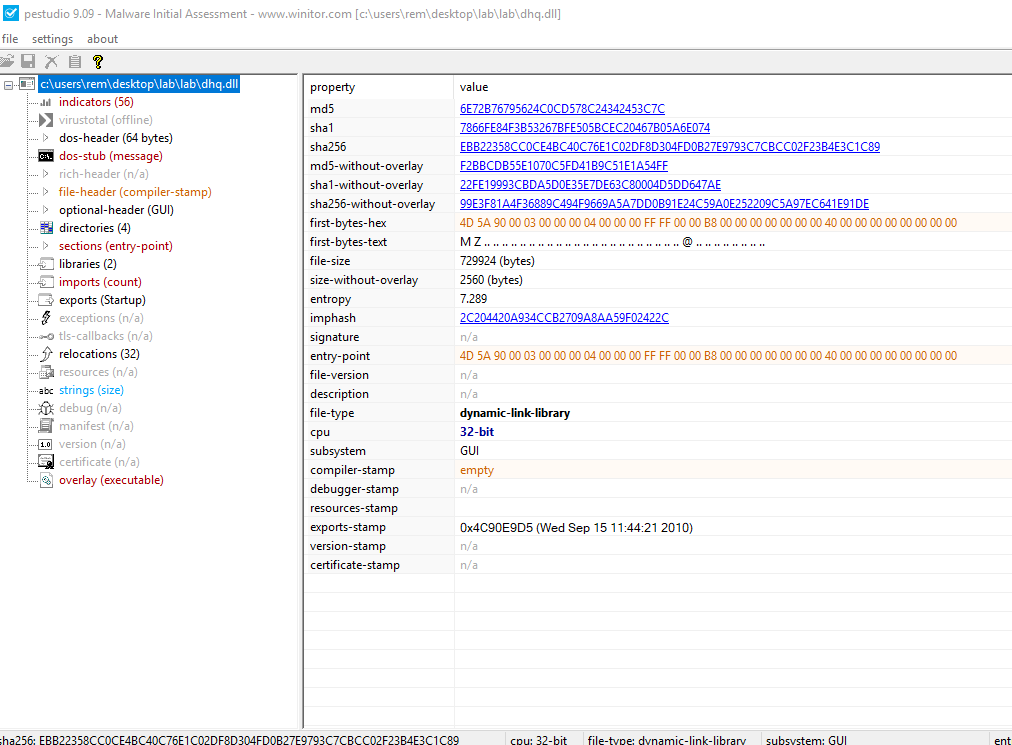


When looking at the entropy in Detect it Easy and see that almost the entire Dll (99.65%) is Overlay which indicates it’s carrying another file(s).

When disassembling the Dll in IDA Pro there appears to be two functions only! One of them is the Export (Startup) which is the main and a subroutine to it.

When examining the Pseudocode it appears that the entire role of Dll is create two files (adobe1.exe and reader.pdf) and run them in process which is a simple packing technique or in better form is dropper. The two created file is dropped in %TEMP% directory.
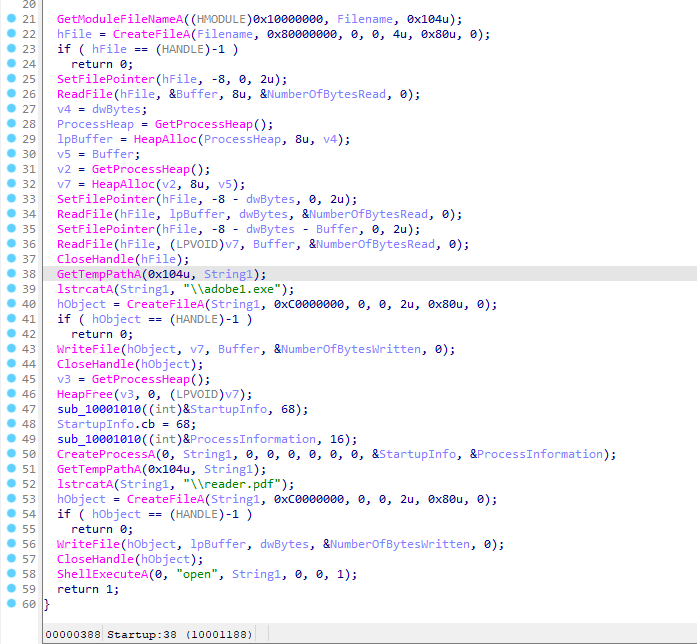
When running the Dll file it launches two main processes. First is the ‘adobe1.exe’ which launches default browser and terminate itself. The second process is a ‘Adobe Reader’ or whatever the default PDF reader in the host.
‘reader.pdf’
SHA-256: 4a9e84a374276202ce4468813331c296e150ad568b3cd20b4d6f71be62d8518b
PDF file has nothing malicious in it. It’s only 16 pages made up CV of a scholar! It’s only part of the decoy that shows up later after the original PDF that has 4 blank pages.


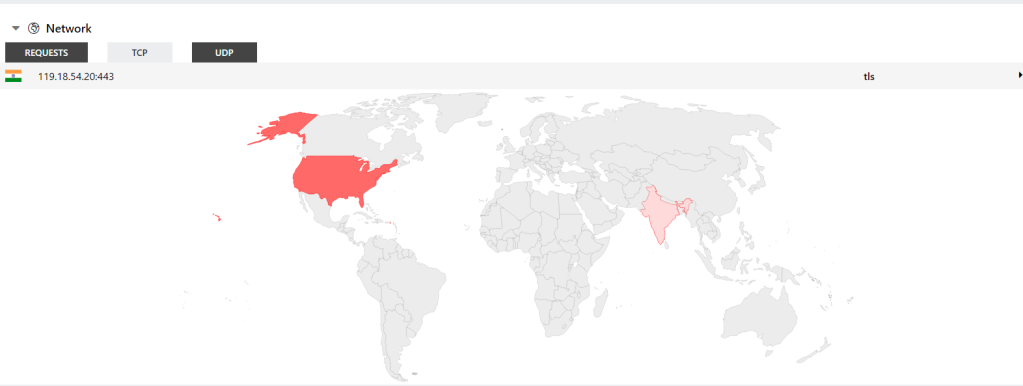
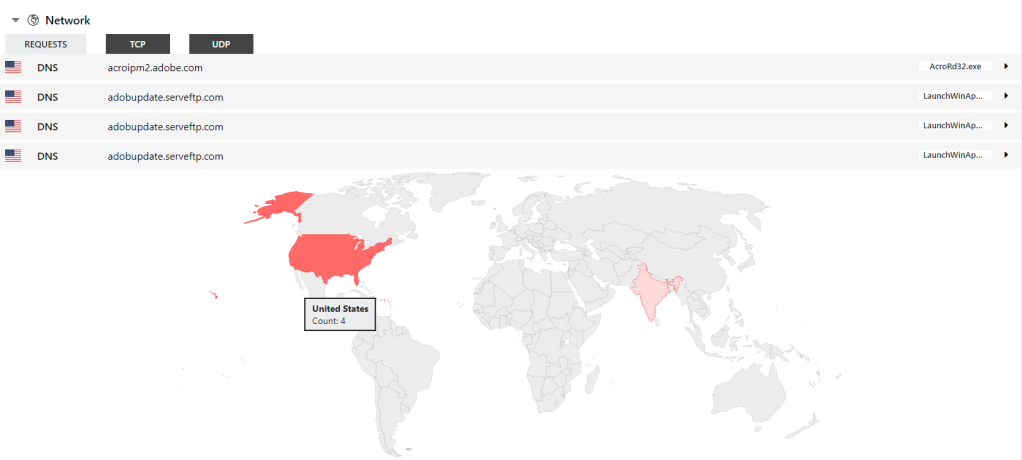
There is not any network connections been made at this stage! however, there’re couple indicators that Hatching Tria.ge [3] only sandbox been able to give some extra network indications about this binary.
Shoutout to @Parshant for his collaboration on this part.
Network Indicators
C2: 119.18.54.20:443 VT, Maltiverse
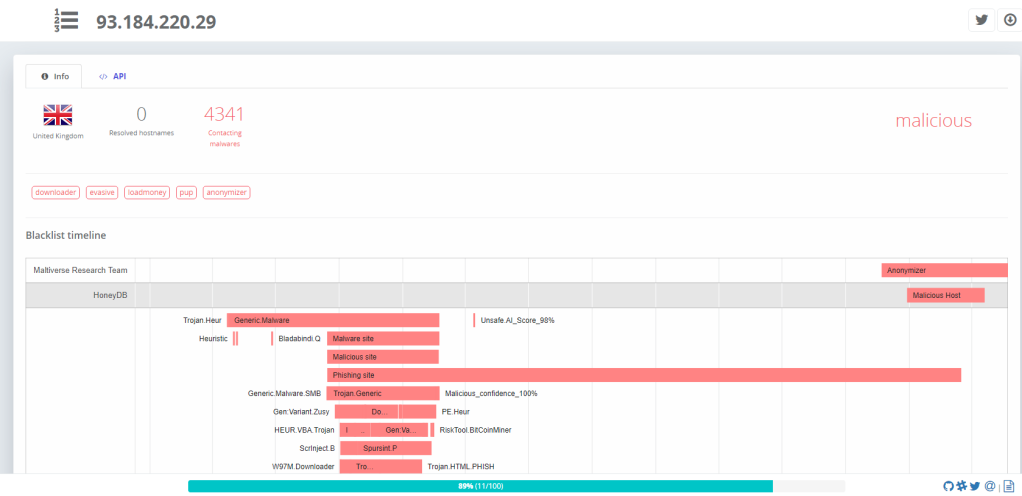
CA Verification: 93.184.220.29:80 VT, Maltiverse
Suspicious IP: 239.255.255.250:1900 VT, ThreatCrowd
URL: adobupdate.serveftp.com: VT, ThreatCrowd


Stage 2: Executable
Name: adobe1.exe
SHA-256: 9c85331956b4018e4bccaa097b452c1cc368183d8f2a34e55e251a616a1f2cb9
Sample: https://tria.ge/210914-3e8ymagdg7
‘adobe1.exe’ seems to be an old sample which could be a packed in a commercialized packer. After running it, ‘adobe1.exe’ creates three default browser in the process without showing any browser window.

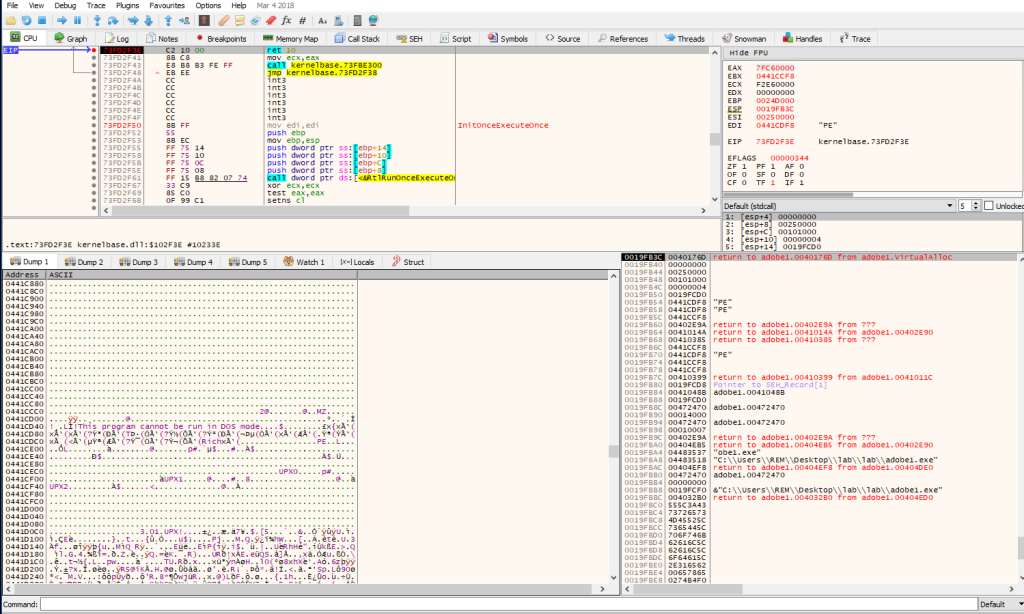
When looking at it creating copy of itself in a new process this indicate that some self-injection happening while running. There are couple ways to extract the the injected code. One of them is scanning one the browsers process with Pe-Sieve which is always a quick and definitive way. Second way is to use Scylla. Both of those can dump out the executable or any shellcode been injected in the process. However, in this analysis found out the best way to unpack the core code from this binary via debugging the sample on x32dbg by setting a breakpoint on the ‘return’ value of the ‘VirtualAlloc’.
VirutalAlloc would always return its value in the EAX register. By keep Follow in Dump each address that EAX register gets and using all the Dump slots available it is possible to find what we’re looking for. In this case the first two returns would be just allocating some space in memory for the code. The third one we can see that EAX has a PE header in it.
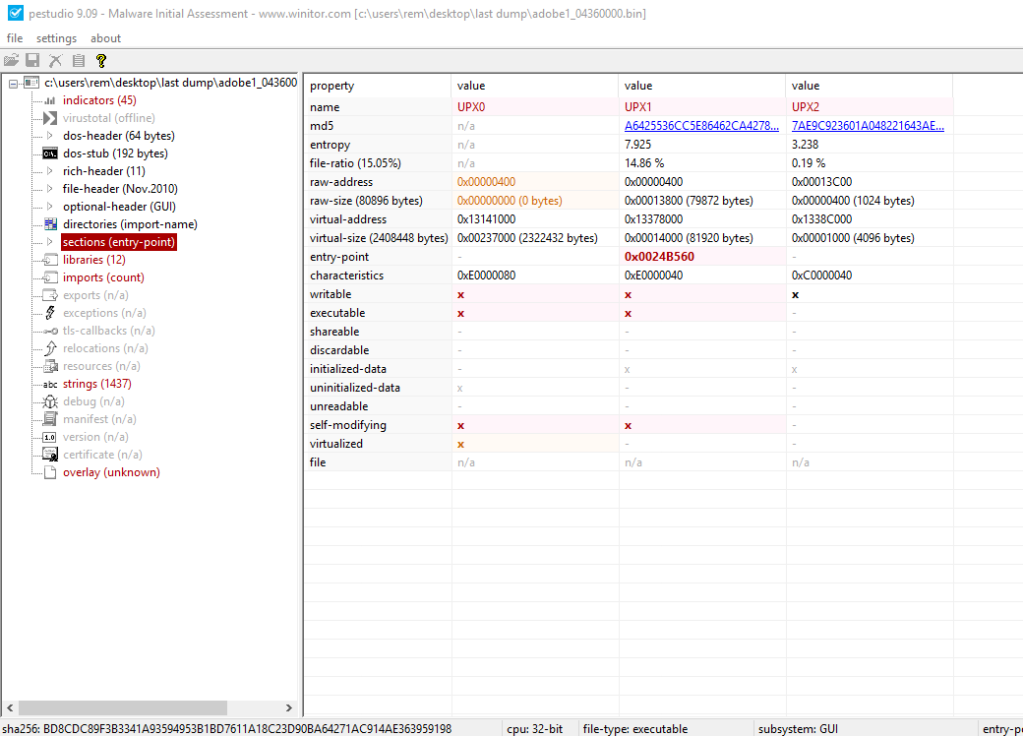
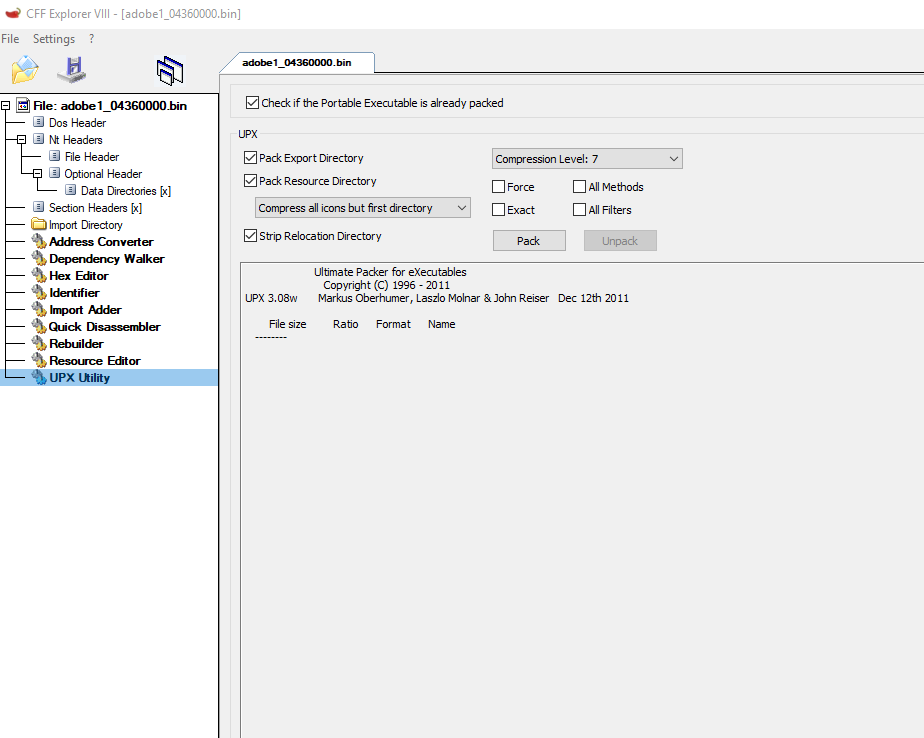
Two things: the allocated space seems to have huge overhead on top of PE header which can be fixed in any Hex Editor without the need to fix any addresses of the binary. The second thing, the dumped PE file shows some UPX version and sections packing in PeStudio. It’s possible to use CLI UPX to unpack but found it helpful using CFF Explorer VIII UPX utility to do the same. The unpacked executable doesn’t need any address alignment as in PE-bear. The unpacked sample is ready to be analyzed and looked in IDA Pro.
Packed binary: https://tria.ge/210921-qy1p5scchj
SHA-256: bd8cdc89f3b3341a93594953b1bd7611a18c23d90ba64271ac914ae363959198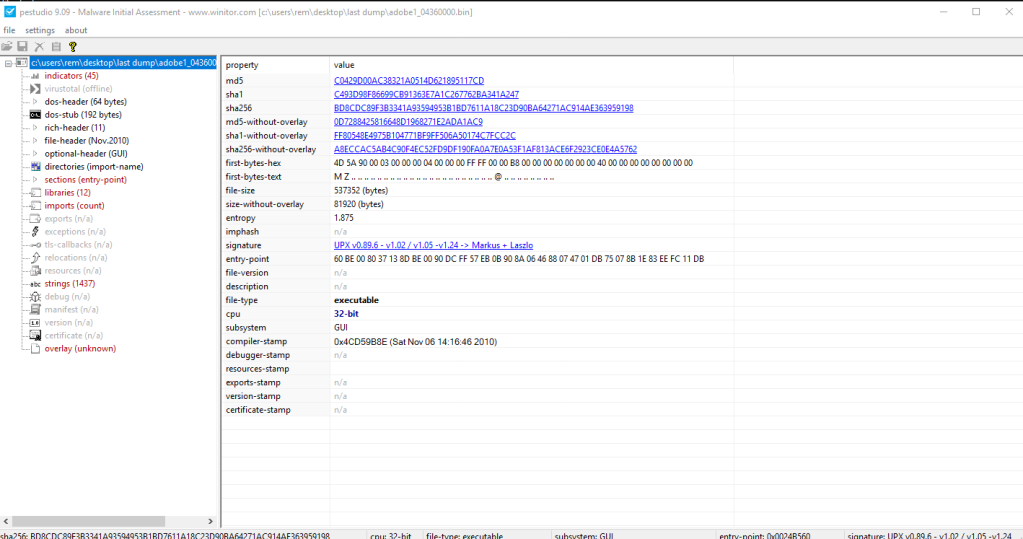

Stage 3: Unpacked Exe
Name: unpacked_437ccf8.exe
SHA-256: 664c3a7e8d4c5316a116a2c00595fb66e338012898b09d44218ae8374477fab8
Sample: https://tria.ge/210921-la1m1shae2
The unpacked binary shows many challenges from anti-analysis, anti-debugging, to not so much helpful strings. We going to take a look at how to avoid anti-debugging later in this section but let’s statically look into the binary and see what possibly comes out of it.
When looking at the first entry function in IDA we can spot the 7th call is calling memory section or dword_13354874. Looking into the memory address seems like an empty pointer. Usually this indicate one of two things, either the binary is dumped incorrectly from memory and the import address table haven’t been built correctly, or the author of this code have built a dynamic import address table (anti-analysis technique) to resolve API dynamically at run time.


To verify let’s check the Cross References (xrefs) of the same address dword_13354874. As you can see there is an EAX register value been moved into this address and that would be setting up the pointer to an API.

When checking sub_13164CEE subroutine from Figure 16, it turns this is just the function prior calling memory or the 6th Call from the entry point. The trick is to step over this function in order to get the import address table so we have the APIs resolved to look at.


To stepover this function, we are going to use IDA’s Local Windows Debugger. First thing, we need to set a breakpoint on the entry point and run the debugger. run stepover sub_13164CEE.

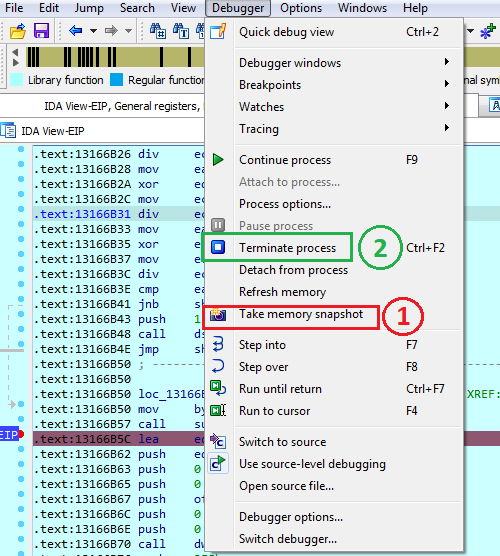
Once stepped over, we go to Debugger -> Take memory snapshot. This set would save all the resolved API and can be statically looked into IDA even without the debugger running. At this point it is safe to stop IDA debugger (Terminate Process (Ctrl + F2)).
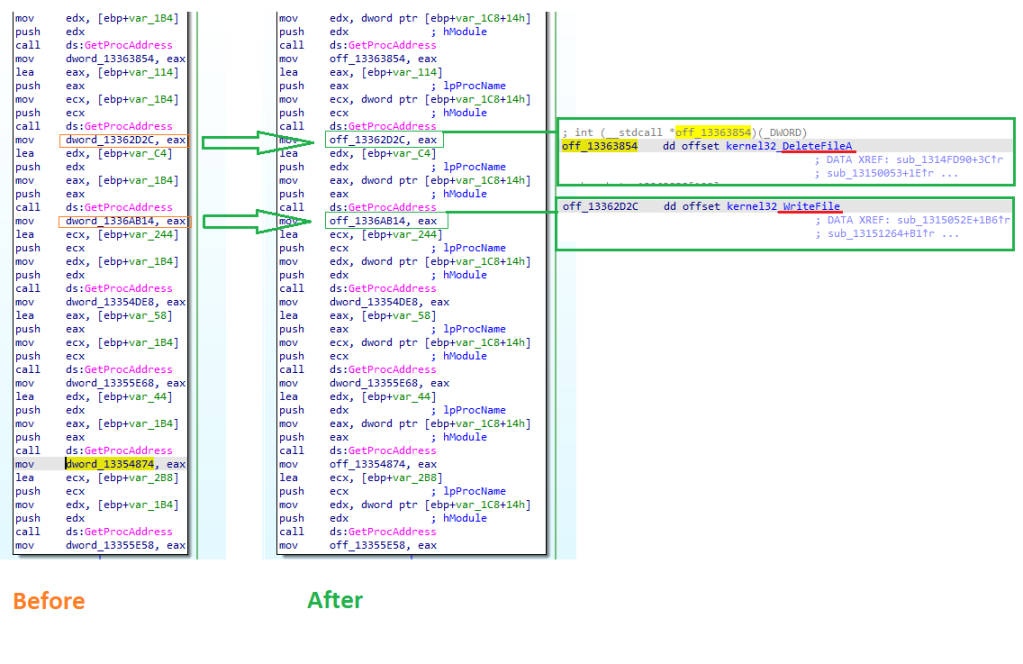
Looking at some of the dword been changed into offset with labeled API. Which can make the analysis much cleaner. However, some case we need to look into memory location in order to find offset or resolve it manually.
Before saving work in IDA, there is one more thing we need to do which could enhanced the analyzed binary much further by going to (Options -> General -> hit Analysis tab -> hit Reanalyze program -> hi Ok) the entire Re-analysis would take time, and the enhanced analysis visually appears in the Navigation bar. This entire trick would be handy when analyzing ransomware sample in order to find out the strings and show dynamically resolved APIs.


Majority part of the strings and APIs can now been seen in clear text. As seen in figure below there’re so functions that collect information about the victim machine to make a profile


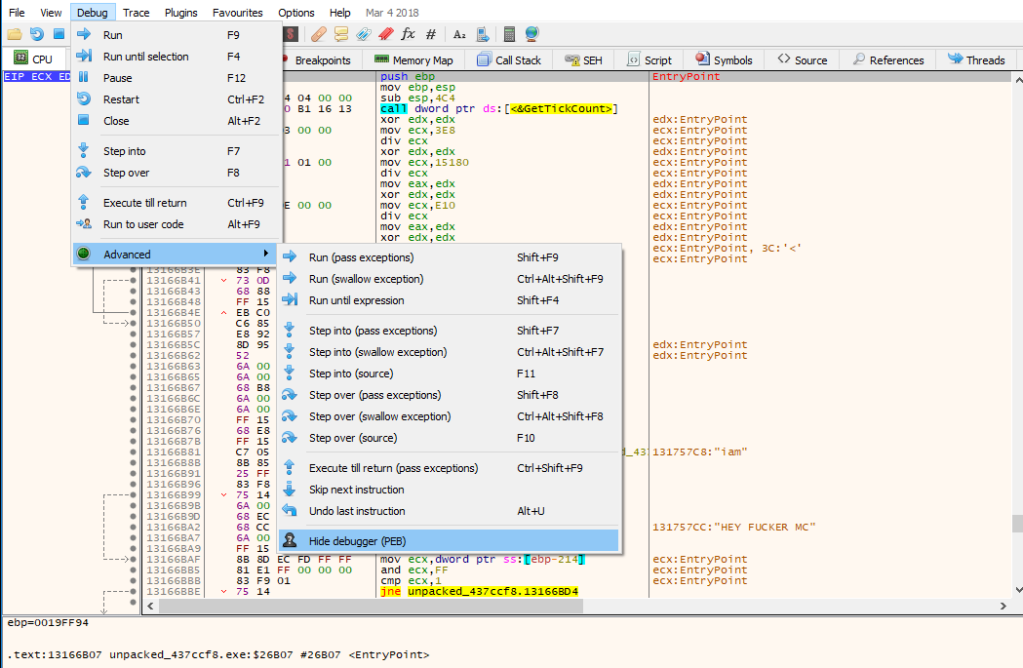
There’s an anti-debugging technique been used in this sample. In-order to pass it we gonna use x32dbg to dynamically debug the sample by using Hide debug function like below and couple of NOPs to patch the sample.

And just to show case we going to breakpoint at CreateProcessA in order to see what tool is going to run.

Conclusion
Exploiting an old CVE shows no sophistication in this sample. However, this is just a first stage and the attacker could be targeting someone in specific with educational background like universities or some governmental recruiter in general based on the PDF content which contains fake CV information. The other stages shows some action going on when looking into network behavior and intel. The fact that binaries haven’t been unsubmitted before and there are some intermediate techniques of packing and obfuscation with anti-analysis and anti-debugging shows some sort of skills to avoid detection.
References
[1] https://vx-underground.org/samples/Families/APT/2021.09.08/
[3] https://tria.ge/210913-vj9rqahbhp/behavioral2
Article Link: Dissecting binaries from unknown threat actor – Malware Analysis