High fidelity detections are critical but if they get lost in the noise of other alerts they may get missed or not actioned appropriately. A Detection engineering team is required to build a system to support the monitoring of “everything” so its important to have a robust pipeline. When there is a logical and intuitive place for each type of detection or data source rolling out detections will be quicker.
There should be a place for your custom built high fidelity rules and the noisy closed source signature tool that was recently acquired without your knowledge or input. We want the data sources and analytics we have the most confidence to rise to the top while the other noise machines can continue to be monitored without clogging the pipeline.
The two types of data sources for a detection pipeline are security tools and telemetry. Closed source signature security tools have built-in detections provided by the vendor and in some cases they also offer the ability to write complex custom detections within them. There are open source signature security tools but sadly they are becoming more rare. Security tools look at the telemetry they are designed to collect to discover malicious activity within it.
Some examples of popular security tools are below:
- Endpoint — Elastic, CrowdStrike, Sentinel One, Microsoft Defender, etc
- Application — F5, Fortinet, Akamai, etc
- Email — O365 Sec & Compliance, Proofpoint, Sophos, etc
- Cloud — Azure Identity Protection, AWS Guard Duty, Google SCC, etc
- Network — Cisco Firepower, Palo Alto, ZScaler, Netskope, etc
Telemetry are events from technology indicating some activity occurred. Custom analytics are required to discover malicious activity within these logs.
Some examples of core telemetry sources are below:
- Endpoint — Windows Event Log, Powershell Events, Windows Registry, Linux Syslog, etc
- Network —Web Proxy events, Netflow, DNS events, etc
- Cloud — AWS Cloudtrail, Azure EventHub, etc
- Access — Active Directory, Entra ID, etc
- Email — O365, Email Flow, etc
Here are some excellent telemetry frameworks to show the vast amount of event types to build detections from. These are great for mapping your data sources to better understand your current logging visibility.
- OSQuery
- OCSF — Open Cybersecurity Schema Framework
- Mitre Data Components
A large enterprise will have data sources from different environments. In general that is some variation of Production, Staging/QA, and Development environments. From a security perspective having malware or a threat actor in any environment is an issue. It would unwise to only monitor Production thinking that’s the most important data. An attacker could hang out in the Staging environment indefinitely finding ways to sneak into the production environment. If a staging environment is ransomware’d that would be a major problem for any enterprise as well. At a minimum production and staging environments should be monitored by security tools and custom analytics. Since there is generally more freedom in non-prod environments the sensitivity of the detections could be toned back a bit.
Maturity Level — None
Before walking through the full maturity model we will start with the first level which is no detection pipeline at all. This is when analysts are bouncing between security consoles looking at alerts. This is not sustainable and this method is highly unlikely to catch a sophisticated adversary.
 Very hectic, look at that unhealthy heart rate for the analyst
Pros
- Cheap and quick from a technology perspective
Cons
- Not Measurable — Security consoles retain alert logs for a limited amount of time so if an alert rolls over its gone. It would not be feasible to prove the appropriate alerts were actioned when working directly from consoles.
- Manual Correlation — Sophisticated adversaries may trip some low severity alerts on different systems and in this scenario you would rely on an analyst to remember what they saw before. If there are multiple analysts across different regions and time zones then there are even less chances of manual correlation occurring.
- Inconsistent prioritization — The analyst will need to prioritize each console based on their experience leading to inconsistency and favoritism of specific security tools.
- Mistake prone — Alerts from security consoles are manually exported and placed within a case management system which will be done differently by every analyst and mistakes and data loss are likely to occur.
- Manual Tuning — Any alert tuning or more likely suppression would have to occur in each console manually. This does not give much flexibility to tune and the way to tune would rely on the console itself which makes it all even more complex.
- Manual data enrichment — Adding context from other log sources is not feasible in this scenario increasing investigation times.
- Limited custom detection capabilities — It would only be possible to write custom rules within the security tool itself which would be useful during an incident but not sustainable long term.
- No Log analytics platform — At this stage it’s unlikely there is a central log analytics platform.
Maturity Level — Basic
At the basic level the security tools are integrated with a central case management which is better than using the consoles separately to look at alerts. Some case management systems are able to perform alert aggregation and field normalization to at least provide a consistent alert structure for review and prioritization based on the vendors configuration. Investigation would likely need to be performed separately within another analytics platform and the security console itself.
An alternative basic setup would include sending alerts through an analytics platform but it would mostly be a pass through. This would still be an improvement since going beyond basic requires all data sources going through an analytics platform.
 Improved but still mostly manual and hectic
Pros
- Data Retention — Alerts are retained for a longer period within the auditable case management system
- Measurable — Alerts that were reviewed are auditable since they will always be sent to case management for investigation.
- Single Pane of Glass — Analysts are not jumping around in many consoles looking for new triggered alerts.
- Basic prioritization — Some prioritization can occur based on the data source.
Cons
- Minimal data correlation — Limited to basic correlation across multiple security tools which would not scale for custom analytics.
- Manual data enrichment — Adding context from other log sources is not feasible in this scenario adding to longer investigation times.
- Limited custom detection capabilities — It would only be possible to write custom rules within the security tool itself which would be useful during an incident but not sustainable long term.
- Manual Tuning — Any alert tuning or more likely suppression would have to occur in each console manually. This does not give much flexibility to tune and tuning procedures and capabilities would be different in each console.
Maturity Level — Standard+ Architecture
At this level you will have the core building blocks for a scalable pipeline that can continue to grow with more sophisticated detections. Let’s start with a high level view of the detection pipeline.

Data Sources
Everything no matter where it’s coming from is a data source. Microsoft defender for endpoint is a data source just like email flow logs are. They would both need to be on-boarded to a central data analytics platform with the available fields extracted and normalized.
Analytics
Analytics is the logic to identify malicious or suspicious activity within an environment. Analytics are both security tools or custom searches against telemetry. We will need to break it down one step further since validation will be different depending on the type of analytic we are using. These could also be called signatures or signals but to avoid the marketing mess of behavior vs signatures I’ll call them all analytics.
Security Tools — Closed Source Analytics
Closed source analytics are from security tools that are purchased by the enterprise and must be incorporated into the pipeline. Closed source security tool analytics are commercial security tools where the rule sets have not been vetted or tested within your environment. These are common in every environment which do catch malicious activity however validating detection coverage is cumbersome since the detection logic is hidden.
Security Tools — Open Source Analytics
Some security tools do share the detection logic that is running within them. This is wonderful since this gives the consumer the ability to validate detection coverage, modify these rules for your own environment and add new rules. With a complete understanding of how the rule will perform the detection engineering team is able to determine the appropriate priority if the rule ever fires.
Examples:
- Malicious file discovered on an endpoint
- Log4j exploit attempt against an external web application
- Custom Snort rule scanning network traffic
- Script writing MZ header to a file
Telemetry — Custom Analytics
Custom analytics are the rules to identify malicious or suspicious activity using the logs within your environment. These rules would typically run within a log analytics platform such as Splunk or Kibana.
Examples:
- Kerberoasting against Active Directory
- High login attempt failure ratios against External Web Applications
Enrichment
Enrichment adds useful context to the output of an analytic. For example if a malicious file is discovered on an endpoint the log may have the hostname with the username. Enrichment could add the department the user works in, the region, email address and domain of the endpoint. This context would be valuable for correlation, alerting thresholds and investigations.
Risk Engine
All detection analytics whether from telemetry or security tools pass through the risk engine. Within the risk engine many factors are considered to determine the risky events that will be bubbled up and forwarded to case management to action. Building a risk engine is out of scope for this post but at a high level it takes the output from every analytic and sums the risk scores for each by (at least) asset, user or threat object correlating all data sources. When those reach a threshold over a specific period of time it will trigger an alert to send to case management.
Below is an example table on how this could work. In an enterprise there would be more factors to consider such as attack technique and confidence in the data source.

To continue with the same theme from the other diagrams the pipeline architecture would look like this.

Maturity Level — Standard
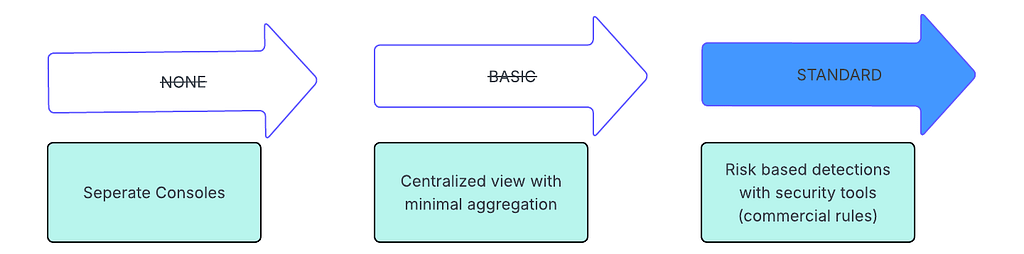
The standard level takes security tool analytics and feeds them through the risk engine. Its important to focus on the biggest wins first. While custom signatures are more fun (and in some cases more likely to detect an adversary) the security tools need to be addressed first. The enterprise made an investment and monitoring will be required.
Security tools have hundreds or more analytics built in so implementing monitoring for them does enable so much visibility. It’s critical that all security tools are filtered through a risk engine especially if the security tool has closed source analytics. This allows for aggressive correlation and scoring depending on the fidelity of the security tool.
In the maturity model this pipeline would replace the None and Basic levels. As an organization matures it’s rarely a quick lift and shift of everything but the end goal would be to ensure all detection data sources flow through the analytics platform first.
Maturity Level — Advanced

Advanced is where organizations will have the majority of their rules. The majority of the triggered alerts may still however originate from commercial rules within security tools. The advanced rules will be custom built and validated against attack simulations within your own environments so they will be higher fidelity. Advanced does not replace standard; instead it’s how custom rules are integrated into the pipeline along with commercial rules.
Atomic detections with telemetry
All rules go through the detection engine however some high fidelity signatures will be set to alert every time. They will still be correlated with lower severity signatures within the risk engine to collect other signatures if anything else triggered as well.
Examples:
- Script writing MZ header to a file
- High password attempt failure ratios against External Web Applications
Risk based detections with security tools (custom rules)
These are similar to other rules however diving into building rules within security appliances generally requires collaboration with security engineering teams and justifiably more scrutiny since a bad rule could take down an entire appliance or even worse entire network zones or halt critical business processes.
Examples:
- Snort rule looking for double SSL encrypted traffic
- Email quarantine rules scanning email headers and bodies for targeted phishing
Risk based detections with telemetry
Adversaries are attempting to blend in with normal users and perform actions that power users or administrators use day-to-day. In these situations the risk engine is critical for clustering many more common events within an enterprise. Alone these types of events are business as usual but as more are performed then the risk scores would rise. When they reach the alerting threshold they would trigger and be actioned.
Examples:
- Many discovery commands (ipconfig, dsquery, route, hostname, etc) performed on an endpoint
- Many requests for RC4 encrypted service tickets against Active Directory from the same user
- Many downloads of the same image (.gif, .jpg, etc) file name with different hashes
- RDP tunneling with the same username across many systems
Maturity Level — Leading

Data science backed detections with telemetry
Some detections will require more horse power and special analytics to find outliers. These generally cannot be performed in a standard analytics platform which is OK! Not every platform can do everything. This is where some of the data crunching can be offloaded to another platform such as Databricks or Dataiku then results can be sent back.
Example:
- DLL Sideloading detection looking for outliers
Deception
Finally, lets have some fun and set traps for adversaries. Having detections is great but adding deception into the mix will make it even more likely to discover an attacker in your environment or at least someone snooping around where they shouldn't. But be careful, it would be devastating and embarrassing if an adversary was able to turn our deceptions against us.
Examples:
- Incorrect credentials for a valid account placed within endpoint scripts
- A juicy sounding service account with an SPN
Measuring Maturity
Measuring your maturity would not mean only having detections in the leading category. It will be a mixture of Standard, Advanced, and Leading with the majority of the analytics being within Advanced.
The goal is to have measurable, reliable and validated detection coverage. It is very challenging for detection engineers to measure coverage, build new (where there are gaps) and tune detection sources with closed source rules. A solution with closed source analytics is maintained by the vendor and new rules get added and removed without the clients consent. It could have a rule one day then next week that alert could be disabled making it impossible to trully understand your detection coverage.
In addition to that sophisticated threat actors test their tool sets against commercial security tools until they can evade them. Its critical to have custom analytics adversaries are unaware of to have the best chance to discover them in your environment. Wonderful post by malwarejake making the same point.
As more advanced and leading type detections are rolled out we can reduce the reliance on unmeasurable analytics thus increasing the detection fidelity. The standard level analytics would not be removed since they do provide value but their risk thresholds can continue to be reduced if they are noisy which will result in an overall higher detection fidelity.
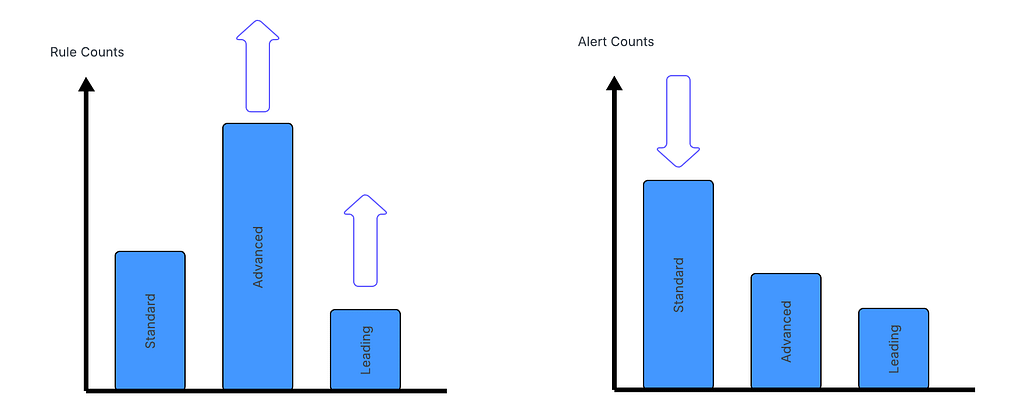 Reduce the reliance on closed source analytics!
Here’s a new Risk engine example table on what it could look like to reduce the risk thresholds for analytics that have not or cannot be validated.

Within the table any analytic that has not been validated (default rating) gets their risk score adjusted. This could be done for many more factors as well to increase or decrease risk scores.
Asset1 — This asset did generate an alert but only after the rule was correlated with another event. There is only so much this example table can show but logic could also be applied to require that the second event comes from a different data source entirely. If two different data sources see suspicious activity on a system that generally should result in alert. This is a great method to bring down the noise when modifying the analytic is not feasible.
Event2/Event3 — These events are both rated Medium however have different risk scores. There isn’t enough detail here to explain the why nor is that the point. This is to show that there is freedom when applying risk scores and just because the severity is medium does not mean it will always have to be the same risk score.
Bonus Hunting Opportunities
To further validate your detection pipeline time should be allocated to validate risk thresholds are appropriate. The risk engine is a place where many rules with data enriched results are flowing and would be an excellent place for hunting to occur to discover anything that may be flying under the radar. Detection engineers should also be regularly reviewing and validating thresholds as well.

Sources and Additional Reading
https://redcanary.com/blog/testing-and-validation/detection-validation/
https://lantern.splunk.com/Security_Use_Cases/Threat_Investigation/Implementing_risk-based_alerting
https://www.splunk.com/en_us/form/the-essential-guide-to-risk-based-alerting.html
Detection Pipeline Maturity Model was originally published in Detect FYI on Medium, where people are continuing the conversation by highlighting and responding to this story.
Introduction to Malware Binary Triage (IMBT) Course
Looking to level up your skills? Get 10% off using coupon code: MWNEWS10 for any flavor.
Enroll Now and Save 10%: Coupon Code MWNEWS10
Note: Affiliate link – your enrollment helps support this platform at no extra cost to you.
Article Link: https://detect.fyi/detection-pipeline-maturity-model-076984779651?source=rss----d5fd8f494f6a---4