Wireshark is a free protocol analyzer that can record and display packet captures (pcaps) of network traffic. This tool is used by IT professionals to investigate a wide range of network issues. As a Threat Intelligence Analyst for Palo Alto Networks Unit 42, I often use Wireshark to review traffic generated from malware samples.
What makes Wireshark so useful? It is very customizable. The default column display in Wireshark provides a wealth of information, but you should customize Wireshark to better meet your specific needs. This blog provides customization options helpful for security professionals investigating malicious network traffic.
A pcap for this tutorial is available here. Keep in mind you must understand network traffic fundamentals to effectively use Wireshark. This tutorial uses version 2.6 of Wireshark and covers the following areas:
- Web traffic and the default Wireshark column display
- Hiding columns
- Removing columns
- Adding columns
- Changing time to UTC
- Custom columns
Web Traffic and the Default Wireshark Column Display
Malware distribution frequently occurs through web traffic, and we also see this channel used for data exfiltration and command and control activity. Wireshark’s default column is not ideal when investigating such malware-based infection traffic. However, Wireshark can be customized to provide a better view of the activity.
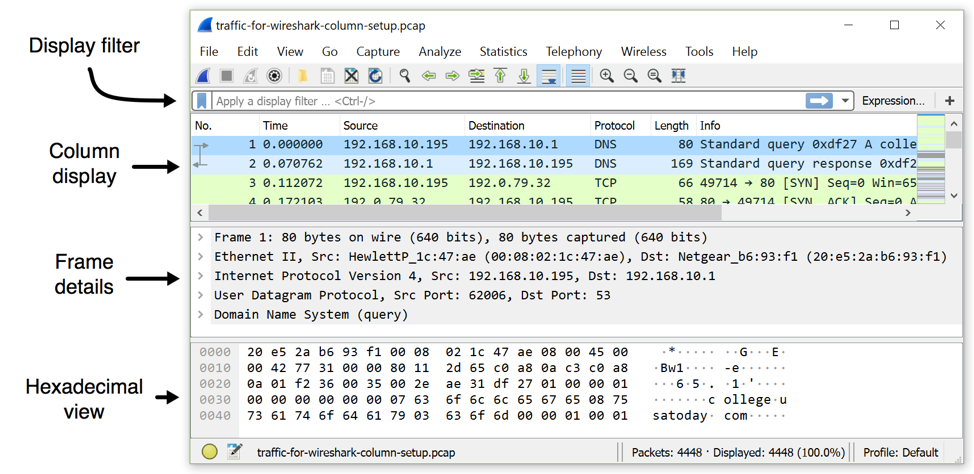
Figure 1: Viewing a pcap using Wireshark’s default column display.
Wireshark’s default columns are:
- No. -Frame number from the beginning of the pcap. The first frame is always 1.
- Time – Seconds broken down to the nanosecond from the first frame of the pcap. The first frame is always 0.000000.
- Source – Source address, commonly an IPv4, IPv6, or Ethernet address.
- Destination – Destination address, commonly an IPv4, IPv6, or Ethernet address.
- Protocol – Protocol used in the Ethernet frame, IP packet, or TCP segment (ARP, DNS, TCP, HTTP, etc.).
- Length – Length of the frame in bytes.
In my day-to-day work, I require the following columns in my Wireshark display:
- Date & time in UTC
- Source IP and source port
- Destination IP and destination port
- HTTP host
- HTTPS server
- Info
How can we reach this state? First, we hide or remove the columns we do not want.
Hiding Columns
We can easily hide columns in case we need them later. Right-click on any of the column headers to bring up the column header menu. Then left-click any of the listed columns to uncheck them. Figure 2 shows the No., Protocol, and Length columns unchecked and hidden.
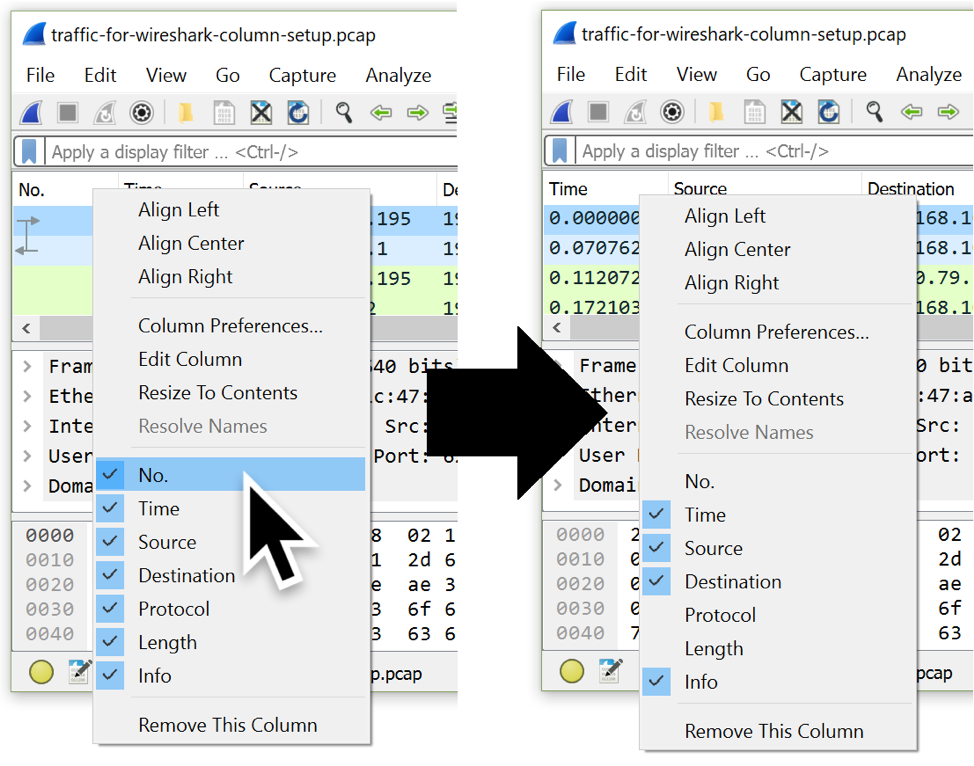
Figure 2: Before and after shots of the column header menu when hiding columns.
Removing Columns
Because I never use the No., Protocol, or Length columns, I completely remove them. To remove columns, right-click on the column headers you want to remove. Then select “Remove this Column…” from the column header menu.
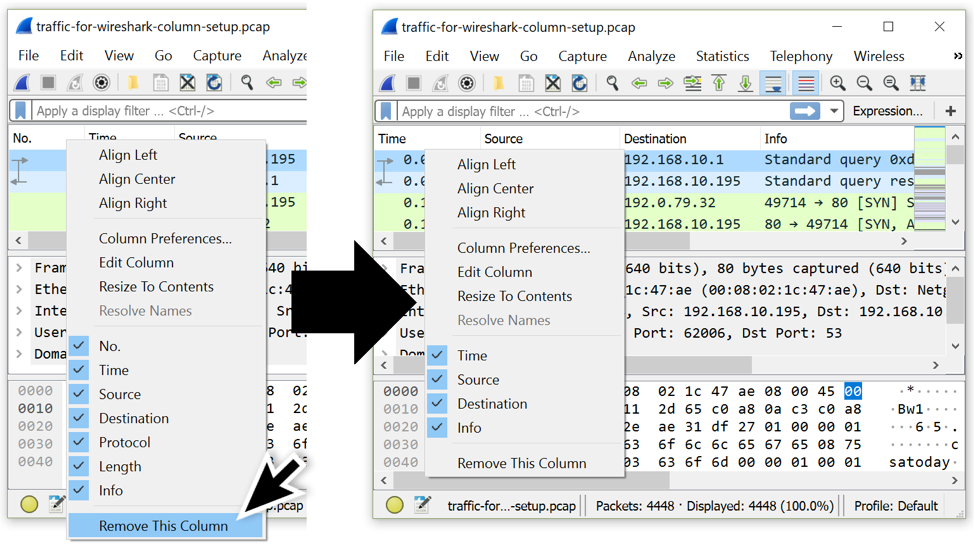
Figure 3: Before and after shots of the column header menu when removing columns.
At this point, whether hidden or removed, the only visible columns are Time, Source, Destination, and Info.
Adding Columns
To add columns in Wireshark, use the Column Preferences menu. Right-click on any of the column headers, then select “Column Preferences…”
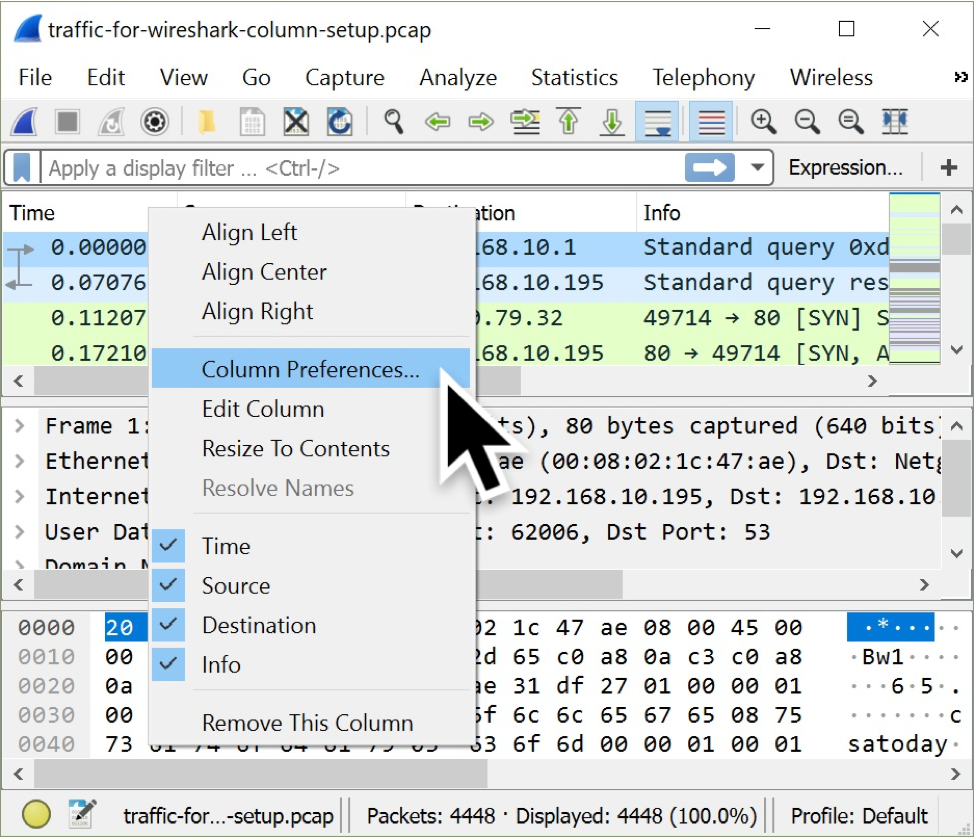
Figure 4: Getting to the Column Preferences menu by right-clicking on the column headers.
The Column Preferences menu lists all columns, viewed or hidden. Near the bottom left side of the Column Preferences menu are two buttons. One has a plus sign to add columns. The other has a minus sign to remove columns. Left-click on the plus sign. An entry titled “New Column” should appear at the bottom of the column list.
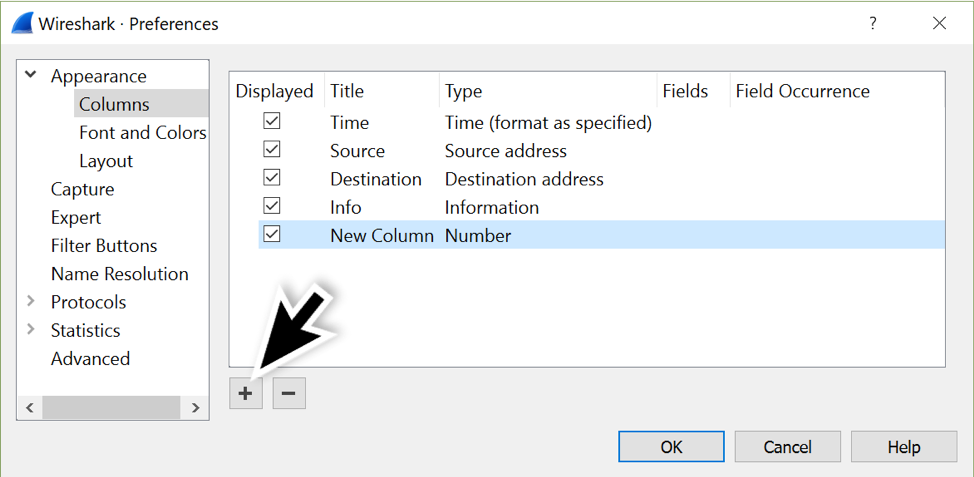
Figure 5: Adding a new column in the Column Preferences menu.
Double-click on the “New Column” and rename it as “Source Port.” The column type for any new columns always shows “Number.” Double-click on “Number” to bring up a menu, then scroll to “Src port (unresolved)” and select that for the column type.
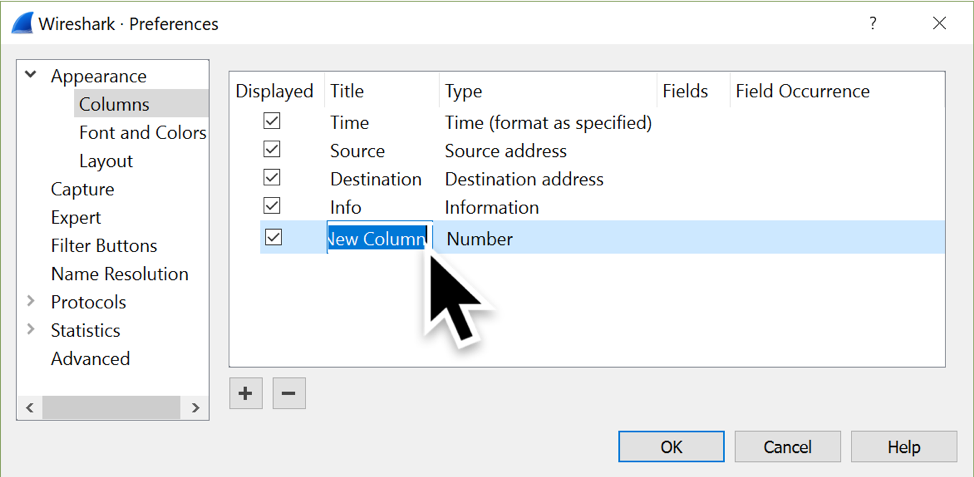
Figure 6: Changing the column title.
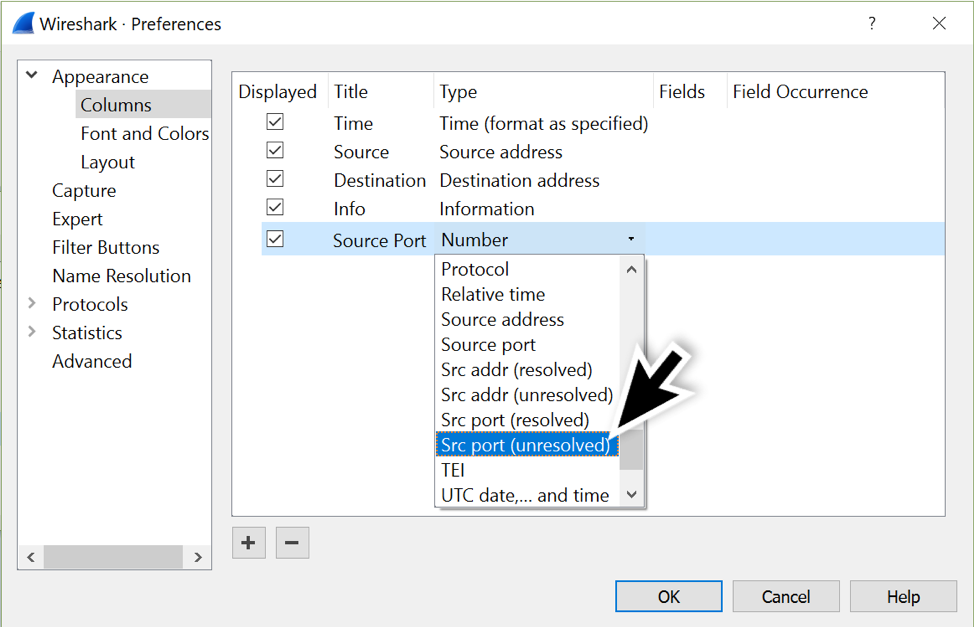
Figure 7: Changing the column type.
Our new column is now named “Source Port” with a column type of “Src port (unresolved).” Left-click on that entry and drag it to a position immediately after the source address.
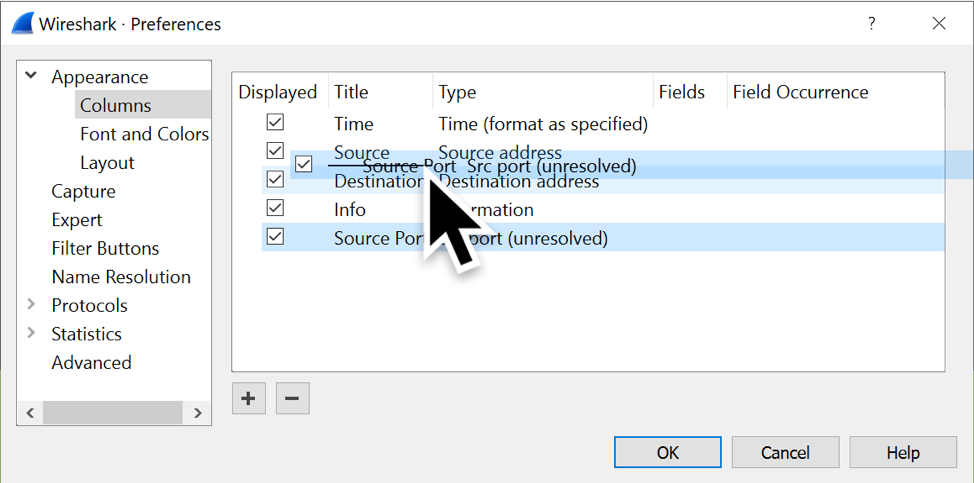
Figure 8: Changing the column position.
After the source port has been, add another column titled “Destination Port” with the column type “Dest port (unresolved).”
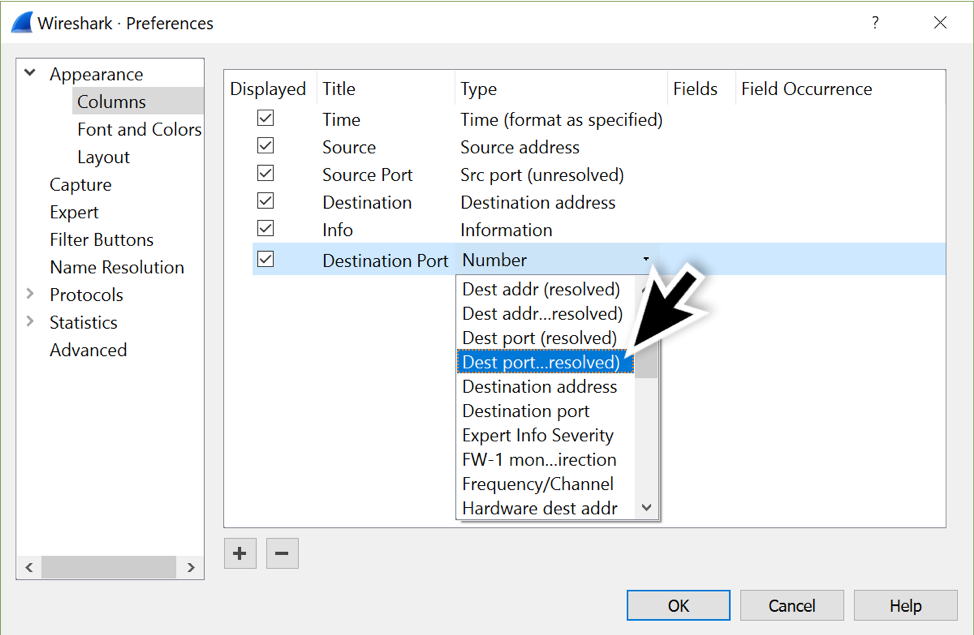
Figure 9: Adding another column for Destination Port.
Like we did with the source port column, drag the destination port to place it immediately after the Destination address. When you finish, your columns should appear as shown in Figure 10.
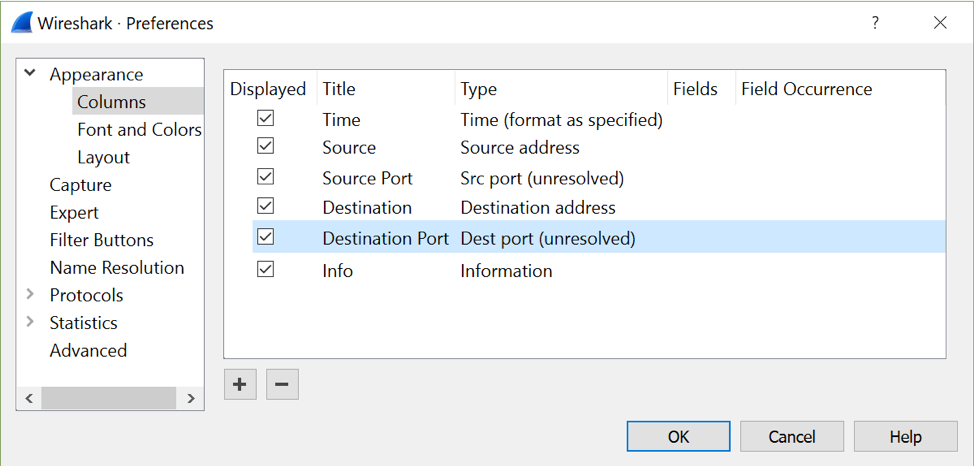
Figure 10: Final setup in the Column Preferences window.
After adding the source and destination port columns, click the “OK” button to apply the changes. These new columns are automatically aligned to the right, so right-click on each column header to align them to the left, so they match the other columns.
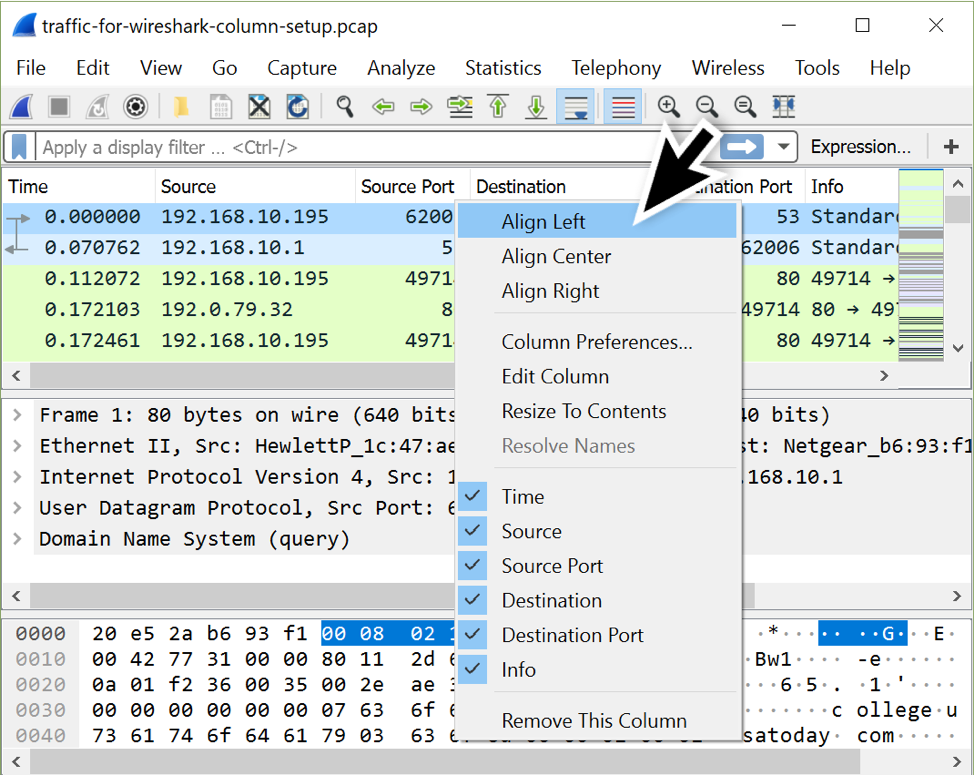
Figure 11: Aligning column displays in Wireshark.
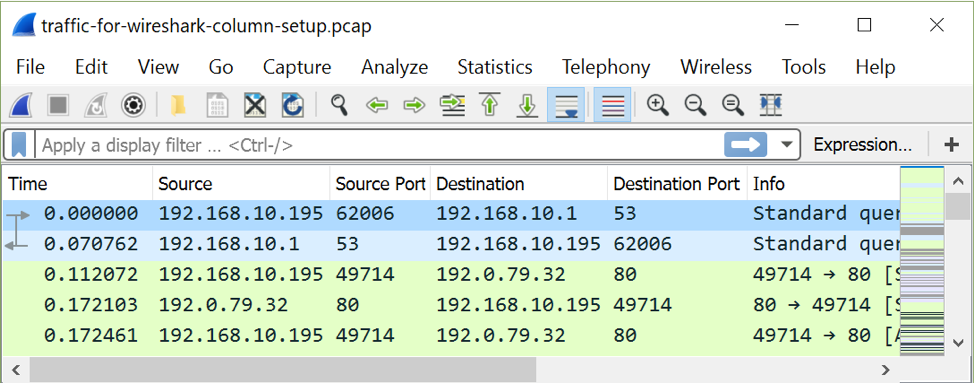
Figure 12: Column display after adding and aligning the source and destination ports.
In my day-to-day work, I often hide the source address and source port columns until I need them.
Changing Time to UTC
To change the time display format, go the “View” menu, maneuver to “Time Display Format,” and change the value from “Seconds Since Beginning of Capture” to “UTC Date and Time of Day.” Use the same menu path to change the resolution from “Automatic” to “Seconds.” Figure 13 shows the menu paths for these options.
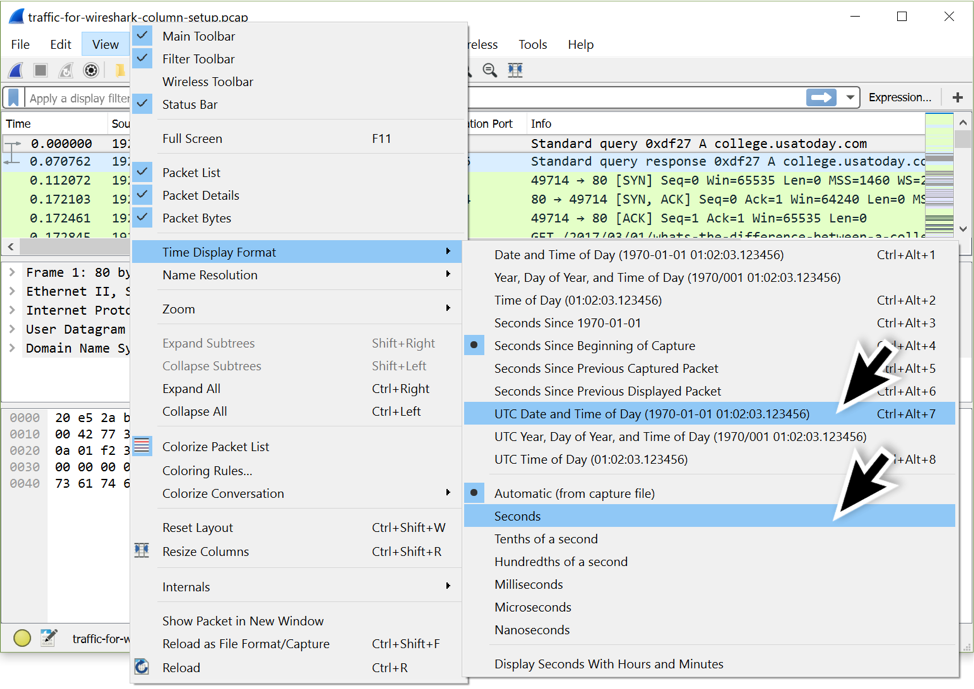
Figure 13: Changing the time display format to UTC date and time.
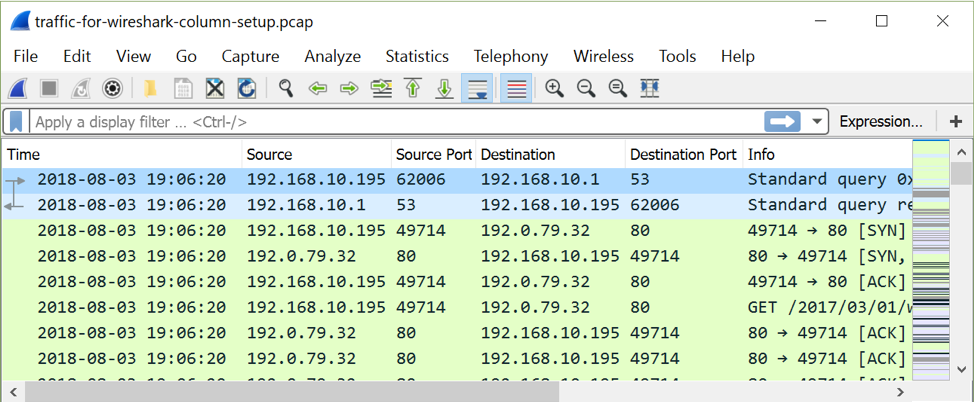
Figure 14: UTC date and time as seen in updated Wireshark column display.
Adding Custom Columns
While we can add several different types of columns through the column preferences menu, we cannot add every conceivable value. Fortunately, Wireshark allows us to add custom columns based on almost any value found in the frame details window. This is how we add domain names used in HTTP and HTTPS traffic to our Wireshark column display.
To quickly find domains used in HTTP traffic, use the Wireshark filter http.request and examine the frame details window.
In the frame details window, expand the line titled “Hypertext Transfer Protocol” by left clicking on the arrow that looks like a greater than sign to make it point down. This reveals several additional lines. Scroll down to the line starting with “Host:” to see the HTTP host name. Left click on this line to select it. Right click on the line to bring up a menu. Near the top of this menu, select “Apply as Column.” This should create a new column with the HTTP host name.
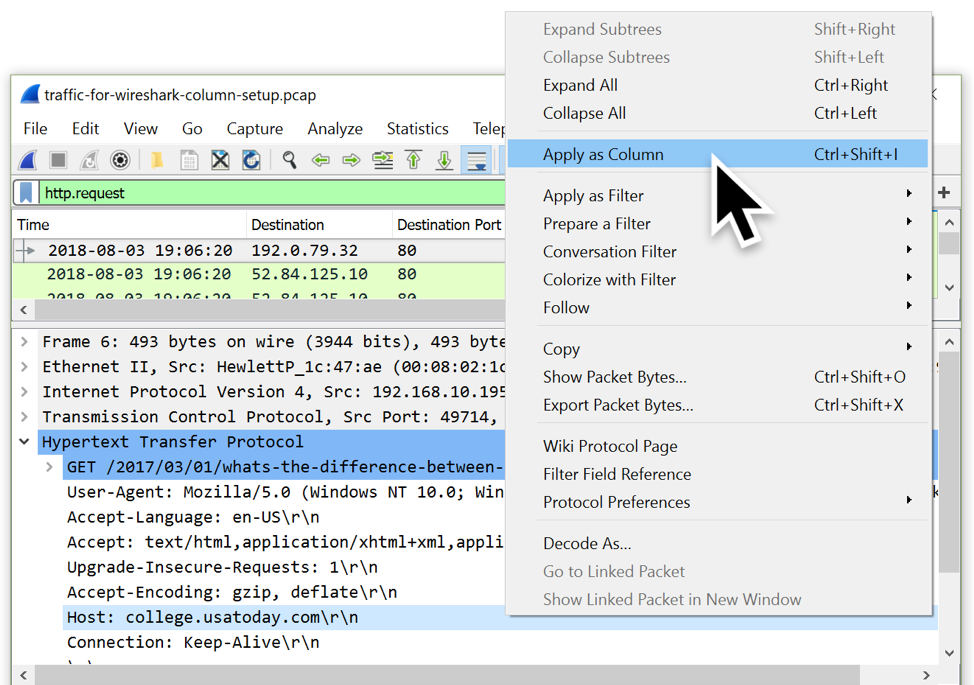
Figure 15: Applying the HTTP host name as a column.
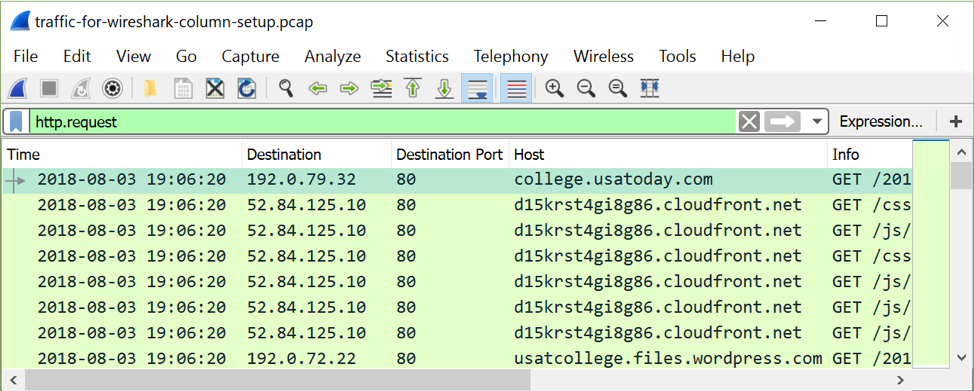
Figure 16: HTTP host names in the column display when filtering on http.request.
To find domains used in encrypted HTTPS traffic, use the Wireshark filter ssl.handshake == 1 and examine the frame details window.
In the frame details window, expand the line titled “Secure Sockets Layer.” Then expand the line for the TLS Record Layer. Below that expand another line titled “Handshake Protocol: Client Hello.”
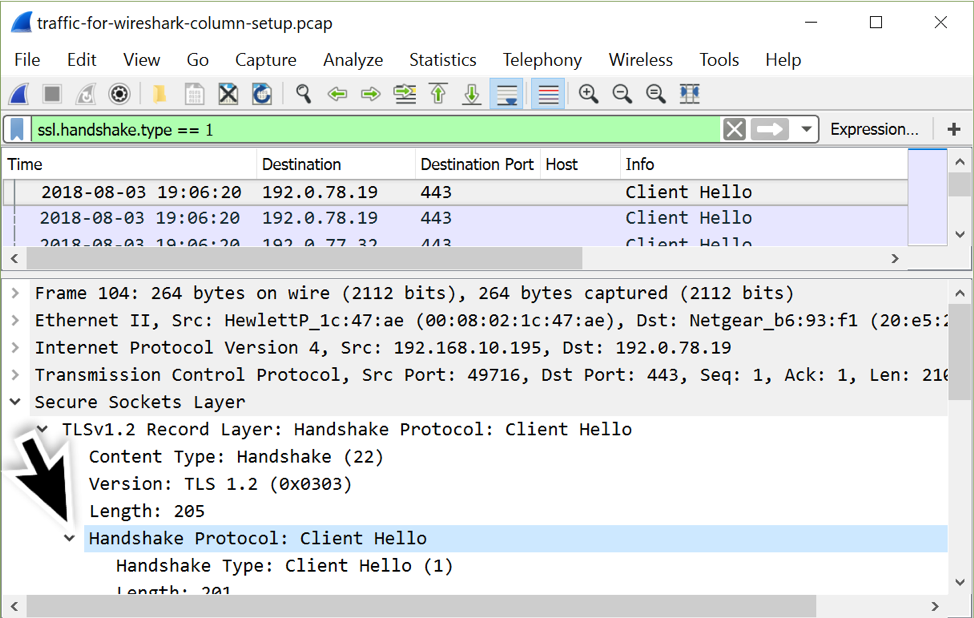
Figure 17: Filtering on SSL handshake type and working our way down.
Below the “Handshake Protocol: Client Hello” line, expand the line that starts with “Extension: server_name.” Under that is “Server Name Indication extension” which contains several Server Name value types when expanded. Select the line that starts with “Server Name:” and apply it as a column. Figure 18 shows an example.
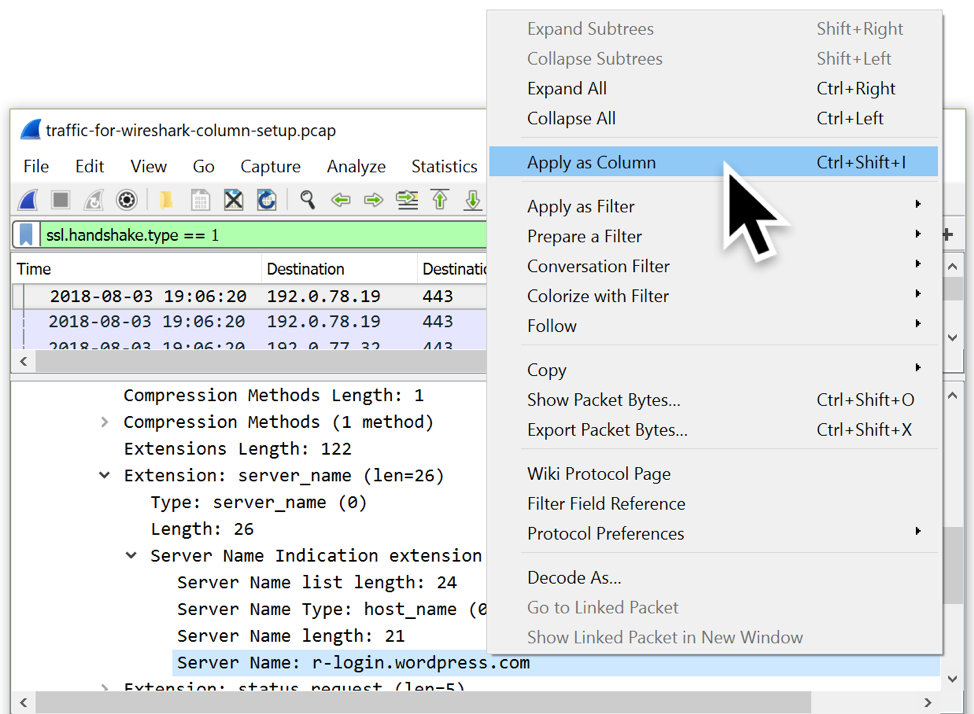
Figure 18: Applying the HTTPS server name as a column.
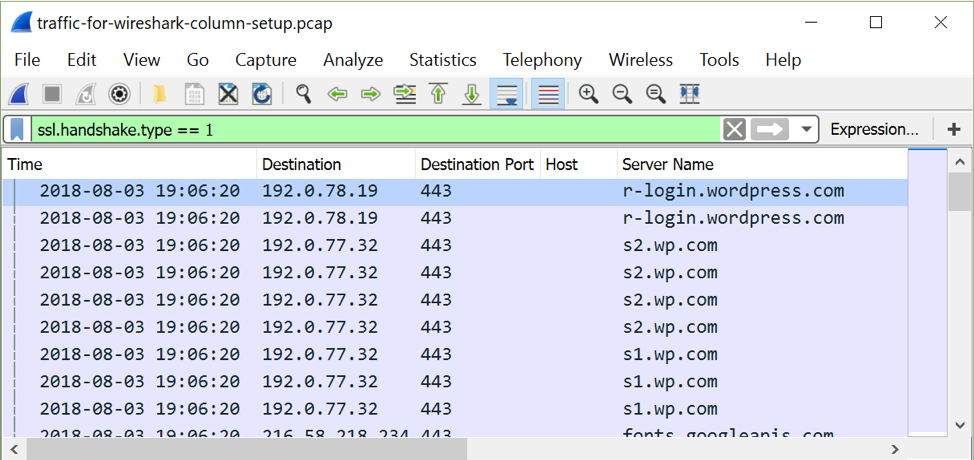
Figure 19: HTTP server names in the column display when filtering on ssl.handshake.type == 1.
With this customization, we can filter on http.request or ssl.handshake type == 1 as shown in Figure 20. This gives us a much better idea of web traffic in a pcap than using the default column display in Wireshark.
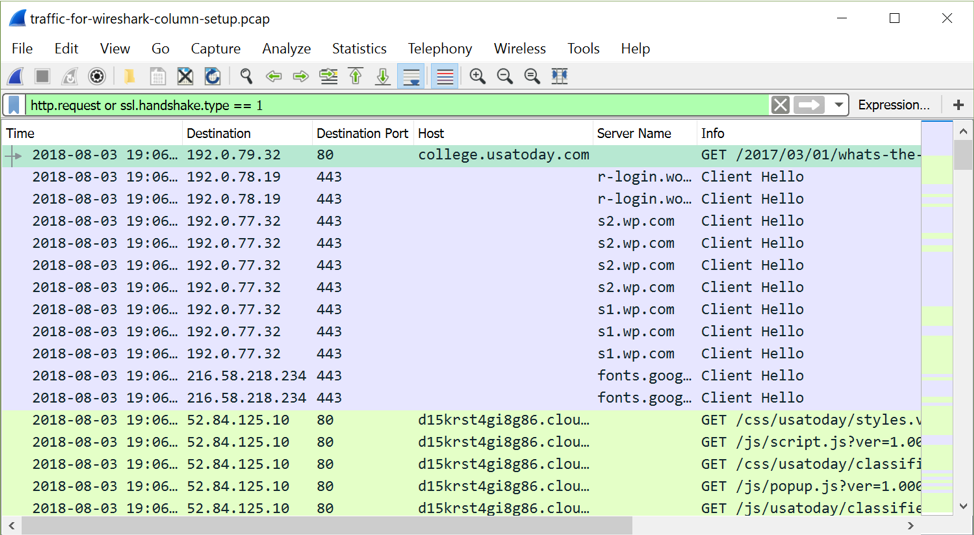
Figure 20: Filtering on http.request or ssl.handshake.type == 1 in the pcap for this tutorial.
Summary
This tutorial covered the following areas:
- Web traffic and the default Wireshark column display
- Hiding columns
- Removing columns
- Adding columns
- Changing time to UTC
- Custom columns
Wireshark customization is helpful for security professionals investigating suspicious network traffic. It can be extremely useful when reviewing web traffic to determine an infection chain. Using the methods in this tutorial, we can configure Wireshark’s column display to better fit our investigative workflow.
The post Customizing Wireshark – Changing Your Column Display appeared first on Palo Alto Networks Blog.
Article Link: http://feedproxy.google.com/~r/PaloAltoNetworks/~3/kZgLFO4PyGI/