
In the previous article of this series on cognitive biases in ecommerce, we looked at anchorage bias, confirmation bias, availability heuristic and status quo bias. There are several other biases that have an impact on the decision-making process and result in inaccurate judgement. In this article we will cover sunken cost bias, base rate fallacy and loss aversion.
5. Sunken cost bias: Sunken cost bias is a cognitive bias that refers to the tendency to continue investing in a project or endeavour based on the resources already invested rather than the potential future returns. This can include continuing to invest time, money, or other resources in a project that is unlikely to succeed.
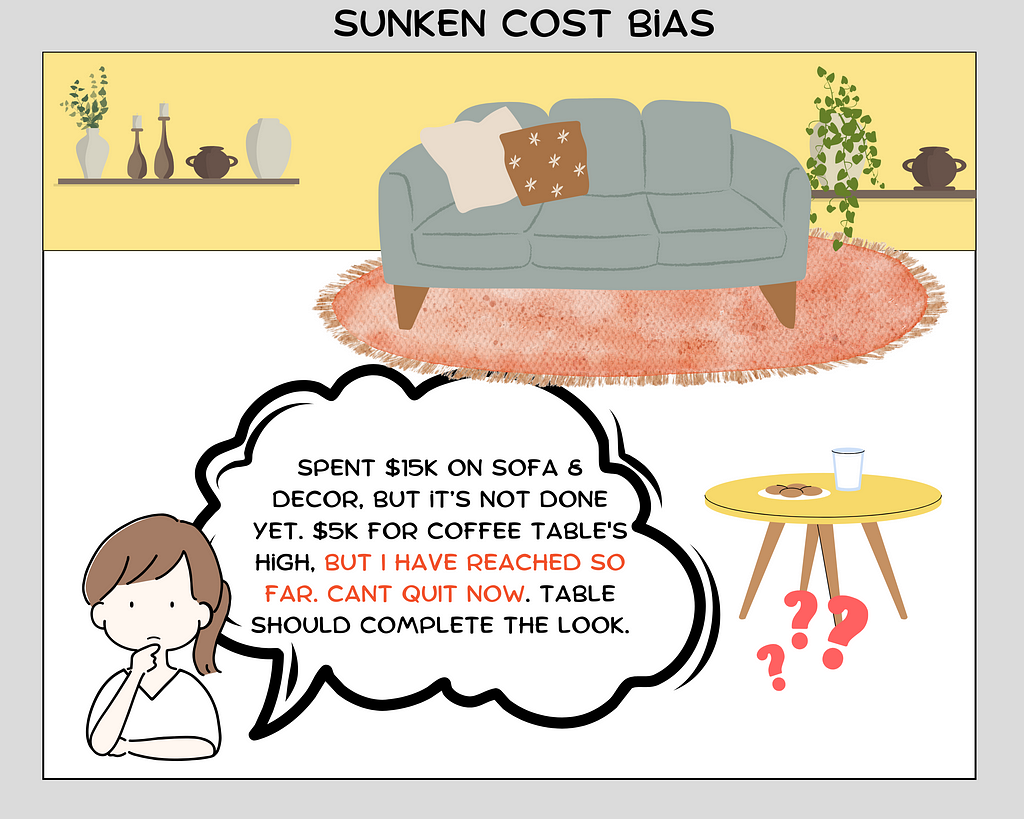
In the above scenario, the homeowner has already invested $15K in purchasing a high-end sofa and a luxurious area rug. Consequently, they are prepared to allocate an additional $5K to acquire a matching, designer coffee table to complete the desired aesthetic. In this case, their decision to spend significantly more than initially anticipated on the coffee table is influenced by their prior investment in the sofa and rug. This exemplifies the sunk cost bias, wherein individuals allow their past expenditures to impact their future financial choices.
Another example could be a marketing campaign for a new line of luxury watches. The company has spent $10 million on designing, developing, and manufacturing these watches. The initial marketing campaign with $4 million budget did not get any traction. Given that they have already invested $14 million, they decide to aggressively market the product again with $6 million more. This is a classic case of sunken cost fallacy.
The relationship between sunk costs and decision-making can be investigated using regression analysis.
Y = β0 + β1X + ε
Where Y is the proportion of participants who continue to invest in the project, X is the project’s sunk costs, β0 is the line’s y-intercept, β1 is the slope of the line, and ε is the error term. The analysis’s goal is to calculate the value of β1, which represents the change in the proportion of participants who continued to invest in the project for every unit increase in sunk costs.
The regression analysis would reveal the strength and direction of the relationship between sunk costs and decision-making. If the regression analysis reveals a positive relationship between sunk costs and the decision to continue investing, this would be evidence of sunk cost bias.
6. Loss aversion: Loss aversion is a cognitive bias that refers to a strong preference for avoiding losses over acquiring equivalent gains.
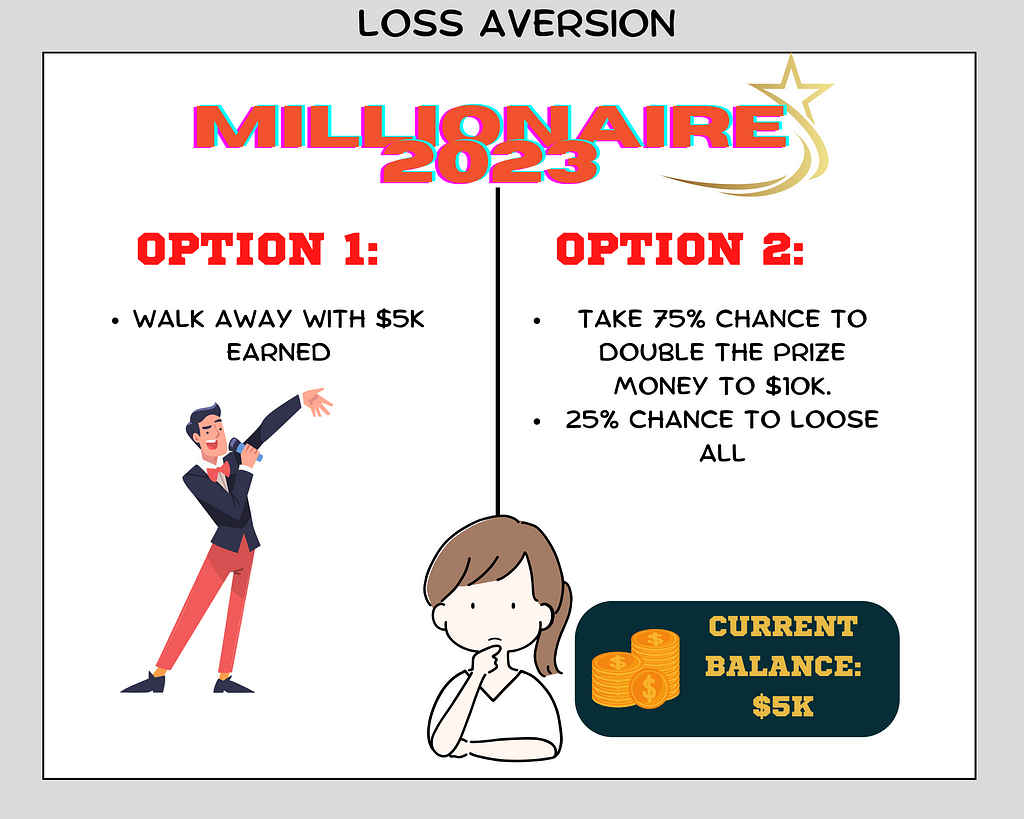
Let’s consider the above example of a game show: Asha has successfully answered multiple questions and has accumulated $5,000 in prize money. The game show host offers her two options:
Option A: Walk away with the $5,000 she has already earned, no strings attached.
Option B: Take a 75% chance to double her prize money to $10,000, but with a 25% risk of losing everything.
The expected value of Option B is $7,500 ($10,000 x 0.75 + $0 x 0.25), which is higher than the expected value of Option A ($5,000). However, due to loss aversion, Asha might still choose Option A to secure the $5,000 she has already won instead of taking the risk of potentially losing it all, even though the probability of winning in Option B is quite favourable. This example illustrates how loss aversion can play a role in decision-making, even when the chance of winning is higher, as fear of losing can lead individuals to avoid risks and choose safer options.
Here is another example — an e-commerce pharma company, selling prescription drugs is considering migrating to a faster but more expensive delivery channel. The company is hesitant to make this change as it may steer away some sales due to higher delivery costs. However, the option has the potential to be attractive to customers who value convenience. The company is more concerned with the potential loss of sales that could result from the higher delivery cost than they are with the potential gain — this is loss aversion bias. To mitigate the influence of loss aversion bias, it is important for the company to consider the potential benefits and drawbacks of the express delivery option in a more balanced and objective way. A SWOT analysis would be a good framework for decision-making in this scenario.
Loss aversion ratio: (size of a potential loss) / (size of a potential gain equivalent in value)
This ratio can be used to calculate the relative strength of loss aversion. A higher loss aversion ratio indicates that a person is more sensitive to losses than gains. For example, if the loss aversion ratio is 10:1, this indicates that the losses have ten times the emotional impact as gains of same value.
Value function in prospect theory [1]: It is a curve that depicts how people value outcomes in relation to their likelihood. The loss curve is steeper than the gain curve, indicating that people are more sensitive to losses than gains. This is because, according to the theory, people react more strongly to losses than to similar-sized gains.
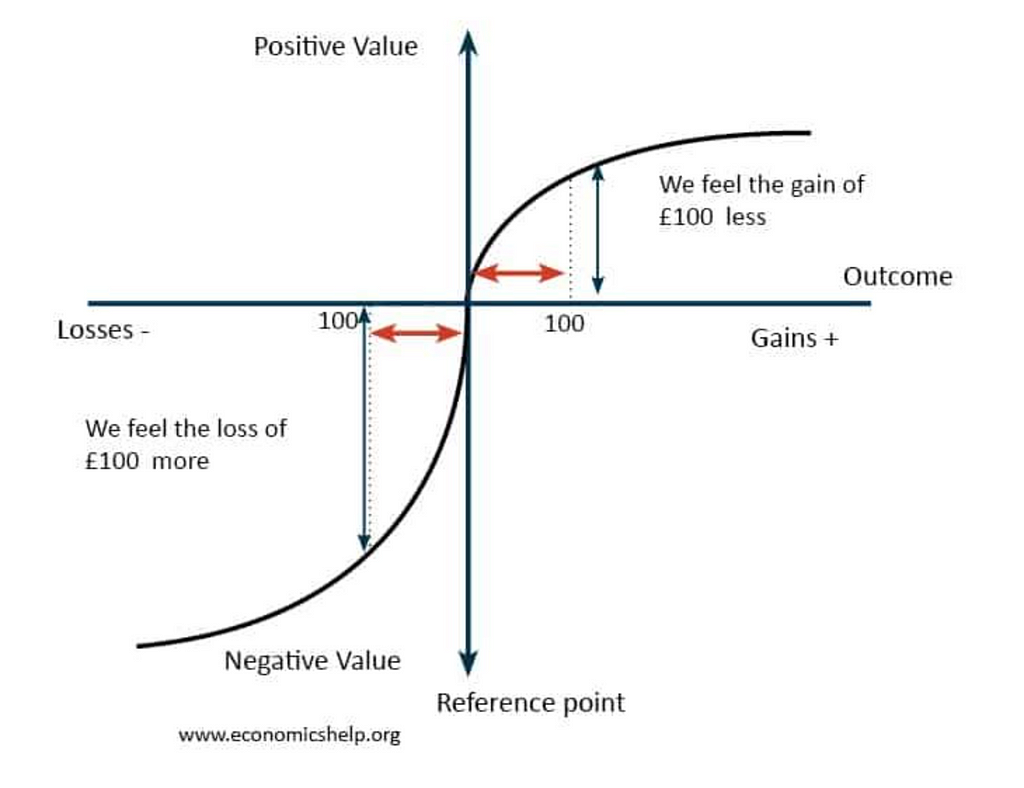
The probability of the outcome occurring is represented by the x-axis, and the value assigned to that outcome is represented by the y-axis. The graph shows that as the likelihood of a gain increases, so does the value assign to that gain. However, in gains, after a point, there is diminishing returns.
7. Base rate fallacy: This is a cognitive bias that happens when we reach to conclusions based on specific data and not considering the base rate or frequency of those events.
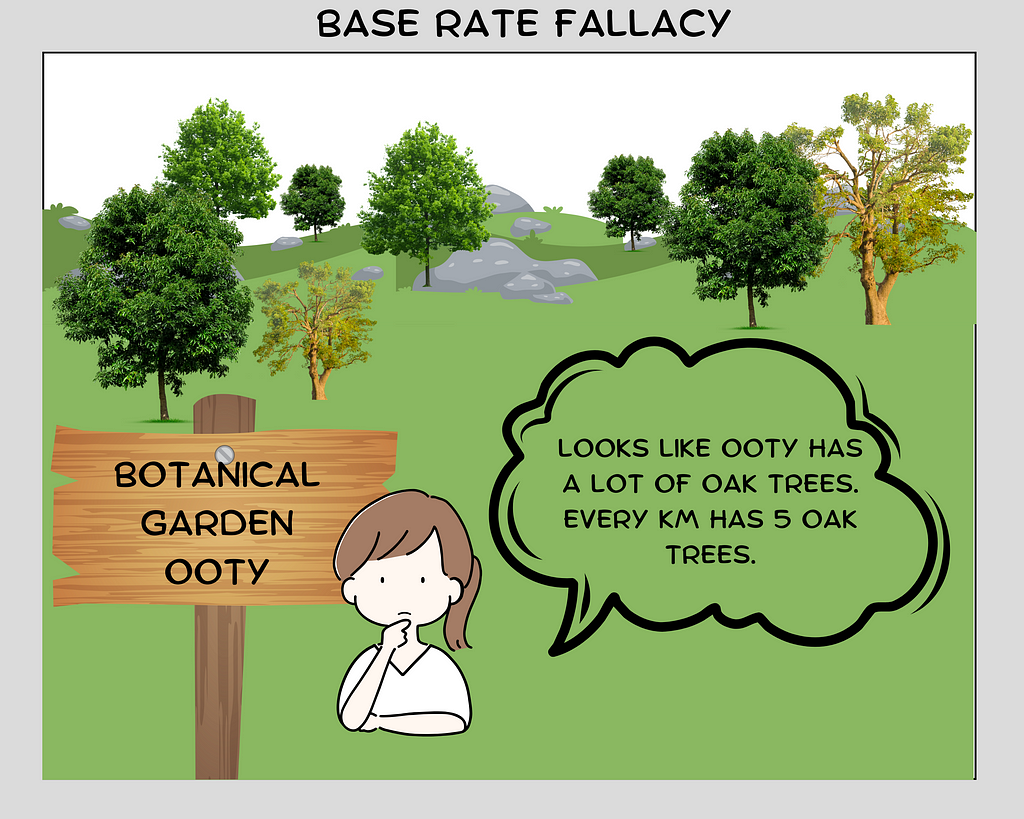
In the scenario above, a student is participating in a school tour in Ooty. The first location they visit is the Botanical Garden, known for its impressive collection of oak trees. As the student observes the numerous oak trees in the garden, she assumes that Ooty has a high concentration of oak trees, estimating that every kilometre contains approximately five oak trees. However, this interpretation is incorrect, as the student’s observation is limited to the Botanical Garden, a location specifically designed to cultivate and showcase these trees. The student has assumed the base rate of oak trees in Ooty without considering that their observation is not representative of the entire region. This leads to a faulty conclusion, which is an example of the base rate fallacy. The student’s base rate, in this case, is false due to the limited scope of their observation and lack of consideration for the wider context.
Avoiding base rate fallacy:
An analyst who is working for an e-commerce website that sells watches is tasked with identifying products in the smartwatch category that are likely to be successful in terms of generating at least one million dollars in sales. The analyst has access to data on previous sales of smartwatches, and the data shows that:
· 5% of smartwatches sold on the website generated at least one million dollars in sales (successful smartwatches)
· 95% of smartwatches did not generate that much in sales (non-successful smartwatches)
· The average number of reviews for successful smartwatches is 1500.
· 100% of successful smartwatches have positive review rate greater than 80%.
The analyst comes across a newly launched smartwatch model from the brand ‘Go-Fit’, and the product has received a positive review from 85% of customers who have purchased it and has been reviewed by 1000 customers. The analyst sees that the Go-fit smartwatch has a high percentage of positive reviews at 85% and decides that it is likely to be a successful product without considering the base rate of success for smartwatches on the website, which is only 5%. He assumes that the high positive reviews alone are enough to guarantee the smartwatch’s success and recommend the company to invest in it heavily. Let us try to solve this problem using Bayes theorem and calculate the probability of the watch’s success.
Bayes’ theorem is a mathematical formula that allows us to calculate the probability of an event happening (the ‘posterior probability’) based on prior knowledge or evidence (the ’prior probability’). The formula is as follows:
P(A|B) = P(B|A) * P(A) / P(B)
· P(A|B) is the probability of event A happening given that event B has already happened (the “posterior probability”). In this case, P (Successful|Positive Reviews, Number of Reviews, Average number of reviews for successful smartwatches, Percentage of positive reviews for successful smartwatches > 80%
· P(B|A) is the probability of event B happening given that event A has already happened (the “likelihood”). This would be P(Positive Reviews, Number of Reviews, Average number of reviews for successful smartwatches, Percentage of positive reviews for successful smartwatches > 80%|Successful)
· P(A) is the probability of event A happening (the ‘prior probability’). In this case, P(Successful) = 0.05
· P(B) is the probability of event B happening (the ‘evidence’). In this case, P (Positive Reviews) * P (Number of Reviews) * P (Average number of reviews for successful smartwatches) * P (Percentage of positive reviews for successful smartwatches > 80%)
By entering the following information:
P (Successful|Positive Reviews, Number of Reviews, Average number of reviews for successful smartwatches, Percentage of positive reviews for successful smartwatches > 80%) = (P (Positive Reviews|Successful) * P (Number of Reviews|Successful) * P(Average number of reviews for successful smartwatches) * P(Successful) / (P(Positive Reviews) * P(Number of Reviews) * P(Average number of reviews for successful smartwatches) * P(Percentage of positive reviews > 80%))
Where:
· P(Successful) = 0.05 (5% of smartwatches generate at least 1 million in sales)
· P (Positive Reviews|Successful) = 1 (100% of successful smartwatches have positive review rate greater than 80%)
· P (Number of Reviews|Successful) = 1000/1500 (1000 reviews for Go-fit smartwatch, 1500 is the average number of reviews for successful smartwatches)
· P (Positive Reviews) = 0.85 (85% of customers who purchased the Go-fit smartwatch gave it a positive review)
· P (Number of Reviews) = 1000 (1000 reviews for Go-fit smartwatch)
· P (Average number of reviews for successful smartwatches) = 1500 (average number of reviews for successful smartwatches)
· P (Percentage of positive reviews for successful smartwatches > 80%) = 1 (100% of successful smartwatches have positive review rate greater than 80%)
Therefore, P (Successful|Positive Reviews, Number of Reviews, Average number of reviews for successful smartwatches, Percentage of positive reviews for successful smartwatches > 80%) = (1 * (1000/1500) * 1500 * 1) * 0.05 / (0.85 * 1000 * 1500 * 1) = 0.12 or 12%. So, the final answer is that the smartwatch model from the brand ‘Go-Fit’ has a 12% chance of generating at least one million dollars in sales.
It is important to keep in mind that this probability is only an estimation based on the assumptions and data used in the calculation, and it should be used as a guide for decision making and not as a definite outcome. It’s important for analysts to consider both the base rate of success and the specific characteristics of the product when making predictions or decisions to avoid the base rate fallacy.
References:
[1]https://www.economicshelp.org/blog/glossary/prospect-theory/
Predictably Irrational by Dan Ariely
- Loss aversion - BehavioralEconomics.com | The BE Hub
- How Cognitive Bias in AI Impacts Business Outcomes
- 8 Bayes’ Theorem | Odds & Ends
Cognitive Biases in E-Commerce: How to Identify and Mitigate Their Influence - Part 2 was originally published in Walmart Global Tech Blog on Medium, where people are continuing the conversation by highlighting and responding to this story.