How to leverage Enterprises' Circadian Window to spot unusual activity and potentially uncover cyber threats.
If you landed here expecting to read about another fancy, supervised machine learning (label-dependent) algorithm; I'm sorry to disappoint you! You can head straight here and help yourself.
My goal is to help and inspire product teams and fellow practitioners to start using baselines in their SIEM/XDR platforms while keeping it simple.
 Franz Halberg coined the term “circadian” (from Latin: circa diem, meaning “around a day”).
For those following this blog long enough, you know that I'm a huge fan of leveraging data analytics as input for threat detection:
- Turning atomic alerts into alert sessions (alert clustering)
- Summarization as a primary detection rule component
- Using unsupervised machine learning to spot rare events
- Leveraging anomaly indicators as input for detection models
So in case you haven’t realized yet, let’s make it crystal clear:
To successfully engage SOC and IR teams, an alert must contain easily digestible behavioral insights originating not from one (atomic) signal but multiple ones.
Every aggregated signature should include its local prevalence within the environment, enabling analysts to quickly assess how unusual a scenario actually is.
While string matching remains a very valid technique, it’s nowhere near sufficient given the sheer volume and complexity of data generated by modern SIEMs and detection systems today.
How to capture those behavioral traces as input for anomaly detection?
With that in mind, let’s dive into the topic and explore a simple yet effective approach for incorporating baselines into your Detection models.
Anomaly Detection & Behavioral Analytics
To start off, there are a few important concepts we need to get across before exploring the topic of baselines.
Anomaly Detection focuses on identifying deviations from an established baseline, flagging events that are statistically rare or unusual.
Behavioral Analytics, on the other hand, analyzes patterns over time to understand normal user or system behavior.
The topic of Behavioral Analytics is very broad and encompasses a wide range of techniques and technologies used to analyze system (and human) behaviors across various domains, including cybersecurity.
So while anomaly detection may rely on a baseline to spot anomalous events, the baseline itself is a product of behavioral analytics.
What is a baseline?
A baseline is the “normal” or expected pattern in data, used as a reference to detect changes, trends, or anomalies.
How is it represented?
In most cases, it's a numerical representation.
It can go from a simple control or reference value such as a static number; to dynamic trend lines or statistical ranges. For example, according to WHO, the normal blood glucose level range is between 70–100 mg/dL.
A baseline is not only in numerical form, it can also be represented as a list of categorical values, which is known as a categorical baseline.
 An "allowed list" can also be seen as a baseline.
For example, in highly restricted computer environments like the military, only a predefined list of applications may be allowed.
Such list isn’t created out of thin air — it results from data analysis, which identifies needed applications. This is yet another form of a baseline.
Without stepping into Predictive Analytics, when Netflix makes recommendations, it uses ML models that analyze your activity to create a Behavioral Profile — essentially, a predictive baseline of your preferences.
How that applies in Cyber?
There's an infinite number of baselines possible if we go beyond numerical form when focusing on cyber security.
The key is to identify relevant entities and their attributes for a given scenario. Further in this article we will explore one use case.
Now, considering a SIEM and the constant influx of logs, how to keep a baseline up to date? That's when data analytics comes into play.
Baseline Design & Preparation
Before using baselines, you first need to design them properly — and that’s the first challenge. Just like any SIEM use case, it must be built on a well-thought-out concept before deployment.
Is Data Literacy enough?
As you'd expect, domain knowledge is essential for understanding the business or activity reflected in the logs before anything else.
The subject matter expert has deep knowledge of the business and operational context, enabling accurate log data interpretation and providing critical insights for effective analysis.
For instance, to determine what is a good baseline for diagnosing diabetes, you likely need experts in endocrinology and medical research — not only data analysts or statisticians!
Back to cybersecurity, analyzing users’ DNS logs is straightforward if you understand name resolution. However, fully grasping a web application’s behavior solely through its logs can be far more challenging.
So before leveraging baselines everywhere, consider understanding beyond the data (logs) and the real-world context that shapes them, including business processes, user behavior, and operational dynamics.
Why focusing on what’s unusual or rare?
Since malicious events do not occur as routinely as ordinary ones, it’s logical to scrutinize unusual or rare occurrences for signs of trouble.
Want another clear example of a categorical list? An IOC list is also considered a sort of special baseline for what is known to be bad.
The problem is, we don’t always know what bad is!
Besides, the quality of Threat Intel input is sometimes questionable. For instance, don't be surprised to eventually spot 127.0.0.1 in your lists!
 Despite the focus on false-positives, the worst mistake is in a false-negative!
So what if we could simply spot the new without flagging it as good or bad?
That’s basically done by collecting what is known in a baseline and comparing it to newly collected values.
Rare x Anomalous Events
A rare event is simply uncommon while an anomalous event deviates from expected patterns in a way that may indicate a problem.
Example: A user logs in at 3 AM (rare, but might be normal for a night-shift employee). However, if the same user suddenly accesses critical admin systems (jump/bastion host) they’ve never used before, that’s anomalous.
An anomaly is contextually unusual and often requires additional factors like behavioral deviation or risk indicators to be meaningful.
Example: A server rebooting once in six months is rare but expected for maintenance. However, if the server reboots ten times in an hour, that’s anomalous and may indicate a security or system failure.
In summary: you basically need additional context on top of a statistically rare event to potentially call it an anomaly.
And before you ask: ⚠️ Not all rare or anomalous events are alert-able! ⚠️
In threat detection, extra context comes from any signature, behavioral, CTI indicators we can combine with such rare or anomalous signal.
The idea is that querying a baseline enhances detection logic by providing valuable context, rather than acting as the sole trigger for an alert.
What's a Circadian Window?
The Circadian rhythm refers to the natural processes that regulate the sleep-wake cycle which repeats itself approximately every 24 hours.
The term was coined by Franz Halberg and comes from Latin circa diem which means “around a day”.
 Enterprise Networks: How hard is it to spot changes over a 24h window?
So I'm simply borrowing the terminology here. But why is that relevant?
Once you have established a baseline, you need to determine a window of time for collecting candidates to compare against the norm which will potentially uncover unusual activity.
That window of opportunity is essentially a Circadian Window — the optimal time frame needed to detect meaningful changes in monitored enterprise networks and systems.
In other words, we must identify new candidates with no match in the baseline to classify them as potentially unusual or anomalous — a process driven by inspecting the near real-time log stream.
Time plays a crucial role, as the scheduling strategy also determines when a newly observed record is eventually incorporated into the baseline.
Detection Use Case: DCSync Attack
With that in mind, let's start crafting a detection prototype and a baseline targeting a known attack against Microsoft’s Active Directory (AD).
That's perhaps not the best example, but it's a very simple one to get the idea across without requiring advanced analytics.
The goal is to spot potential traces of a DCSync Attack aiming at a friction-less method, without requiring any whitelisting or exception handling.
A DCSync attack is a technique employed by malicious actors to exploit Microsoft’s AD replication feature by mimicking such activity to gain access to user accounts info and password hashes.
 Image credits: https://medium.com/@urshilaravindran/
Turns out, whenever this activity happens, there's likely Windows logs generated via Event ID 4662 — An operation was performed on an object, which can be used to build a baseline and a detection.
Sigma Rule as the main indicator
In the article mentioned above, it also lists a Sigma rule. However, just like most atomic indicators, it's prone to many false-positives.
Why you may ask? Because the logs simply indicate when a directory replication activity occurs, not when an actual attack occurs. That's not an unusual activity but a very expected one!
 https://github.com/mdecrevoisier/SIGMA-detection-rules/blob/main/windows-active_directory/win-ad-replication%20privilege%20accessed%20(SecretDump%2C%20DCsync).yaml
For that we need more indicators to increase the chances of spotting an actual attack, hence the use of a baseline and additional context.
Remember I spoke about prevalence? If you consider the Sigma alert as an indicator, the prevalence will come from a baseline check.
Note that I'm not bashing on the Sigma project which is, by far, the #1 repository for detection code (or rather, prototypes) available today.
My point is detection engineers need to be mindful about how they actually consume and implement those queries. This probably deserves another blog post but hopefully you get the point.
Use historical events to estimate alert volume (and to hunt!)
This should be mandatory for every new detection in your environment.
Not only does it provide clear red flags indicating the new idea needs refinement but sometimes this exercise is a threat hunt on itself.
If you deploy the code as-is, with level=high despite its experimental status, it suggests the output should trigger high-severity alerts.
However, that's very unlikely, and unfortunately, what most unwary teams will do, leading to unrealistic expectations and overall disappointment.
Considering a medium size, enterprise environment with a dozen Domain Controllers (DCs), here’s what you can expect:
 Last 30 days worth of events matching the Sigma rule on a medium size AD. How to spot "User2" (compromised account) without using hard-coded user exception lists but leveraging Security Analytics?
Now, scale that up by hundreds in a large scale environment with 20+ DCs and many applications and products integrated with AD. There will be many benign service/generic accounts popping up in a periodic basis.
Applying regular exception handling or detection code fine-tuning in that scenario is not suitable, if not, unmanageable, since exceptions will need to be reviewed or updated right after every benign alert!
How can you leverage that detection prototype without its alerts contributing to alert fatigue? This is where baselines come into play.
Adding the 'baseline' component
Here I am going to highlight the thought process behind the creation of an improved version of the Sigma rule prototype to detect DCSync Attacks.
The idea is to combine the know traces (atomic indicator) plus additional behavioral context, increasing the chances of catching a potential threat.
Links to copy-pasteable queries shown here are provided in the end.
The Baseline
A baseline is just another dataset or database which can be persisted on disk for easier consumption. The method used here (Splunk) can be easily replicated and applied to multiple SIEMs and other Data platforms.
The idea is to run a periodic search job, in Splunk known as a scheduled Saved Search, and collect the user and machine accounts (entities) performing directory replication in the monitored environment.
That special search query has the following attributes:
- Runs daily, scoping on events from the previous day.
- Aggregates events by account (SubjectUserName).
- Appends those events to the current baseline snapshot.
- Discards results no longer relevant based on their age.
The update mechanism is detailed in an article I wrote earlier that applies to the creation and update of any lookup-based baseline. Basically, the baseline's tail constantly gets trimmed while still growing in overall size.
The Salamander method: How to maintain dynamic Splunk Lookups
How the baseline search query looks like in this case?
 Search job is responsible for both adding new and removing old entries from the baseline (lookup file).
The macro 4662_directory_sync_events points to the index containing the relevant log events, filtering in only the three relevant GUIDs referenced in the Sigma rule, part of the Properties field.
At line 11, it's where records are aggregated per account while the last day seen (timestamp) is kept.
Also, note that records older than 90 days are removed so that the lookup table doesn't grow too big which to prevent system resources impact.
Once that job is executed against the last full day (check earliest/latest values in the previous image), below is what the output should look like:
 Baseline search results, saved into dcsync_baseline.csv lookup file.
It contains 3 columns (fields):
- SubjectUserName: the user or machine account, in lowercase, that was responsible for performing a directory replication operation.
- last_day_seen: the timestamp of the last day each account entity was seen performing the activity.
- type: the type of the account, user or machine.
The Detection Rule
The detection rule is the primary baseline consumer. The main features we are willing to have in the detector are outlined below:
- Schedule: run against near real-time events every 30 minutes.
- Scope: “4662” eventlogs referenced in the Sigma rule.
- Throttling: suppress alerts from same account for next 24h.
- Indicators / Checks / Qualifiers:
1. Is the attack originating from an account not seen before?
2. In case it’s a user account, does it match any common naming standard for high privilege accounts (Domain Admins, etc)?
3. In case it’s a machine account, does it contain any traces or attributes of a potential, newly added Domain Controller? - Aggregation: aggregate alerts by the user/machine account.
- Enrichment: provide additional context around the new, unusual spotted account such as role, group membership, etc., which can also be done post-alert, not in the detection pipeline (ex.: SOAR).
Note that 4.1 is achieved by basically checking the baseline, while 4.3 is optional but since we are here, also checking for potential unknown, stealth methods that could leverage high privilege machine account abuse.
Following the idea, the detection rule should look like below:
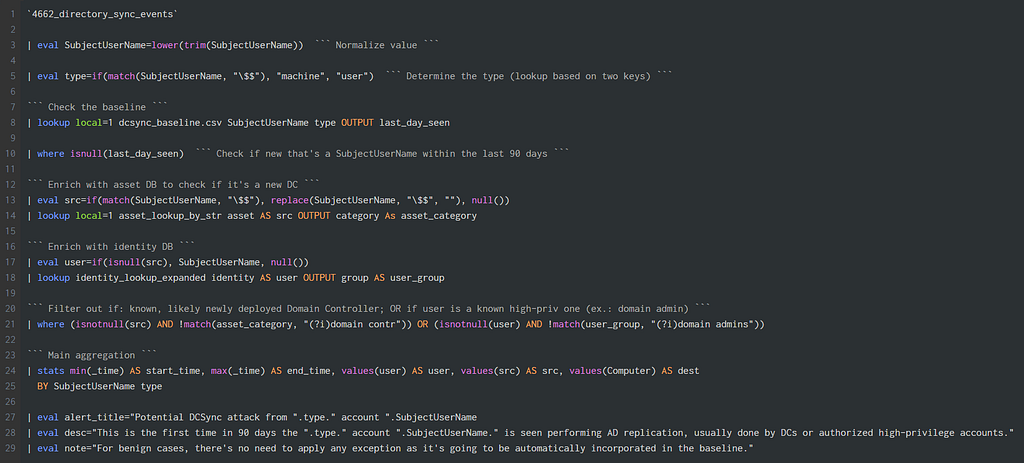 The detection code: runs every 30 minutes within the window of opportunity (24hs) after the baseline is updated.
At line 8 is where the baseline is queried and right after, at line 10, that's where a newly seen account performing an AD replication is spotted.
After line 21, only unusual, highly relevant results will continue to be evaluated, finishing with the main aggregation command (stats).
In summary, here's what's achieved with those two queries:
- Every day, given 24-hour Circadian Window after the baseline is updated, newly seen, unusual accounts performing directory replication will be spotted and an alert might be fired.
- In case an account is found in the baseline, it's automatically ignored. Same happens even if it's not found in the baseline but it's either a new member of the domain admins group or a new domain controller.
- And the best feature: In case the alert turns out to be benign, there's absolutely no need to add or modify any piece of code given that:
1 — Upon the next baseline update, previously alerted accounts are automatically incorporated into the baseline, and therefore won’t be alerted in the next 24-hour cycle.
2 — The throttle mechanism prevents an alert from firing again within the next 24h given that the same SubjectUserName value is seen.
Final Considerations
There are many aspects to explore from this simple example. I am listing a few below so it gives you more food for thought.
I) Detection Rule x Detection Models
That was a simple example. Consider the baseline mechanism evaluation as just another atomic indicator. It can be used in a detection model as input for an overall alert score.
In the alert session below, where a new RAT/RMM is spotted, every single indicator has a baseline mechanism, there's not a single signature-based one. When combined, they strengthen the anomalous signal:
 Custom detection model aggregating multiple indicators into a single alert session, details here.
II) You can leverage Baselines in many detection use cases
From tracking suspicious web sessions via proxy logs to detecting anomalous sign-ins in cloud or VPN authentication logs, and identifying unexpected PowerShell commands from high-privilege accounts, the possibilities for baselines are endless.
III) Engineering is about Cost x Benefit
Do not start creating baselines for everything. That needs to be evaluated on a case by case. There are baselines that can be queried to satisfy the goal of multiple distinct indicators (1-to-many) but they require more modeling.
IV) Ephemeral Baselines for Threat Hunting
Also, consider that baselines can be defined inline as part of a Threat Hunting query without the need to persist them on disk. An example here:
Beyond IOCs: Contextualized Leads from Analytics-Driven Threat Hunts
The queries can be found in this Gist. Let me know your thoughts on this approach. If you already use a similar method, I’d love to learn more and exchange ideas!
Written by Alex Teixeira
My new stories are public in the first 24h after publication. So don’t forget to subscribe to get notified when new content comes out!
Baselines 101: Building Resilient, Frictionless SIEM Detections was originally published in Detect FYI on Medium, where people are continuing the conversation by highlighting and responding to this story.
Introduction to Malware Binary Triage (IMBT) Course
Looking to level up your skills? Get 10% off using coupon code: MWNEWS10 for any flavor.
Enroll Now and Save 10%: Coupon Code MWNEWS10
Note: Affiliate link – your enrollment helps support this platform at no extra cost to you.
Article Link: Baselines 101: Building Resilient, Frictionless SIEM Detections | by Alex Teixeira | Feb, 2025 | Detect FYI