The Flare-On challenge is the Olympics for reverse engineers. This year, while celebrating the 10th sequel of the event, the organizers set “a new standard for difficulty and creativity” (words from last year’s challenge solutions). As a long-time player, I was very excited to complete all challenges in just over a month.
In this write-up, I will discuss two challenges (5th and 13th) and share how Binary Ninja can easily tackle obfuscated code. I will put more focus on the obfuscation rather than the validation algorithm. If you wish to read full write-ups, I recommend you refer to the official solutions published by Mandiant.
Thanks to Mandiant and the Flare-On team for another great event!
5th – where_am_i
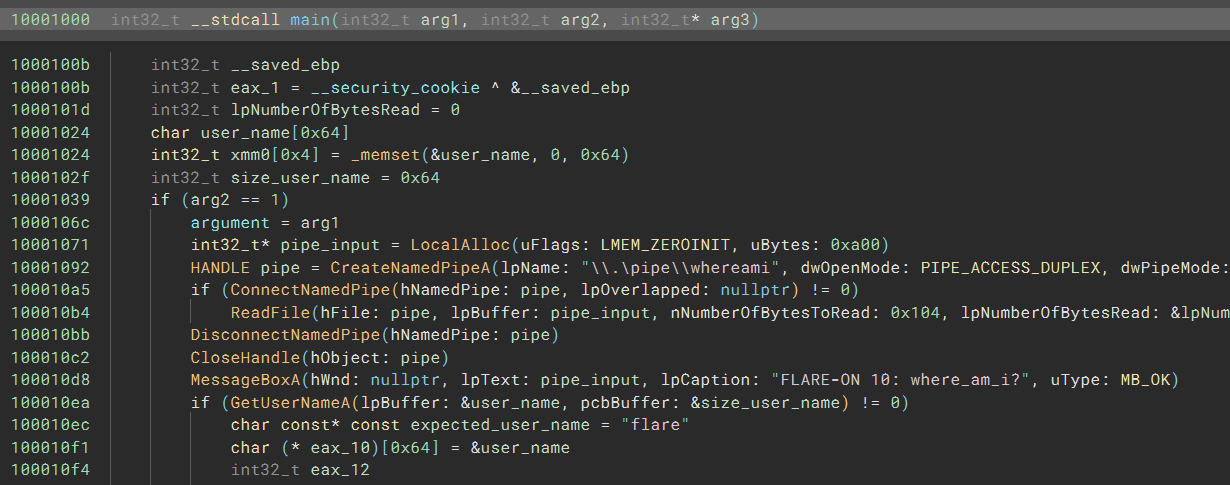
The first challenge we’ll take a look at is the fifth of the thirteen challenges, where_am_i.
Fixating the Addresses with TTD Record/Replay
The first problem I encountered was that the binary had a blob that was decrypted and executed at runtime. While it is easy to follow the decryption routine, dump the decrypted code, and then analyze it, the address of the allocated buffer could vary on each execution. It is thus hard to debug the decrypted code since previous breakpoints would be off.
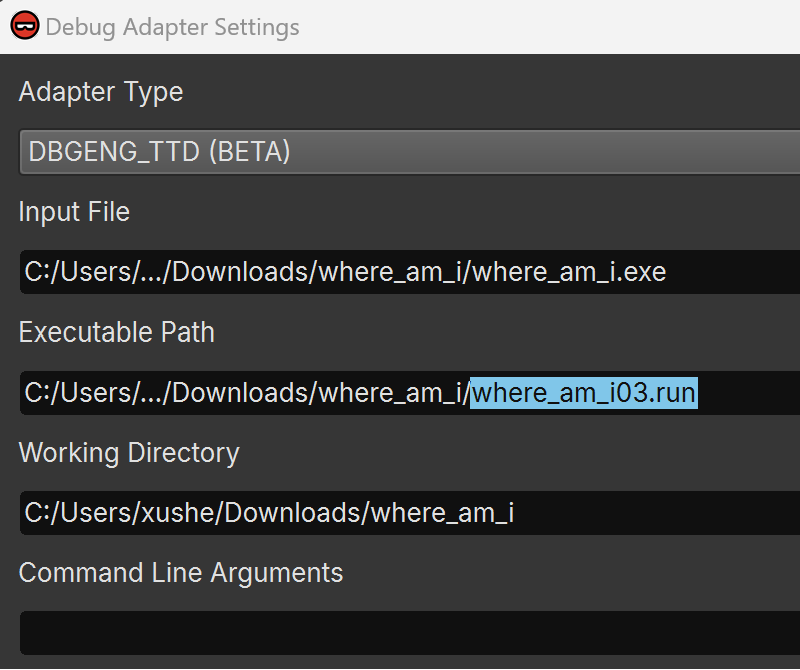
To address this, I leveraged WinDbg TTD (time-travel debugging) to record an execution trace and replay it within Binary Ninja’s debugger. Please refer to our TTD documentation for a setup guide. The main difference from normal debugger usage is that you need to select a different debug adapter, DBGENG_TTD(BETA), and set the *.run replay file generated by WinDbg as the executable path:
Now, I have a deterministic debugging experience where the addresses never change. Also, if I miss a breakpoint or step over when I should step into, I don’t need to restart the target but can rewind instead.
More importantly, combining BN with the TTD in WinDbg as opposed to just working with the trace in WinDbg, I can see the beautiful control-flow graph and decompiled HLIL when I explore the trace. It can help me discover important things in the code, and the next section is a great example.
Where is the RC6?
If two Binary Ninja users discuss the Flare-On challenge this year, the word “RC6” will pop up. In fact, in challenge 5, RC6 is used to decrypt the final flag. However, its existence is not apparent because the code is encrypted and obfuscated.
The good news is, if you are using Binary Ninja to replay the TTD trace, it would be trivial to spot it. The following HLIL has a constant 0xb7e15163 in it, and a Google search will tell you it is used in the RC6 algorithm.
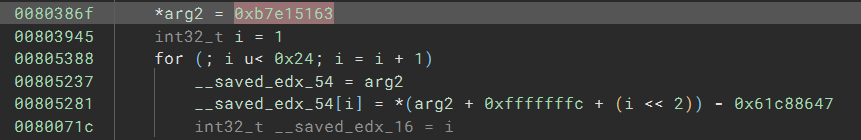
That is fairly straightforward so how could someone miss it? We see why it can break other tools once we look at the disassembly. To start with, the disassembly lines that correspond to the HLIL look like this:
00803854  mov     eax, 0x647ec874
00803859  add     eax, 0x7a01dd58
0080385f  sub     eax, 0xb9de3a69
00803865  xor     eax, 0xdb5d94bf
0080386b  mov     edx, dword [eax+ebp {var_28}]
If you are into software obfuscation, this common technique is called constant unfolding. As its name suggests, it is the opposite of constant folding. So, instead of simplifying integer calculations, constant unfolding obfuscates the integer constants used in the code by calculating them using a series of arithmetic instructions. In this example, eax is first assigned a constant value, and then goes through the add, sub, and xor instructions, whose effects are all deterministic. In the end, eax will always hold the constant value 0xffffffdc, which we can verify using the get_reg_value_at API:
>>> current_function.get_reg_value_at(0x80386b, 'eax')
<const 0xffffffdc>
Now we see this assigns the value of a stack variable var_28 (at offset 0xffffffdc, or -0x24) to the register edx. Handling the obfuscation is crucial here since otherwise the analysis will lose track of the stack variable. That said, how does Binary Ninja know its actual value?
If we scroll up a bit, we see var_28 is being assigned a constant value. Again, the value is obfuscated in the same way.
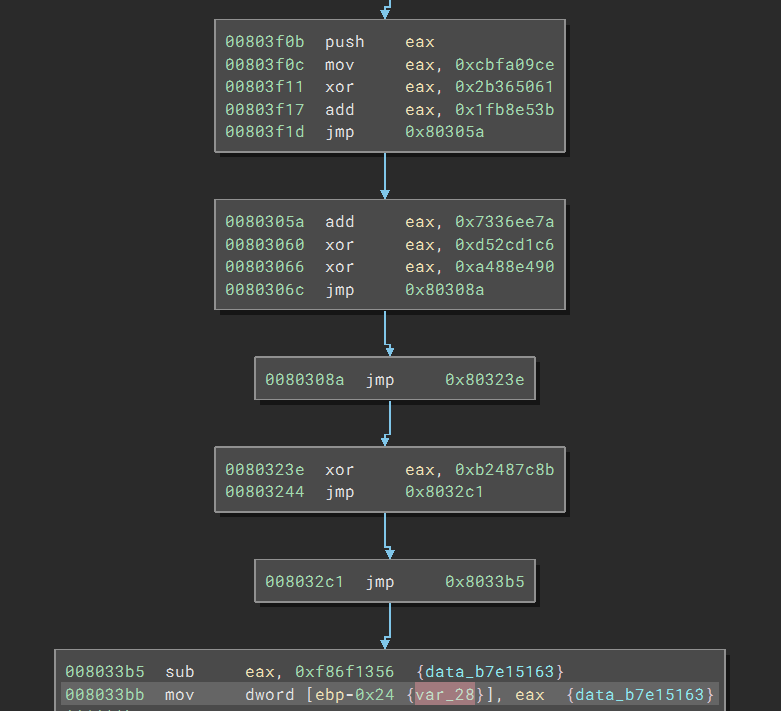
We can retrieve its value using this command:
>>> current_function.get_reg_value_at(0x8033bb, 'eax')
<const 0xb7e15163>
Binary Ninja does all this magic behind the scenes. It uses constant propagation to simplify such calculations automatically and presents the final result to the user. This is a huge advantage over other tools as I have heard other players spent considerable time writing scripts to deobfuscate the code.
As a note, the challenge also used the RC4 algorithm, but for a different purpose. It is also easier to recognize and did not cause a major issue among players.
Fixing the PE header
Once the code decrypts the shellcode buffer with RC6, it injects it into another process. The entry point of the shellcode is a few hundred bytes from its start, and the first thing it does is search backward for two magic integers, 0x43f1 and 0x3713:
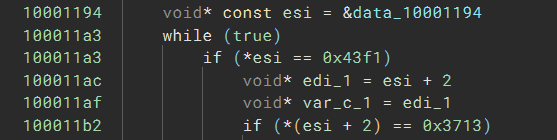
Looking at the start of the buffer, we can see both values at the beginning:
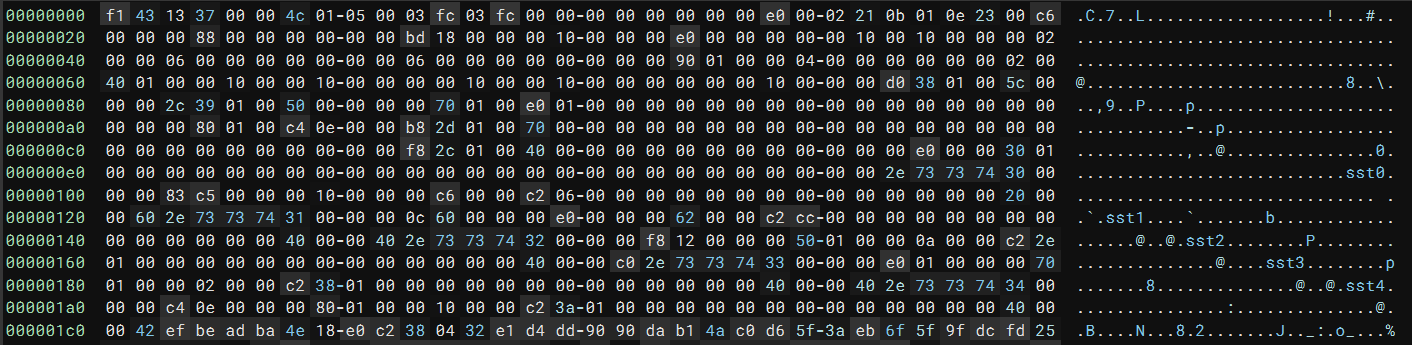
Additionally, the .sst0 strings below look like section headers of the PE file. I skimmed the remaining code and realized this is a modified PE file! The code parses and loads it into the memory space. Now, the task is to fix it so that Binary Ninja can load and analyze it.
I first fixed the magic value with MZ and PE. Then I modified the value at 0x3c to 0x2, where the PE header lies. The changes look like this:

It is non-standard since the DOS header overlaps with the COFF header, but it does not matter since PE files no longer use the DOS header. After the fix, Binary Ninja can recognize the input file as a PE file and analyze it just fine:
For more information on this parse, check out our open-source binary view implementation. For example, the code that (preliminarily) checks whether an input file is a valid PE file can be found in function PEViewType::IsTypeValidForData.
13th – y0da
y0da is the last challenge, and not surprisingly, it brings some challenging obfuscations. The code seems enigmatic initially, but thanks to Binary Ninja’s superpower, we can fix it until the HLIL appears not obfuscated at all.
Reading Stack Strings with ease
Upon opening the file, I quickly noticed the obfuscation. In a large function, I see the code with the following pattern:
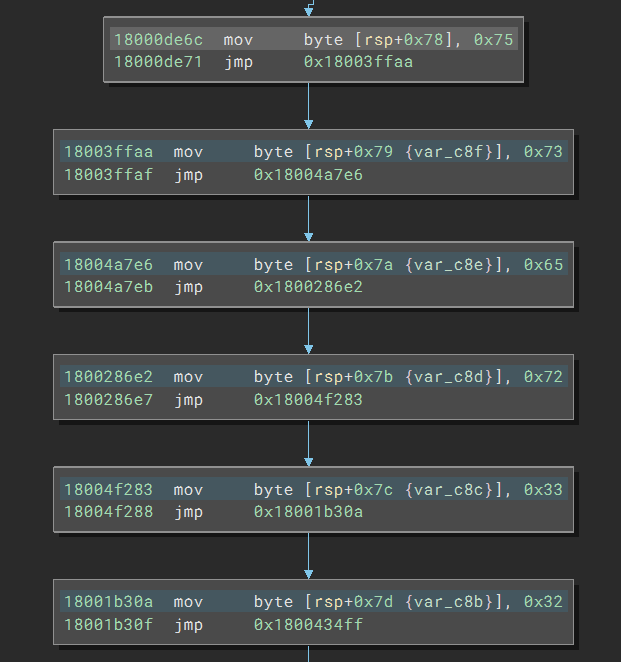
The code creates a stack string, a common technique to obfuscate strings. However, the code inserts a jmp instruction after every single instruction, creating many more basic blocks compared to the case where these instructions are consecutive. The redundant jumps are not a problem for Binary Ninja since it keeps track of the basic blocks and automatically combines them during decompilation. And even better, thanks to the recent automatic constant outlining feature, the strings will be presented in a much more readable format:
![]()
Disable Tail call analysis
Scrolling down a bit, I started to notice something else wrong:
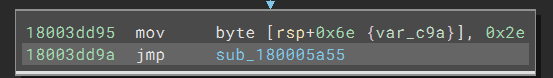
In particular, the code is still preparing a byte for a stack string, but after that, Binary Ninja treats the jump differently. Instead of following the jmp in the current function, it creates a new function at the target. If we double-click the address to navigate to the function, we see the code still has the same pattern:
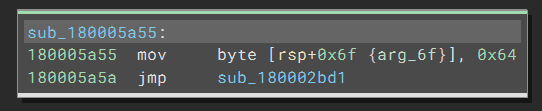
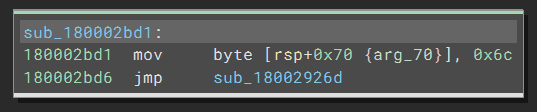
Now that the semantics of the code are still correct, the readability is destroyed: the same pattern repeats thousands of times, and we have no easy way to follow it. So what is happening here?
Binary Ninja treats the code pattern as a tail call. Our heuristic is great for compiler-generated code, but in this case, it is wrong. Luckily, Binary Ninja is flexible enough that we can fix the issue by skipping tail call analysis. Specifically, find the “Tail Call Heuristics” (analysis.tailCallHeuristics) and “Tail Call Translation” (analysis.tailCallTranslation) settings, uncheck them, and then re-open the file. Now, the jumps are all disassembled as-is, and we get a long function with 2,457 basic blocks.
Although this is quite a large function, Binary Ninja graphs and decompiles it just fine. Upon closer examination, most of the basic blocks create the stack strings, and the longest stack string is just ASCII art that is printed on the program launch. Here, a recommended optimization is to patch and remove these. I chose to patch the code right after the first such move, directly to the last such move, which pushes down the number of basic blocks to 501. This is super easy in the UI as you can just select the disassembly line at 0x180006cdb, press E to bring up the “edit instruction” editor, type jmp 0x180033096 in it, and hit Enter.
Disable Linear Sweep
Now that the tail call issue is fixed, I soon saw another issue: there are many more functions than there should be. For example, the function at 0x180014d24 which resolves an API based on a hash value is cross-referenced more than 500 times. However, few of them are unique. There is a basic block that calls the target function, and the basic block belong to many functions. Among them, there is probably only one actual function, and the other ones are caused by obfuscation.
Note that the fake functions are not called or cross-referenced from anywhere in the binary. Binary Ninja discovered them in the first place due to linear sweep, a common technique disassemblers use to increase code discovery. However, in this case, it is causing a problem and we can fix it by disabling the “Autorun Linear Sweep” (analysis.linearSweep.autorun) setting. Note, if you have already saved a database, the functions previously discovered by linear sweep will not go away – to get a clean list of functions, one shall re-open the .exe file with “Open With Options” to specify that custom setting and allow Binary Ninja to redo the analysis from the beginning.
This will leave us with those functions explicitly called in the binary, with the number of functions down to 12. The API resolver function is referenced 35 times, and both are reasonable numbers.
Fixing up the Stack
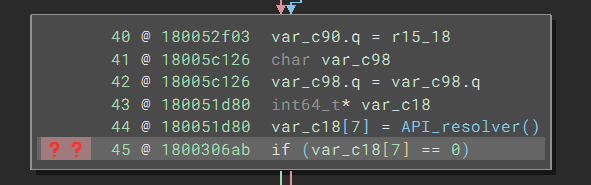
Even with those two fixes, the code can still be made easier to read. In particular, we see many red question mark tags left of the code:
Hovering the mouse over the tag, I saw a popup that told me that there was an “Unresolved Stack Pointer Value.” I switched to the tags sidebar and noticed I have a handful of the same cases:
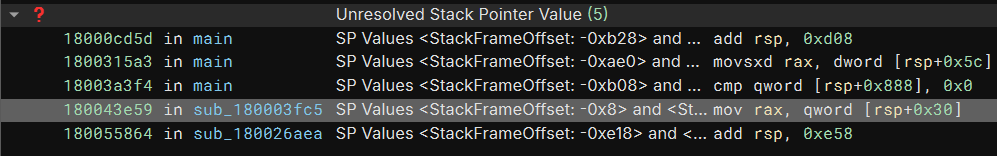
Here’s one case at 0x180043e59:
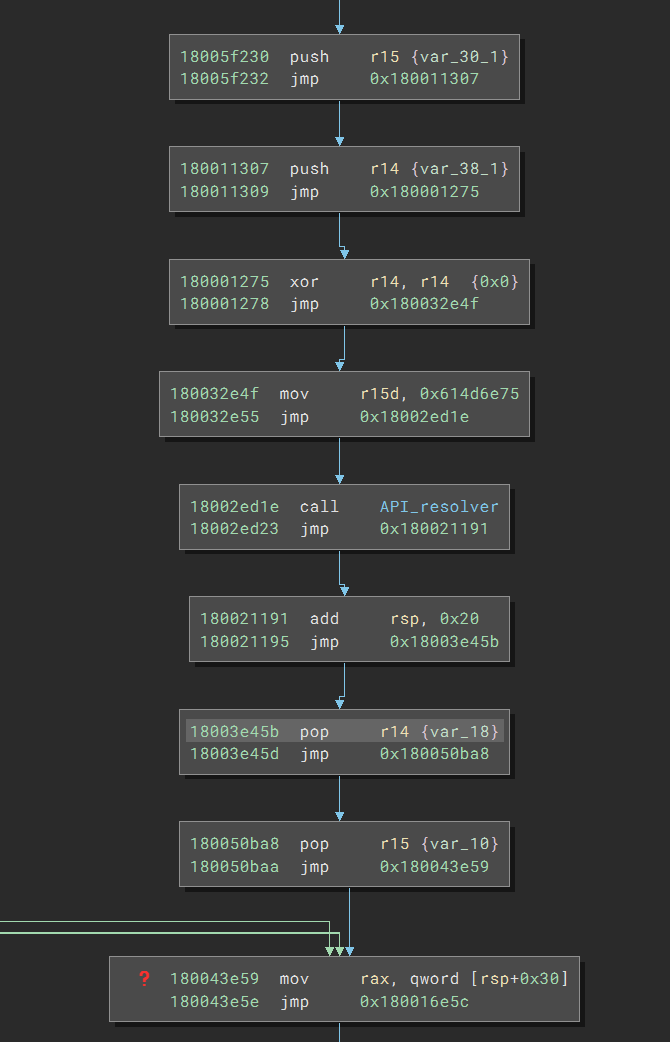
The tag content states:
SP Values <StackFrameOffset: -0x8> and <StackFrameOffset: -0x28> are valid but failed to merge. Check incoming LLIL block edges for mismatched values.
With the help of the message, I realized that the stack pointer was getting different values after the branch merge. In this case, three branches arrive at 0x180043e59. Two (not shown) do not adjust the stack pointer, but the one called API_resolver does. As a result, the stack pointer values are different, and Binary Ninja cannot figure out which one is correct and cannot track the stack variables reliably.
Looking at the API_resolver branch, the code first pushes r14 and r15 onto the stack but later pops them up, so it does not affect the stack. The things left are a call to API_resolver and an add rsp, 0x20 after it. It appears that the function API_resolver will occupy 0x20 bytes of the space on the stack, which gets cleared by the add instruction.
The last piece of the puzzle lies at the end of the API_resolver function. It has an indirect call where the value of the rax is the desired API function:

Binary Ninja cannot know how the callee will affect the stack, so it cannot calculate the stack adjustment of the entire function. As a result, it conservatively thinks it is 0x0 (no change). This is, unfortunately, wrong since the actual stack adjustment is -0x20`.
One can fix this by nopping the add rsp, 0x20 instruction. But that would require some repetitive work to apply the patch at all call sites of API_resolver. There is an easier way: bring up the edit function properties dialog and set the stack adjustment for API_resolver as -0x20.
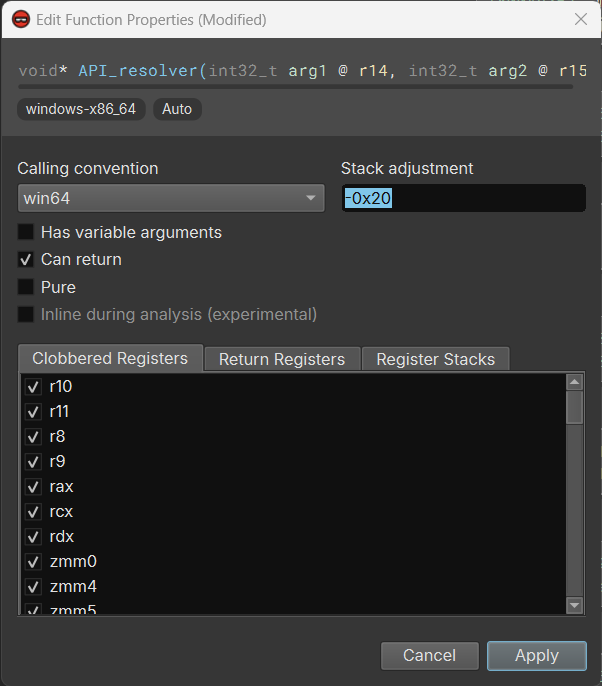
Once we click “Apply” and wait for a few seconds for the analysis update to finish, we see all the tags for unresolved stack pointer are gone, and the HLIL starts to make sense – at least now it knows the API_resolver takes the hash value as an argument:
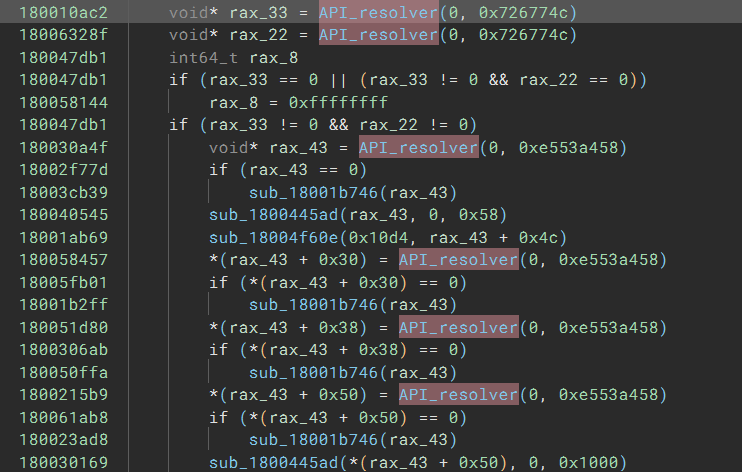
Resolving API Calls
The next step is to figure out the API names corresponding to the hash values. The code uses r15 to hold the hash value. The code also uses r14 as a boolean to decide whether it should call the API function or return the function pointer. For the sake of simplicity, I will not discuss the handling of r14 in this write-up.
I used the HashDB Lookup Service to speed up the process. Thankfully, there is a HashDB plugin for Binary Ninja by Cindy Xiao. To get started, I first need to figure out the hash algorithm used by the binary.
With the plugin, I simply need to right-click one of the hash values, select “HashDB”->”Hunt”. The plugin will then query the hunt API and find all the hash algorithms that have a hit for the queried value.
I tested with 0x726774c and I got two matching algorithms, metasploit and shl1_add:
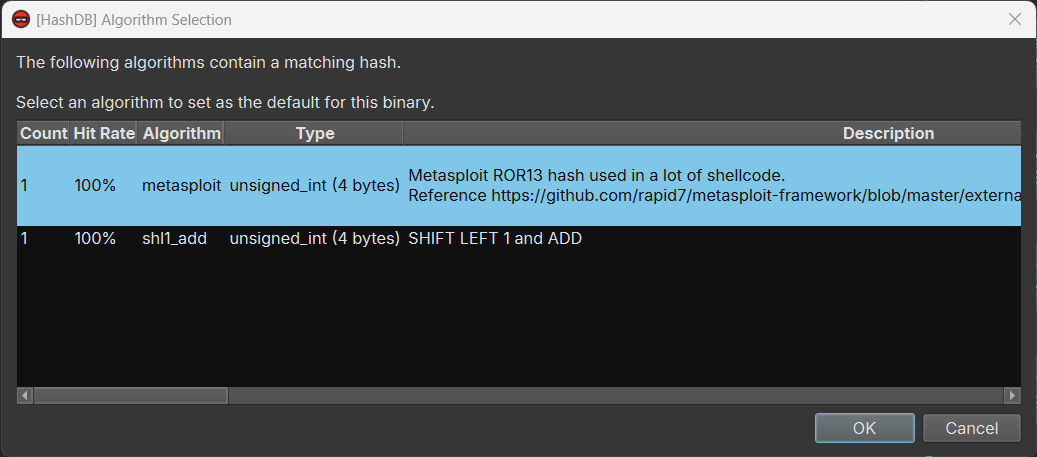
I selected a different hash value and I realized that the algorithm is metasploit. With an algorithm selected, I can right-click a hash value, “HashDB”->”Hash Lookup”, and the plugin would find the matching API function name. Even better, it created an enum for all the API functions in the same DLL (kernel32.dll) so I do not need to process them one-by-one:
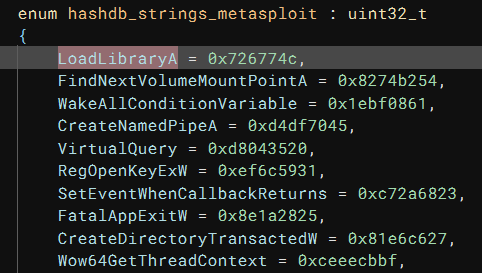
To make the HLIL more readable, I set the type of the r15 argument of API_resolver to hashdb_strings_metasploit, and the name of enum members are used, instead of the hex value:
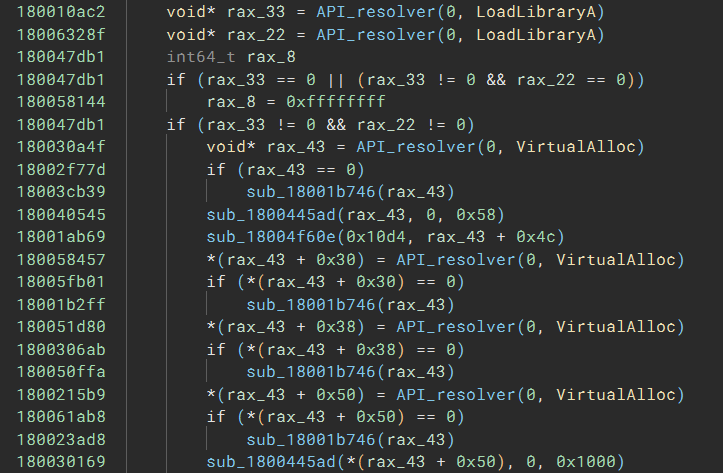
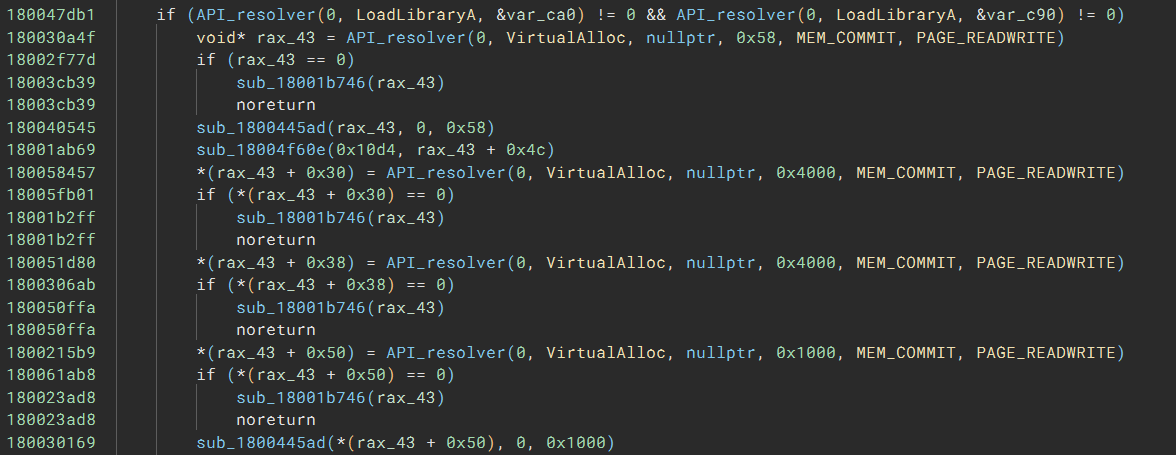
Now, at a glance, I know the code called LoadLibraryA to load two DLLs and called VirtualAlloc four times to allocate four buffers.
Not all hashes come from kernel32.dll – I selected a hash value that was not replaced with a name, and it was from ws32_2.dll. After that, all the hash values were resolved.
Overriding the Call Type and Applying an API Signature
However, the most incredible thing is yet to happen! Knowing which API gets called is helpful, but we need to know its arguments. Can Binary Ninja also show the parameters of these API calls?
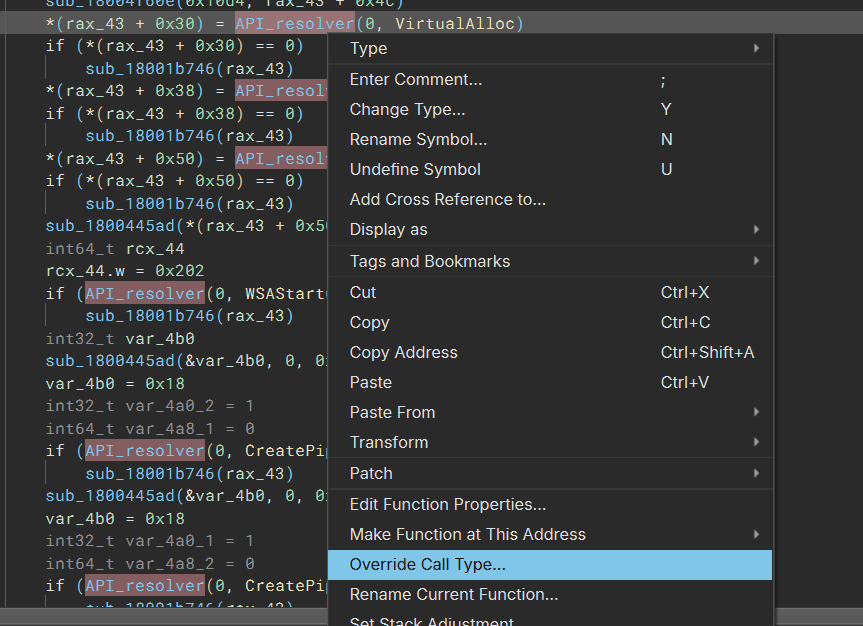
The answer is yes! Now that we have the library and function names, we can pull the type information from the type libraries. Then, we can override the call type of API_resolver at each call site using the actual type.
You should try the “override call type” functionality if you have not heard of it! In an IL view, right-click on any function call, then select “Override Call Type…”. In the dialog that pops up, feel free to enter any new type for the call you wish. The neat aspect of this is that it only affects the current site’s call type. Other calls to the same function are not affected. This also makes having different types at different call sites possible for the same function (i.e., API_resolver).
A quick PoC script looks like this:
bv.begin_undo_actions()
for addr, hash_val, name, lib in results:
    type_lib = bv.platform.get_type_libraries_by_name(lib + '.dll')[0]
    t = bv.import_library_object(name, type_lib)
    func = bv.get_functions_containing(addr)[0]
    func.set_call_type_adjustment(addr, t)
    func.set_call_stack_adjustment(addr, -0x20)
bv.commit_undo_actions()
Here are a few things I want to make clear about this snippet:
- Always use
bv.begin_undo_actions()andbv.commit_undo_actions()pairs if you script will change the analysis! Otherwise, if you are dissatisfied with the changes (which is likely the case during the script development), you have no easy way to undo it. The only option is to close the database without saving it, but that could mean losing some of the benign changes you wish to keep. - Use
get_type_libraries_by_nameto get the type library by name and useimport_library_objectto find and import the object into the binary view. - Use
set_call_type_adjustmentto override the call type. - I had to call
set_call_stack_adjustmentagain to set the call stack adjustment since overriding a call type also overrides the stack adjustment previously set in the function properties dialog.
The result looks promising:
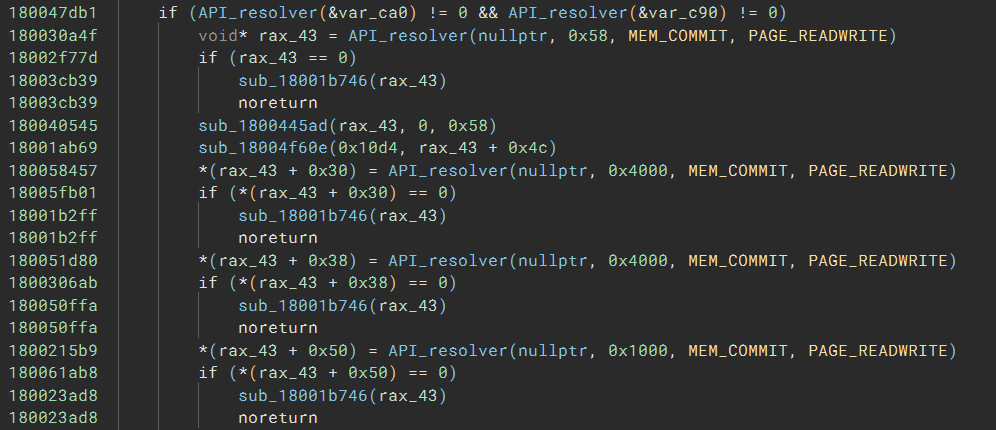
The only problem is that now we no longer see which API is being called. But that is not a big deal; we can modify the function type to add r14 and r15 as the first parameter. The script looks like this:
def get_new_type(t): s = str(t) pos = s.find('(') if s[pos + 1] != ')': s1 = s[:pos + 1] + 'int32_t arg1 @ r14, enum API arg2 @ r15, ' + s[pos + 1:] else: s1 = s[:pos + 1] + 'int32_t arg1 @ r14, enum API arg2 @ r15' + s[pos + 1:] return bv.parse_type_string(s1)[0]bv.begin_undo_actions()
for addr, hash, name, lib in results:
lib = bv.platform.get_type_libraries_by_name(lib + ‘.dll’)[0]
t = bv.import_library_object(name, lib)
new_type = get_new_type(t)
func = bv.get_functions_containing(addr)[0]
func.set_call_type_adjustment(addr, new_type)
func.set_call_stack_adjustment(addr, -0x20)
bv.commit_undo_actions()
Here, I resorted to string manipulation to add the two arguments because it is faster to implement. A more robust approach is to use the FunctionBuilder.
And here comes the most readable version:
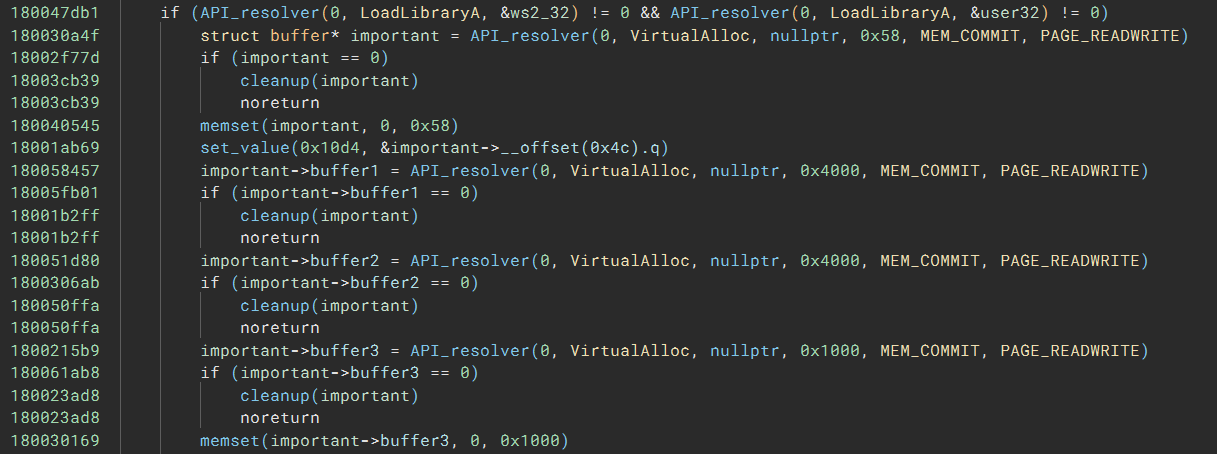
Even better, after I apply some annotations, the code has no sign of obfuscation at all:
With the help of the deobfuscated code, I could complete this challenge faster than many of my fellow players. Although the script development can take some time in the beginning, I was able to read and understand the code at a much faster pace. For reference, I solved the challenge with 8 hours of continuous work.
Article Link: Binary Ninja - Analyzing Obfuscated Code With Binary Ninja -- a Flare-On Journey