Kernel debugging is a crucial component of kernel mode software development and reverse engineering. It may sound terrifying in the beginning, but kernel debugging is not such a mysterious animal at all. I’ll discuss practical debugging approaches to the most common software issues in the Windows kernel environment: how to debug 100% CPUs, Deadlock, and Blue Screen Of Death (a.k.a. BSOD, or kernel crash). With a grasp of those ideas, developers and researchers will know what to look for when facing problems and determining how to root cause the issues.
Getting Started
Debugging in the kernel is different from other debugging problems. The kernel environment is different from user mode environment, and has its own unique set of conditions and rules. To understand Windows kernel, there are numerous detailed books and online tutorials for kernel core concepts and debugging, some of which are listed in the Appendix. These are important for gaining a baseline understanding of the core concepts, but can be hard to understand, memorize, and operationalize in a real-world context. Instead of repeating the books and materials, I’ll relive my experience solving my very first BSOD issue as a beginner ten years ago. I’ll explain the thinking process to debug common issues I have frequently encountered, and provide suggestions for solving them.
Before getting started, it is important to ensure you have the proper tools and setup. I recommend WinDbg, which is the best debugger for debugging Windows kernel. If the target system you’re debugging is X86, then usually you need to run WinDbg(X86). If the target system you’re debugging is X64, run WinDbg(X64). Next, you’ll need to know how to: 1) load symbols; 2) collect BSOD dump files for postmortem debugging; and 3) establish a live kernel debugging session with VMware.
Load Symbols
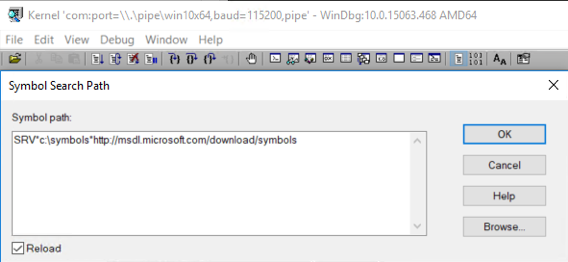
If you already have a BSOD crash dump file, in the WinDbg "File" drop down menu, select "Open Crash Dump..", navigate to the dump file and click "Open". Then follow these steps to load symbols for it. Click the “File” menu item on the upper left corner of WinDbg and select “Symbol File Path…”. In the “Symbol path:” text box, enter the following string as shown in Figure 1.1 Config MS Symbol Path.
SRV*c:\symbols*https ://msdl.microsoft.com/download/symbols
Figure 1.1 Config MS Symbol Path
If you have your own symbol server, you can append the string pointing to your own symbol servers to the above string, such as:
SRV*c:\symbols*https:/ /msdl.microsoft.com/download/symbols;SRV*c:\symbols*https: //mysymbolserver.com/symbols
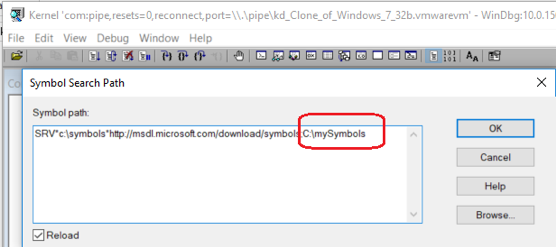
If you don’t have your own symbol server, you can save the symbol files of your driver to the local disk of the host where WinDbg is running, and tell WinDbg the path where symbol files are saved. For example, if your symbol files are saved under the folder “C:\mySymbols”, then the final symbol path string will be:
SRV*c:\symbols*https: //msdl.microsoft.com/download/symbols;C:\mySymbols
This is shown in Figure 1.2: Config Local Symbol Location
Figure 1.2: Config Local Symbol Location
Check “Reload” and click “OK”. In live debugging sessions, symbols can be configured the same way.
Now you can start analyzing the BSOD by typing in a useful command for any crash:
!analysis -v
That was all I needed to solve my very first BSOD with 0 kernel experience! To illustrate how kernel debugging isn’t all that mysterious for a beginner, I created a sample source code MyFirstBSODDriver (available in the Appendix at the end of the blog) to simulate my first BSOD, which was caused by an invalid address (null pointer) access. Figure 1.3 shows the crash symptom and Figure 1.4 shows how I debug it.
Figure 1.3 A Reproduction of My First BSOD
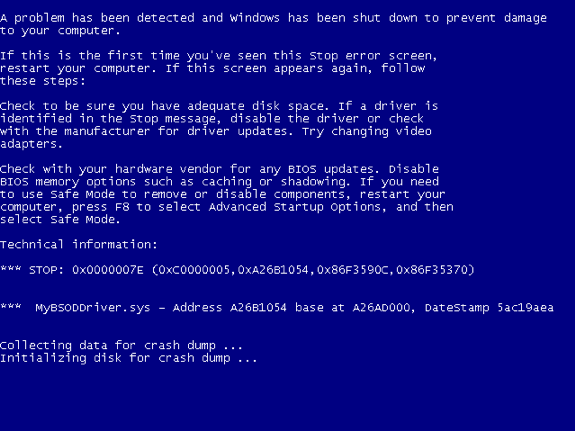
Figure 1.4: “!Analyze -v” Output Shows The Root Cause of The BSOD
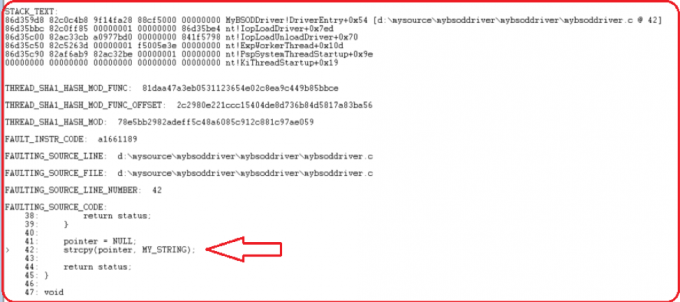
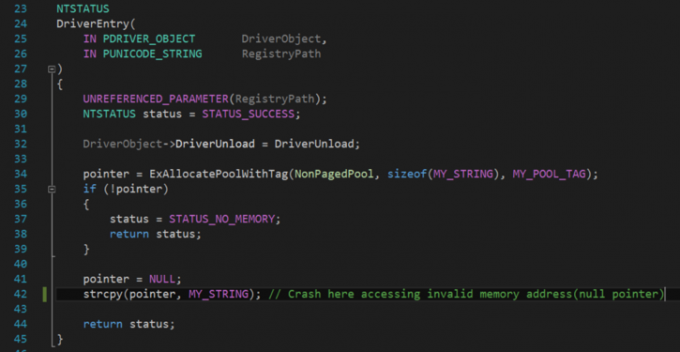
Now go back to the source code and examine the code at line 42 of MyFirstBSODDriver.c as indicated by WinDbg “!Analyze -v” output, and you can tell something is wrong with it (shown in Figure 1.5).
Figure 1.5: MyFirstBSODDriver Code Snippet
The full source code of MyFirstBSODDriver.c can be found at the end of this blog.
Collecting BSOD Dumps
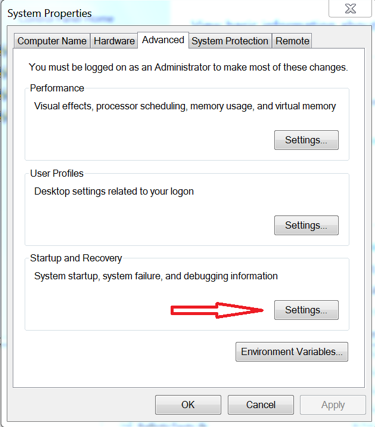
If you do not have a dump file, then you need to configure the target system to generate one at the time a BSOD happens. On "System Properties" go to the "Advanced" tab. Under the "Startup and Recovery" section, click "Settings" as shown in Figure 1.6 Startup and Recovery Settings.
Figure 1.6 Startup and Recovery Settings
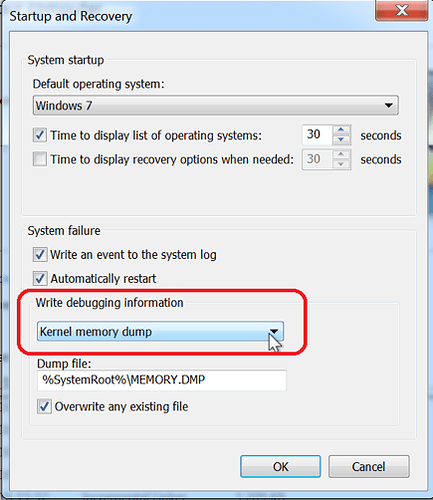
On the "Startup and Recovery" dialog, select "Kernel memory dump"(or “Complete memory dump” if the disk size is big enough) in the "Write debugging information" drop down menu, as shown in Figure 1.7 Config Kernel Memory Dump. Also pay attention to "Dump file:" which specifies the dump file location. Click "OK".
Figure 1.7 Config Kernel Memory Dump
The next time a BSOD happens, a dump file will be written to the location specified by "Dump files:" and should be collected.
Establishing a Live Kernel Debugging Session With VMware
Reproducing the issue in your own Virtual Machine environment is essential for establishing a live debugging session with your target VM. I’m using VMware in the examples, assuming the host machine is running Windows with WinDbg installed, and the target Windows virtual machine is installed in the VMware as shown in Figure 1.8.
Figure 1.8 Live Kernel Debugging with Target Windows OS Running in VMware on Local Host
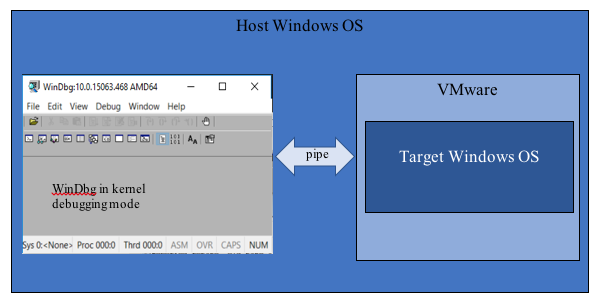
To configure a live debugging session with the target VM, you need to: 1) configure the VM settings in VMware; 2) configure kernel debug in “System Configuration” in the target VM; 3) configure WinDbg COM settings.
1. In VMware, right click the target VM, select “Settings” as shown in Figure 1.9.
Figure 1.9 Target VM Menu Options

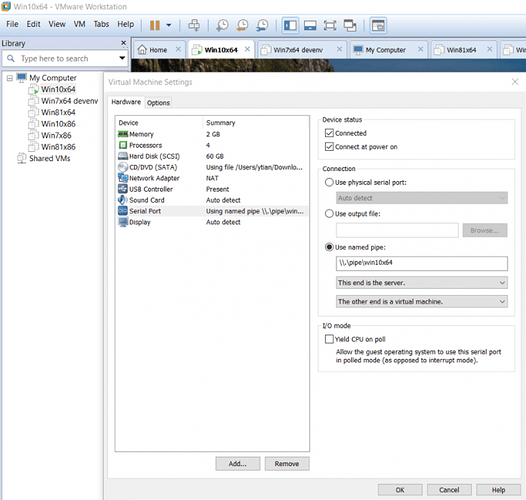
In the “Virtual Machine Settings” window, configure “Serial Port” using named pipe:
\\.\pipe\[pipename]
Select “This end is the server.”, “The other end is a virtual machine.”, keep everything else default. This is shown in Figure 1.10.
Figure 1.10: Virtual Machine Settings
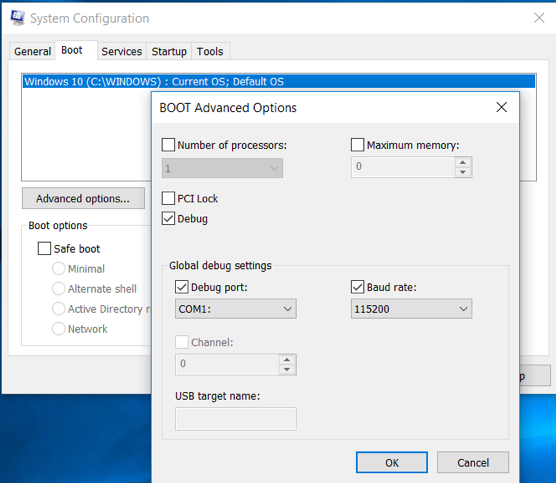
2. Next, start the VM guest. In the Windows search box, type “System Configuration” and click it. On the “Boot” tab, click “Advanced options”, check “Debug”, specify “Debug Port” and “Baud rate”(115200). Click “OK”. This is shown in Figure 1.11. Then reboot the system.
Figure 1.11 Target System Configuration
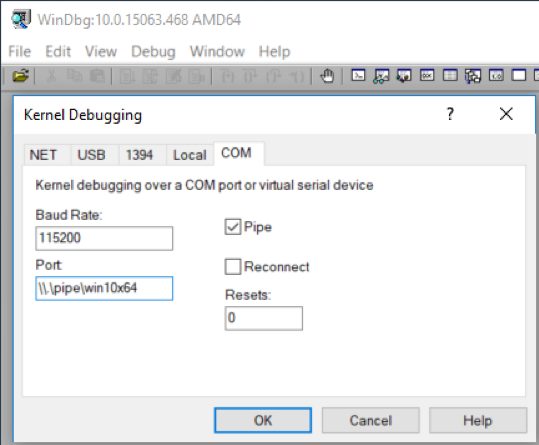
3. Start WinDbg on the host machine, click “File” on the top menu, then click “Kernel Debug…”. On the “COM” tab, Check “Pipe”, specify “Port:” to be \\.\pipe\[pipename] specified in step 1. You can keep everything else default. This is shown in Figure 1.12.
Figure 1.12: WinDbg Kernel Debugging COM config
With this configuration completed, you are now ready to dive into kernel debugging and solve real issues as quickly as possible. The following sections detail how to debug three common issues within the Windows kernel environment.
100% CPU
While 100% CPU sounds scary, in many cases, it is relatively easy to identify and fix the root cause. However, sometimes it can be tricky to initially identify such a problem. In this section, I’ll address how to spot a potential 100% CPU problem, and then discuss how to do root cause analysis and fix the problem.
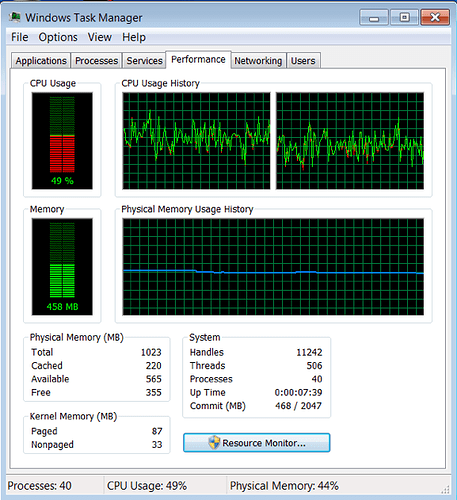
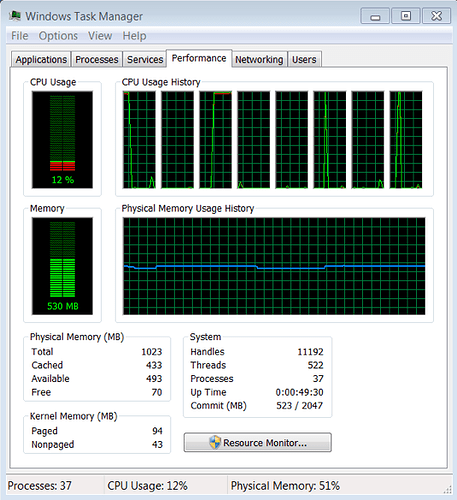
To help demonstrate the 100% CPU issue, I created a sample code My100CPUDriver.c that has an infinite loop in it (full source code can be found at the end of the post). Let’s explore the following screenshots of the CPU charts when running My100CPUDriver in different hardware configurations. These CPU charts are obtained from Task Manager -> Performance tab with “Show kernel times” enabled.
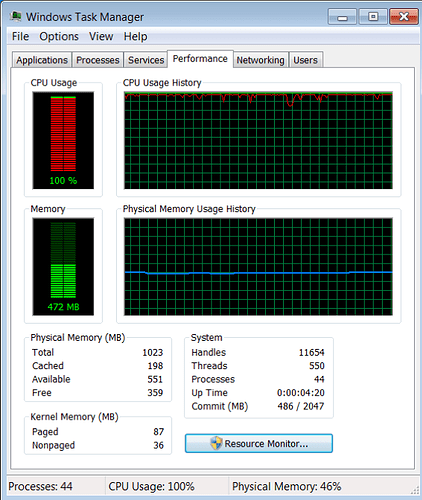
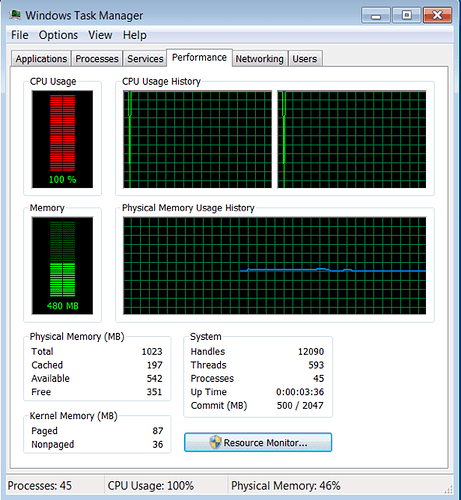
Figure 2.1 and 2.2 are straightforward cases indicating a 100% CPU issue in kernel.
Figure 2.1 One Infinite Loop Kernel Thread Running On One Core System
Figure 2.2 Two Infinite Loop Kernel Threads Running On Two Cores
Figures 2.3 and 2.4 are not as straightforward at showing 100% CPU problems because more CPU cores result in lower overall CPU usage and make it a less obvious indicator of a problem.
Figure 2.3 One Infinite Loop Kernel Thread Running On Two Cores
Figure 2.4 One Infinite Loop Kernel Thread Running On Eight Cores
CPU usage on multi-core systems can “hide” a 100% CPU problem. It is helpful if you can run your program on a single core system, so the problem stands out. There are other ways to find a 100% CPU problem on a multi-core system as well. In a healthy CPU chart, the CPU usage should distribute evenly among multiple cores. If the CPU usage continues to spike high on some cores but stays low on other cores and doesn’t spread evenly among cores, then it is an indicator of a potential infinite loop that is not yielding CPU. Once a potential 100% CPU issue is detected, we can proceed with the following method to locate and fix it in the source code.
Diagnosing the problem starts with a snapshot - a snapshot of the target system memory while the high CPU usage is happening. The snapshot can be a kernel memory dump file collected from the target system when the issue is occurring. It can also be obtained through a live kernel debugging session if you can reproduce the issue on your target system, which can be examined at real-time.
If you can collect multiple snapshots while the issue is happening, you can compare the differences between each snapshot and it helps to confirm and locate the problem in source code.
In the snapshots, you can examine the call stacks of your driver. The problem code area will usually appear on one or some of the stacks. Searching around the code areas shown on the call stacks helps identify the infinite loop. To get the call stacks of your driver, “!process” and “!thread” are useful WinDbg commands. For example:
!process 4 7
The above command will show all the threads running in the system process and their kernel times. If you know under which process context your threads are running, you can specify the process address in your command:
!process [process address] 7
Of course there are other commands that can help you get call stacks of your driver. I’m not going to list all those commands here, but feel free to use them as long as they work for you.
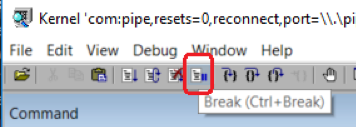
To demonstrate the snapshot idea, I’m running My100CPUDriver in a one CPU core VM with a WinDbg debugger connected to it. When I observe 100% CPU in the Task Manager shown in Figure 2.1, I hit the “Break” button in WinDbg so the debugger breaks into the target system, as shown in Figure 2.5.
Figure 2.5 Have WinDbg Break Into Target System
I next examine the system status as snapshot 1. In the snapshot, I look for the call stacks of those threads created by my driver. I run command “!process 4 7” to get the desired information, as shown in Figure 2.6.
Figure 2.6: Run Command “!process 4 7” in WinDbg Snapshot1
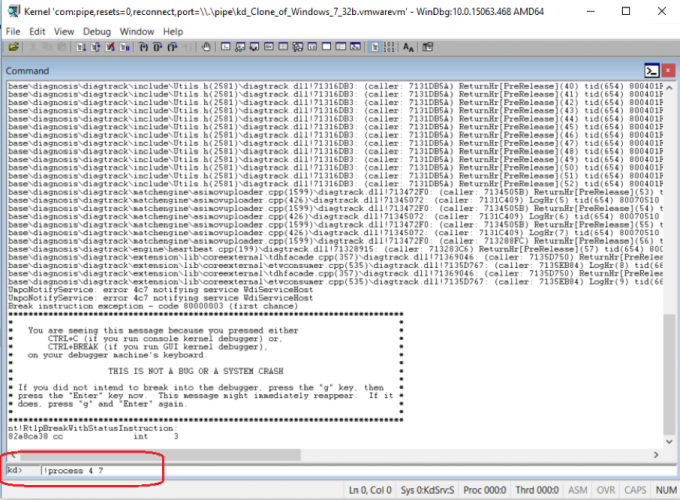
The above command output depicts all of the information of the threads in the system process. I then find the call stack of myThread as shown in Figure 2.7.
Figure 2.7 Callstack of myThread In Snapshot1

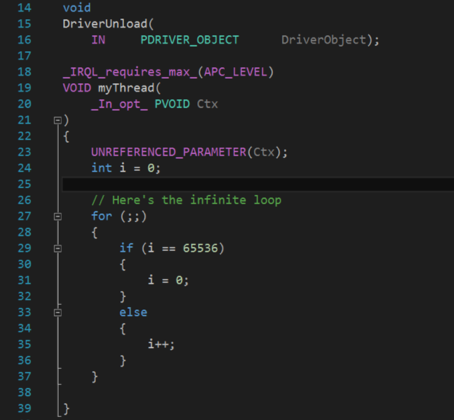
Pay attention to the KernelTime of the myThread, which is already highest among all the system threads, and pay attention to its call stack. You can see the debugger already found the infinite loop location in the source code: line 28 of My100CPUDriver.c
Then I enter “g” and type enter in the command entry window so the target system continues to run for a while. As I see the CPU is continuously pegged high at 100%, I hit “Break” again and examine the second snapshot of the system shown in Figure 2.8.
Figure 2.8 Callstack of myThread In Snapshot2

By comparing the call stacks of myThread in Snapshot1 and snapshot2, I located the loop in the source code, which is around line 27-37 in My100CPUDriver.c (full source code can be found at the end of the post), shown in Figure 2.9. It matches the diagnostics of my debugger.
Figure 2.9: My100CPUDriver.c Looping Code Snippet
Now we have finished debugging 100% CPU and can go to next stage - fixing. The fix may vary based on the logic of your program. I have some general suggestion to fix/avoid 100% CPU issue:
- Set break conditions to jump out of loops.
For example, in My100CPUDriver, I can fix the infinite loop by simply replacing the line
for (;;)
with
for (int j; j < 65536; j ++)
- Consider adding API calls such as sleep(0) between lengthy computations as a mechanism to force your thread yielding CPU execution.
Deadlock
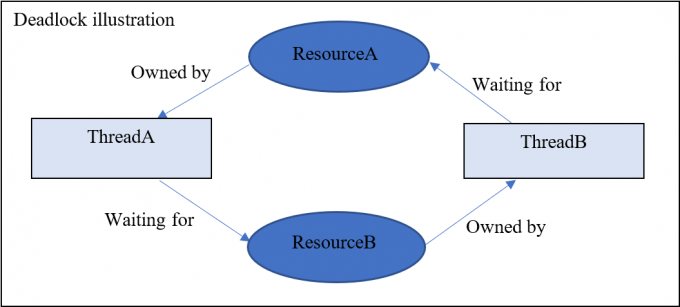
Deadlock typically involves two threads (or processes) and each of them requests at least two different lock resources in a different order. Typically, ThreadA acquires ResourceA and then tries to request ResourceB; ThreadB acquires ResourceB and then tries to request ResourceA. The two threads become locked and neither can move forward as shown in Figure 3.1.
Figure 3.1 Deadlock Illustration
I created sample code MyDeadlockDriver.c (full source code is available at the end of the post) to demonstrate a typical deadlock between ThreadA and ThreadB.
To troubleshoot deadlocks you need two things:
- Call stacks when deadlock is happening. The call stacks will show you which threads are blocked when trying to acquire certain lock resources.
- Find out what locks are held by what threads. There are WinDbg commands to help you identify what locks are held by which threads:
!locks
!qlocks
With this information collected, you can go back to the source code and search around the code area on the call stacks and match the locks in the source code with the debugger’s diagnostics to root cause the deadlock.
The following example shows how I debug the deadlock issue demonstrated by MyDeadLockDriver.
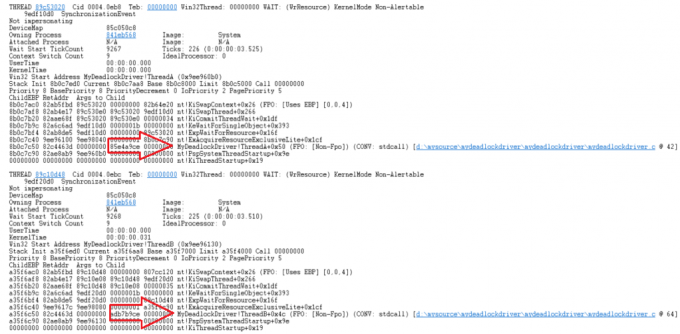
- When the deadlock is happening, I use WinDbg to break into the target system and collect the call stacks of my MyDeadLockDriver (shown in Figure 3.2).
Figure 3.2 Callstacks of MyDeadLockDriver
2. Then I find the locks information by running command “!locks” (shown in Figure 3.3). It shows which locks are held by what threads and what threads are waiting on each lock.
Figure 3.3 Locks Information
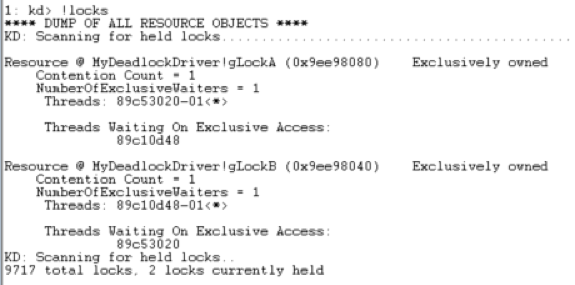
3. Combining the information in step 1 and 2, I locate the source code of the 2 deadlocking threads.
Figure 3.4 Deadlock ThreadA
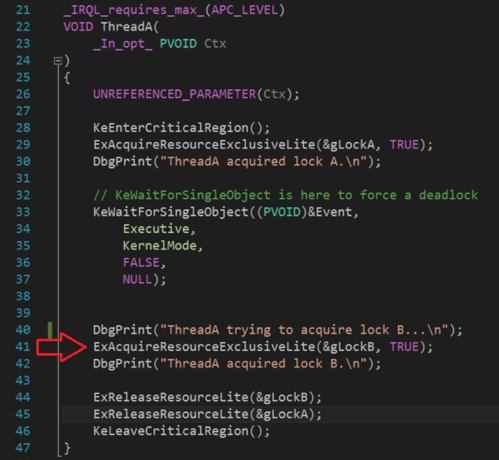
Figure 3.5 Deadlock ThreadB
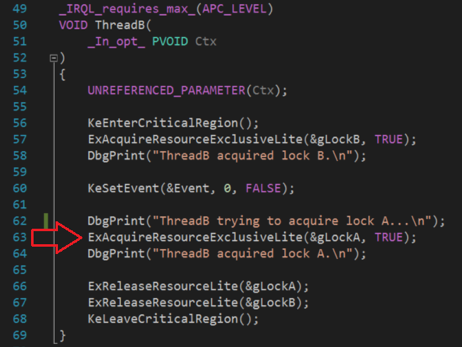
The full source code of MyDeadLockDriver.c can be found at the end of this post.
To fix the deadlocking code and to also prevent deadlock from happening, below are several suggestions for writing deadlock free software.
- Try to avoid using nested locks (avoid acquiring lock A, and then acquire lock B while holding lock A, then acquire lock C while holding lock A and B… and so on).
- Always acquire locks in the same order.
- Avoid lengthy operations and API calls inside a locked area.
BSODs
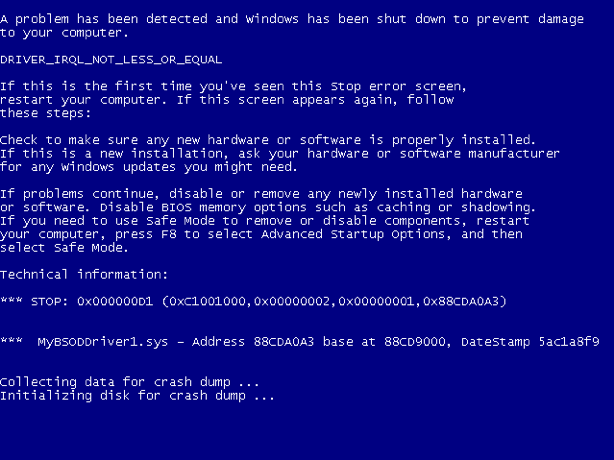
There can be various reasons behind a BSOD and the debugging approach is also case by case. The BSOD screen itself may provide some useful information, such as the bug check ID and the crashing driver, but usually the BSOD screen alone isn’t enough to identify the real problem. A typical BSOD bug check looks like Figure 4.1.
Figure 4.1 DRIVER_IRQL_NOT_LESS_OR_EQUAL Bug Check
The most useful information that helps debugging a BSOD is a dump file. You can get a kernel mode dump after the crash (as I detailed in the beginning of the post), which contains enough information to troubleshoot the problem. If possible, get a full kernel memory dump. After you get the dump file, open it with WinDbg, load the symbols, and run the following command to get more information about the crash:
!analyze -v
“!analyze -v” output will show you the crashing location in your source code. Usually this is enough to root cause the crash. If not, you can start with “!analyze -v”, dig more around addresses and the data shown in the stack, find out anything wrong in the address itself or if the data stored at the address has gone bad.
To demonstrate the bug check DRIVER_IRQL_NOT_LESS_OR_EQUAL, I created a sample code MyBSODDriver1.c. It will generate the same BSOD bug check.
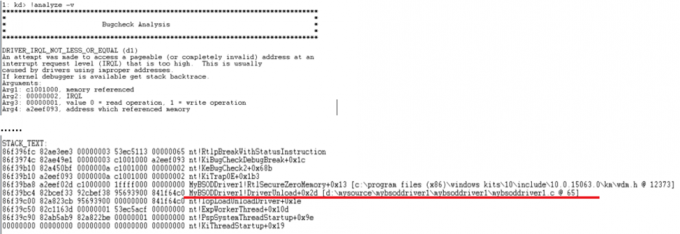
The following steps demonstrate how I debug the BSOD caused by MyBSODDriver1. I run “!analyze -v” against the crash dump. Figure 4.2 shows “!analyze -v” diagnosis of crash location in MyBSODDriver1.c .
Figure 4.2 Debugging MyBSODDriver1
I go back to the source code location identified by debugger diagnosis (full source code MyBSODDriver1.c can be found at the end of the post).
Figure 4.3 Crashing Location in The Source Code
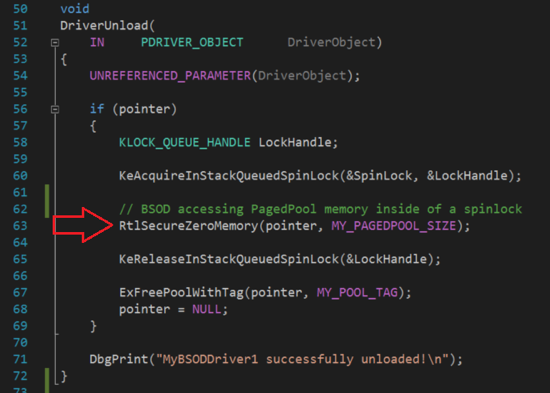
Accessing pagedpool memory inside of spinlock is a typical kernel programming mistake. To understand how it is a problem and fix it, we need to first understand some kernel specific concepts. If you are new to debugging in the kernel, I recommend reviewing Windows kernel core concepts in order to master this science. In this example, the driver crashed because it violated some certain kernel specific rules (i.e., Any routine that is running at greater than IRQL APC_LEVEL can neither allocate memory from paged pool nor access memory in paged pool safely). We need to fix the kernel rule violations, while still achieving our business logic.
For example MyBSODDriver1 can be fixed in different ways: 1) change the memory type identified by “pointer” from pagedpool to nonpagedpool; or 2) change the lock from a spinlock to other locks that don’t raise the IRQL. The actual fix can vary depending on the business logic of your program,.
Below are some general suggestions to avoid addressing violations in the kernel.
- Always try to access paged/nonpaged pools at appropriate IRQLs
- Protect accesses to user mode memory with __try{} __except{} blocks
- Correctly synchronize your threads
Conclusion
Kernel mode debugging is one of the fundamentals for security software experts. Each case is unique, making it as much an art as a science. It is important to establish the thinking processes when determining the root cause of a problem. I detailed how I approach three of the most common problems when working in the kernel. These use cases contain the broad swath of information I wish I had when I was first starting out. Of course, there is no replacement for hands-on practice. The tips and use cases in this post hopefully provide a useful introduction to help you get started debugging in the kernel. If you’ll be in San Francisco next week, I will be presenting these concepts at BSides SF and look forward to continuing this discussion.
Appendix
Windows Kernel Core Concepts
- Kernel mode vs User mode
- IRQL
- Memory layout
- Process and thread
- Processor control region (PCR)
- System calls
Windows Kernel books and documents
- Windows System Internals;
- Practical Reverse Engineering: X86, X64, ARM, Windows Kernel, Reversing Tools, and Obfuscation, by Bruce Dang, etc;
- Various MSDN online documens
Handy Tools
OSR Driver Loader is a driver loader
VirtualKD makes your live debug session faster
Source code of the samples
MyFirstBSODDriver source code
// MyFirstBSODDriver.c

#include <ntifs.h>

NTSTATUS
DriverEntry(
    IN PDRIVER_OBJECT		DriverObject,
    IN PUNICODE_STRING		RegistryPath
);

void
DriverUnload(
    IN     PDRIVER_OBJECT      DriverObject);

#define MY_POOL_TAG 'GTYM'
#define MY_STRING "Hello!"
PVOID pointer = NULL;

#ifdef ALLOC_PRAGMA
#pragma alloc_text(INIT, DriverEntry)
#endif

NTSTATUS
DriverEntry(
    IN PDRIVER_OBJECT		DriverObject,
    IN PUNICODE_STRING		RegistryPath
)
{
    UNREFERENCED_PARAMETER(RegistryPath);
    NTSTATUS status = STATUS_SUCCESS;

    DriverObject->DriverUnload = DriverUnload;

    pointer = ExAllocatePoolWithTag(NonPagedPool, sizeof(MY_STRING), MY_POOL_TAG);
    if (!pointer)
    {
        status = STATUS_NO_MEMORY;
        return status;
    }

    pointer = NULL;
    strcpy(pointer, MY_STRING);

    return status;
}

void
DriverUnload(
    IN     PDRIVER_OBJECT      DriverObject)
{
    UNREFERENCED_PARAMETER(DriverObject);

    if (pointer)
    {
        DbgPrint("the string at the pointer = %s\n", pointer);
        ExFreePoolWithTag(pointer, MY_POOL_TAG);
        pointer = NULL;
    }

    DbgPrint("MyBSODDriver successfully unloaded!\n");
}
//end of MyFirstBSODDriver.c
My100CPUDriver source code
// My100CPUDriver.c

#include <ntifs.h>

HANDLE gThreadA = NULL;
HANDLE gThreadB = NULL;

NTSTATUS
DriverEntry(
    IN PDRIVER_OBJECT		DriverObject,
    IN PUNICODE_STRING		RegistryPath
);

void
DriverUnload(
    IN     PDRIVER_OBJECT      DriverObject);

_IRQL_requires_max_(APC_LEVEL)
VOID myThread(
    _In_opt_ PVOID Ctx
)
{
    UNREFERENCED_PARAMETER(Ctx);
    int i = 0;

    // Here's the infinite loop
    for (;;)
    {
        if (i == 65536)
        {
            i = 0;
        }
        else
        {
            i++;
        }
    }

}

#ifdef ALLOC_PRAGMA
#pragma alloc_text(INIT, DriverEntry)
#endif

NTSTATUS
DriverEntry(
    IN PDRIVER_OBJECT		DriverObject,
    IN PUNICODE_STRING		RegistryPath
)
{
    UNREFERENCED_PARAMETER(RegistryPath);
    NTSTATUS status = STATUS_SUCCESS;

    DriverObject->DriverUnload = DriverUnload;

    status = PsCreateSystemThread(&gThreadA,
        0x1F03FF,
        NULL,
        NULL,
        NULL,
        myThread,
        NULL);
    if (!NT_SUCCESS(status))
    {
        DbgPrint("Failed to initialize myThread.\n");
        return status;
    }

    /*
    // This part is for demonstrating 2 infinite loop threads
    // Comment out when demonstrating only 1 infinite loop thread
    status = PsCreateSystemThread(&gThreadB,
        0x1F03FF,
        NULL,
        NULL,
        NULL,
        myThread,
        NULL);
    if (!NT_SUCCESS(status))
    {
        DbgPrint("Failed to initialize myThread.\n");
        return status;
    }
    */

    return status;
}

void
DriverUnload(
    IN     PDRIVER_OBJECT      DriverObject)
{
    UNREFERENCED_PARAMETER(DriverObject);
    NTSTATUS status = STATUS_SUCCESS;

    // Wait for myThread A to terminate
    status = ZwWaitForSingleObject(gThreadA, FALSE, NULL);
    if (!NT_SUCCESS(status))
    {
        DbgPrint("Failed to wait for the thread.\n");
    }

    // Close the handle to myThread A
    ZwClose(gThreadA);
    gThreadA = NULL;

    /*
    // This part is for demonstrating 2 infinite loop threads
    // Comment out when demonstrating only 1 infinite loop thread

    // Wait for myThread B to terminate
    status = ZwWaitForSingleObject(gThreadB, FALSE, NULL);
    if (!NT_SUCCESS(status))
    {
        DbgPrint("Failed to wait for the thread.\n");
    }

    // Close the handle to myThread B
    ZwClose(gThreadB);
    gThreadB = NULL;
    */

    DbgPrint("My100CPUDriver successfully unloaded!\n");
}

// end of My100CPUDriver.c
MyDeadLockDriver source code
// MyDeadLockDriver.c

#include <ntifs.h>

HANDLE gThreadA = NULL;
HANDLE gThreadB = NULL;
ERESOURCE gLockA;
ERESOURCE gLockB;
KEVENT    Event;

NTSTATUS
DriverEntry(
    IN PDRIVER_OBJECT		DriverObject,
    IN PUNICODE_STRING		RegistryPath
);

void
DriverUnload(
    IN     PDRIVER_OBJECT      DriverObject);

_IRQL_requires_max_(APC_LEVEL)
VOID ThreadA(
    _In_opt_ PVOID Ctx
)
{
    UNREFERENCED_PARAMETER(Ctx);

    KeEnterCriticalRegion();
    ExAcquireResourceExclusiveLite(&gLockA, TRUE);
    DbgPrint("ThreadA acquired lock A.\n");

    // KeWaitForSingleObject is here to force a deadlock
    KeWaitForSingleObject((PVOID)&Event,
        Executive,
        KernelMode,
        FALSE,
        NULL);


    DbgPrint("ThreadA trying to acquire lock B...\n");
    ExAcquireResourceExclusiveLite(&gLockB, TRUE);
    DbgPrint("ThreadA acquired lock B.\n");

    ExReleaseResourceLite(&gLockB);
    ExReleaseResourceLite(&gLockA);
    KeLeaveCriticalRegion();
}

_IRQL_requires_max_(APC_LEVEL)
VOID ThreadB(
    _In_opt_ PVOID Ctx
)
{
    UNREFERENCED_PARAMETER(Ctx);

    KeEnterCriticalRegion();
    ExAcquireResourceExclusiveLite(&gLockB, TRUE);
    DbgPrint("ThreadB acquired lock B.\n");

    KeSetEvent(&Event, 0, FALSE);

    DbgPrint("ThreadB trying to acquire lock A...\n");
    ExAcquireResourceExclusiveLite(&gLockA, TRUE);
    DbgPrint("ThreadB acquired lock A.\n");

    ExReleaseResourceLite(&gLockA);
    ExReleaseResourceLite(&gLockB);
    KeLeaveCriticalRegion();
}

#ifdef ALLOC_PRAGMA
#pragma alloc_text(INIT, DriverEntry)
#endif

NTSTATUS
DriverEntry(
    IN PDRIVER_OBJECT		DriverObject,
    IN PUNICODE_STRING		RegistryPath
)
{
    UNREFERENCED_PARAMETER(RegistryPath);
    NTSTATUS status = STATUS_SUCCESS;

    DriverObject->DriverUnload = DriverUnload;

    status = ExInitializeResourceLite(&gLockA);
    if (!NT_SUCCESS(status))
    {
        DbgPrint("Failed to initialize resource A.\n");
        return status;
    }

    status = ExInitializeResourceLite(&gLockB);
    if (!NT_SUCCESS(status))
    {
        DbgPrint("Failed to initialize resource B.\n");
        return status;
    }

    KeInitializeEvent(&Event, NotificationEvent, FALSE);

    status = PsCreateSystemThread(&gThreadA,
        0x1F03FF,
        NULL,
        NULL,
        NULL,
        ThreadA,
        NULL);
    if (!NT_SUCCESS(status))
    {
        DbgPrint("Failed to initialize thread A.\n");
        return status;
    }

    status = PsCreateSystemThread(&gThreadB,
        0x1F03FF,
        NULL,
        NULL,
        NULL,
        ThreadB,
        NULL);
    if (!NT_SUCCESS(status))
    {
        DbgPrint("Failed to initialize thread B.\n");
        return status;
    }

    return status;
}

void
DriverUnload(
    IN     PDRIVER_OBJECT      DriverObject)
{
    UNREFERENCED_PARAMETER(DriverObject);
    NTSTATUS status = STATUS_SUCCESS;

    // Wait for thread A to terminate
    status = ZwWaitForSingleObject(gThreadA, FALSE, NULL);
    if (!NT_SUCCESS(status))
    {
        DbgPrint("Failed to wait for thread A.\n");
    }

    // Close the handle to thread A
    ZwClose(gThreadA);
    gThreadA = NULL;

    // Wait for thread B to terminate
    status = ZwWaitForSingleObject(gThreadB, FALSE, NULL);
    if (!NT_SUCCESS(status))
    {
        DbgPrint("Failed to wait for thread B.\n");
    }

    // Close the handle to thread B
    ZwClose(gThreadB);
    gThreadB = NULL;

    ExDeleteResourceLite(&gLockA);
    ExDeleteResourceLite(&gLockB);
    DbgPrint("MyDeadlockDriver successfully unloaded!\n");
}
// end of MyDeadlockDriver.c
MyBSOD1Driver1 source code
// MyBSOD1Driver1.c

#include <ntifs.h>

NTSTATUS
DriverEntry(
    IN PDRIVER_OBJECT		DriverObject,
    IN PUNICODE_STRING		RegistryPath
);

void
DriverUnload(
    IN     PDRIVER_OBJECT      DriverObject);

#define MY_POOL_TAG 'GTYM'
#define MY_STRING "Hello!"
#define MY_PAGEDPOOL_SIZE 512 * 1024 * 1024
PVOID pointer = NULL;
KSPIN_LOCK SpinLock;

#ifdef ALLOC_PRAGMA
#pragma alloc_text(INIT, DriverEntry)
#endif

NTSTATUS
DriverEntry(
    IN PDRIVER_OBJECT		DriverObject,
    IN PUNICODE_STRING		RegistryPath
)
{
    UNREFERENCED_PARAMETER(RegistryPath);
    NTSTATUS status = STATUS_SUCCESS;

    DriverObject->DriverUnload = DriverUnload;

    KeInitializeSpinLock(&SpinLock);

    pointer = ExAllocatePoolWithTag(PagedPool, MY_PAGEDPOOL_SIZE, MY_POOL_TAG);
    if (!pointer)
    {
        status = STATUS_NO_MEMORY;
        return status;
    }

    return status;
}

void
DriverUnload(
    IN     PDRIVER_OBJECT      DriverObject)
{
    UNREFERENCED_PARAMETER(DriverObject);

    if (pointer)
    {
        KLOCK_QUEUE_HANDLE LockHandle;

        KeAcquireInStackQueuedSpinLock(&SpinLock, &LockHandle);

	 // BSOD accessing PagedPool memory inside of a spinlock
        RtlSecureZeroMemory(pointer, MY_PAGEDPOOL_SIZE);

        KeReleaseInStackQueuedSpinLock(&LockHandle);

        ExFreePoolWithTag(pointer, MY_POOL_TAG);
        pointer = NULL;
    }

    DbgPrint("MyBSODDriver1 successfully unloaded!\n");
}
// end of MyBSODDriver1.c
Article Link: https://www.endgame.com/blog/technical-blog/introduction-windows-kernel-debugging
