Introduction
The holy grail for defenders is being able to detect /stop every attack before / when it happens and to know exactly the how’s no matter the techniques or tools. Unfortunately we’re still far from this holy grail, but as defenders we’ve come a long way on being able to detect and understand some attacks. One of the ways this is achieved is by leveraging the different logs sources available on a system. One such log source is ETW.
What is ETW ?
It’s a general-purpose, high-speed tracing facility provided by the operating system. Using a buffering and logging mechanism implemented in the kernel, ETW provides a tracing mechanism for events raised by both user-mode applications and kernel-mode device drivers — MSDN-Magazine
In other words it offers the capability for applications / drivers or any software on the system to write / publish events. Although it was designed for performance monitoring and troubleshooting in the early days. In the recent years, it quickly became an interesting source of detection for defenders.
Now, before we go any deeper let’s first discuss the general architecture of ETW.
Architecture
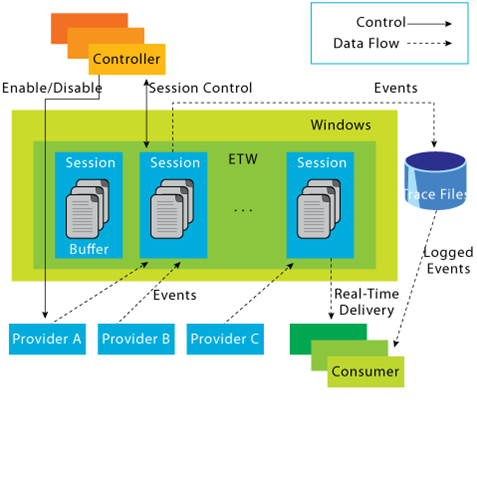
The following diagram showcase how the ETW architecture is laid out:
 https://web.archive.org/web/20200725154736/https://docs.microsoft.com/en-us/archive/blogs/ntdebugging/part-1-etw-introduction-and-overview
The general idea is as follows. Let’s say there is an “Application A” that execute some code and wants to log some stuff that its doing. One way to do that is to register a “Provider” with ETW this provider will then “provide” some logs to anyone requesting (registering) with it.
To interact with or consume what this provider is offering a “Consumer” must start a “Trace Session”. This session will capture any event sent by the “provider”. All of this is managed by a “Controller” that will for example start/stop a session…etc.
Let’s take a look at each part in more details
Controllers
As the name suggest, the “Controllers” are responsible for keeping control of everything related to ETW. From starting and stopping trace session(s) to enabling and disabling provider(s) within a trace. One know controller is the built-in utility “logman.exe” that we’re gonna talk about alter.
Providers
Providers are the ones responsible for generating the events and writing them to the ETW sessions. Applications can register ETW providers and write as many events as they’d like. While ETW support four types of providers :
- MOF Providers
- WPP providers
- Manifest-based providers
- TraceLogging providers
I will be focusing on “Manifest-based” providers in this blog. You can read more on the other types here:
About Event Tracing - Win32 apps
For a provider to be able to write events it needs a description or a blue print that will describe how these events are structured in the case of “Manifest-Based providers” events are describe in what’s known as an “Instrumentation Manifest”. This manifest contains all the information related to events, how to filter on them, their value, ID, description…etc. Details about this manifest are provided in MSDN. (See link)
Writing an Instrumentation Manifest - Win32 apps
Even though there exists parser’s for these manifests, its good practice to be able to understand what each field means and the first thing to know is that the “instrumentation manifest” is an XML based file. This means that everything is an XML element. So let’s start by taking a look at these elements
<provider>
The first element is the “<provider>” element. It’s used to identify a provider and its required. Usually the following attributes are associated with it:
- name — This represents the name of the provider. Its the one that shows when we use a utility like “logman” (That we’ll talk about later)
- guid — This is a globally unique identifier that will identify this provider. Example: {22fb2cd6–0e7b-422b-a0c7–2fad1fd0e716}
- resourceFileName / messageFileName — The path to the executable / DLL that contains the metadata and message resources respectively
- parameterFilePath — The path to the EXE/DLL that contains the strings resources for a provider
What this element actually provide is the identification of the provider and the necessary metadata / strings for tools that want to consume this provider and be able to translate events.
<channels>
If you are familiar with the windows utility “Event Viewer” then you’re familiar with channels. (See image)
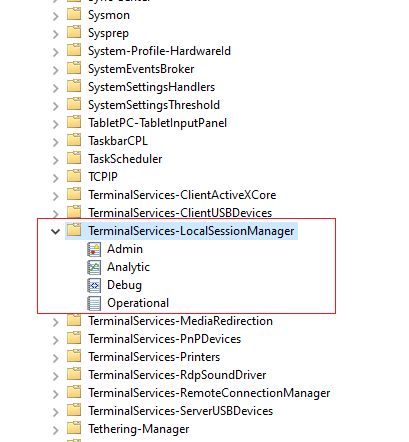 Event Viewer
There are four types of channels supported :
- Admin
- Operational
- Analytic
- Debug
The manifest let’s us describe if we want a provider to write events to specific channels by using the “channel element” and the following attributes:
- chid — A unique identifier that can be used as a reference in other elements.
- name — A name for the channel. The general guidance is to use the name of the provider followed by an “/” and the type of the channel. Example: “Microsoft-Windows-Windows Defender/Operational”
- type — Identify the channel type and can be one of the four value describe above.
Here is an example adapted from MSDN
<channel
    chid="c1"
    name="Microsoft-Windows-Windows Defender/Operational"
    symbol="CHANNEL_DEFENDER_OPERATIONAL"
    type="Operational"
/>
<levels>
The level element is used to define different log levels and offers the ability to group events based on these levels. The most commonly used levels according to MSDN are the following:
- win:Critical (1)
- win:Error (2)
- win:Warning (3)
- win:Informational (4)
- win:Verbose (5)
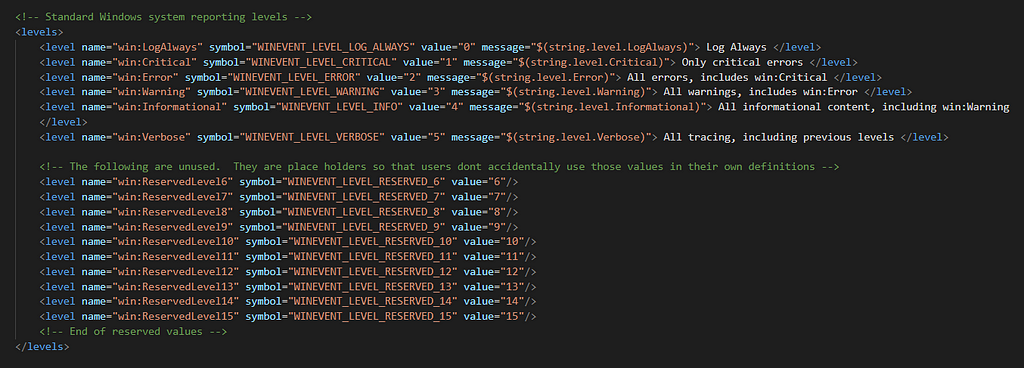 Image from “winmeta.xml”
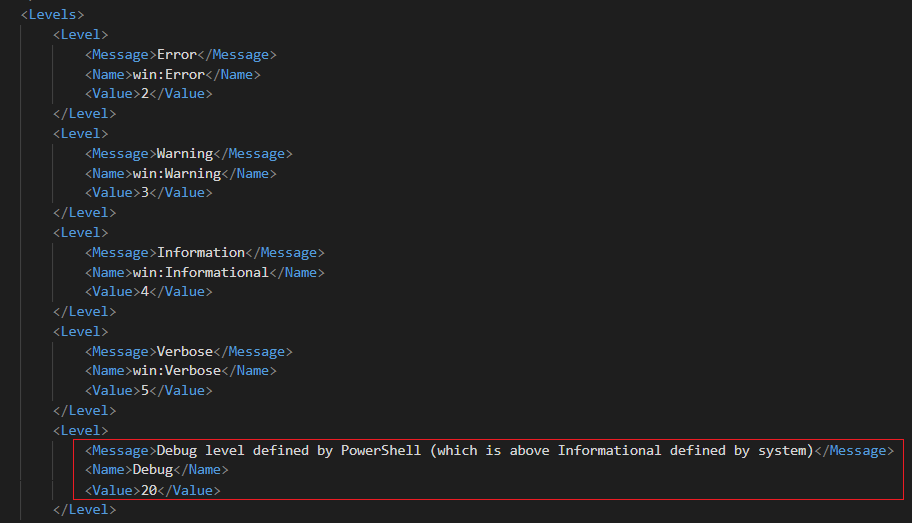
But as seen in the image above there are other predefined levels and some reserved ones (From 6 to 15). Providers have the ability to also define custom levels. For example the Powershell provider defined level 20 for debug. (See image)
These levels can be used by consumers as a filtering mechanism to get events with specific levels.
<tasks> & <opcodes>
These two elements are used as their name suggest to group events based on tasks and operation. For example let’s take the “Microsoft-Windows-Kernel-Process” provider. It defines the following tasks
...
<task name="ProcessStart" message="ProcessStart" value="1"/>
<task name="ProcessStop" message="ProcessStop" value="2"/>
<task name="ThreadStart" message="ThreadStart" value="3"/>
<task name="ThreadStop" message="ThreadStop" value="4"/>
...
In this example these are self explanatory tasks that consumers can use to filter exactly on the type of events they’d like.
Tasks will general have a name, message and a value attribute that are self explanatory.
Similar to tasks, opcodes can be used to describe specific operations. For example the “Microsoft-Windows-Powershell” provider defines the following opcodes for the task “connect”
<task name="Connect" message="Connect" value="1">
<opcodes>
<opcode name="Open(async)" message="Open(async)" value="10"/>
<opcode name="tobeusedwhenanobjectisconstructed" message="tobeusedwhenanobjectisconstructed" value="16"/>
<opcode name="Tobeusedwhenoperationisjustexecutingamethod" message="Tobeusedwhenoperationisjustexecutingamethod" value="20"/>
</opcodes>
</task>
There are some predefined opcodes in the “winmeta.xml” file (Windows SDK) that providers can use and you’ll find some when dumping providers manifests. The list can be found here:
OpcodeType Complex Type - Win32 apps
<keywords>
Similar to levels and task elements that we’ve seen previously. The keyword element is also used as a grouping mechanism for consumers to filter on. The keywords element uses the following attributes:
- message —A string describing the keyword
- name —A unique name for the keyword for example: “ProcessStart”
- mask — A bitmask that must have only a single bit set
Here is an example from the “Microsoft-Windows-Kernel-Process” provider:
...
<keywords>
<keyword name="WINEVENT_KEYWORD_PROCESS" message="WINEVENT_KEYWORD_PROCESS" mask="0x10"/>
<keyword name="WINEVENT_KEYWORD_THREAD" message="WINEVENT_KEYWORD_THREAD" mask="0x20"/>
<keyword name="WINEVENT_KEYWORD_IMAGE" message="WINEVENT_KEYWORD_IMAGE" mask="0x40"/>
<keyword name="WINEVENT_KEYWORD_CPU_PRIORITY" message="WINEVENT_KEYWORD_CPU_PRIORITY" mask="0x80"/>
</keywords>
...
<maps>
Another interesting element that can help consumers and us when reading manifests is the maps element. This element simply defines a relationship between a value and a string. These maps will be used as a translation mechanism when parsing events data. For example an event could return a field with certain values and when we try to parse these value we find that they are mapped to specific strings as we can see in the “Microsoft-Windows-DNS-Client” provider:
<maps>
<valueMap name="DnsIpTypeMap">
<map value="0x0" message="static"/>
<map value="0x1" message="dynamic"/>
</valueMap>
</maps>
<templates>
Sometimes when events are generated their messages are self contained, meaning that no extra data is required to describe the event. But when an event contains specific data we need to define a template describing the fields we’re adding.
Let’s illustrate this with an example. So we have some action that will generate an event and this event will contain some dynamic data that needs to be mapped as such:
Message : Correlating activity id's. %n %t CurrentActivityId: %1 %n %t ParentActivityId: %2
Now once a consumer see this it needs to replace the values of “%1” and “%2” with the appropriate data. For this a template is defined as such :
<template tid="T_CorrelationEvent">
<data inType="win:GUID" name="currentActivityId" />
<data inType="win:GUID" name="parentActivityId" />
</template>
From this we can conclude that:
- “%1” represents the “currentActivityId”
- “%2” represents the “parentActivityId”
Template attributes contain information about the type of the data and if it’s mapped for example to a “maps” element.
<event>
Similar to when writing a program one has to declare variables, defines function and classes. All of the elements seen above can be thought of as such. Now that we’ve defined how things are organized its time to define the events themselves.
For every event a program wants to write / capture an “<event>” XML element must be defined. This element must have an identifier or value that is unique as this value is what we often refers to as EVENT ID or EID.
Let’s take an example from the “Microsoft-Windows-Kernel-Process” provider:
<event value="1" symbol="ProcessStart" version="0" task="ProcessStart" opcode="win:Start" level="win:Informational" keywords="WINEVENT_KEYWORD_PROCESS" template="ProcessStartArgs"/>
As we can see this contains the required attribute “value” which is set to the value of “1”. This means that if we want to capture this event we could search for anything with the value of “Event Id=1”. Other than that we can see a lot of attributes that hopefully we’re familiar with now. Such as “task”, “opcode”, “level”, “template”…etc. These are all referencing the elements we’ve set before and they play the role of a filtering mechanisms for consumers.
<localization>
The final element we’re gonna talk about is “localization”. Which is pretty straight forward. I’ve been doing the substitution myself in the examples above but in reality if we take a look at any of the elements above we’ll see a definition like this.
<task name="ProcessStart" message="$(string.task_ProcessStart)" value="1"/>
Where the value of “message” is a variable referencing something and that something is the strings defined inside the “localization” element. Here is an example:
<localization>
<resources culture="en-GB">
<stringTable>
<string id="keyword_WINEVENT_KEYWORD_PROCESS" value="WINEVENT_KEYWORD_PROCESS"/>
<string id="keyword_WINEVENT_KEYWORD_THREAD" value="WINEVENT_KEYWORD_THREAD"/>
<string id="keyword_WINEVENT_KEYWORD_IMAGE" value="WINEVENT_KEYWORD_IMAGE"/>
...
</stringTable>
</resources>
</localization>
Its a straight forward concept to understand.
To get a better understanding of this i suggest you walk trough an example using a provider manifest. Here is one for the “Microsoft-Windows-Kernel-Process.manifest”
ETW-Resources/Microsoft-Windows-Kernel-Process.manifest.xml at main · nasbench/ETW-Resources
With this we conclude the section about providers and provider manifest.
Trace Sessions / Trace Files (.etl)
Trace sessions are simply a mechanism that enable/subscribe to a set of providers along with some configurations. These configuration ranges from asking if the sessions is in real time or writing to trace files (.etl)…etc.
Trace sessions have the ability to enable providers using two types of keyword bitmasks that we’ll see often:
- Keyword (Any) : enables you to specify an 8-byte, hexadecimal bitmask value that represents one or more Keywords — MSDN
- Keyword (All) : an optional 8-byte, hexadecimal bitmask that further restricts the category of events that an ETW event provider writes — MSDN
Let’s illustrate these two concepts with an example adapted from MSDN.
So let’s say we have the following three bit keywords :
- READ : 001
- LOCAL Events: 010
- REMOTE Events: 100
Now let’s say i have two events :
- Event 1 -> Uses “READ + LOCAL” keywords (011)
- Event 2 -> Uses “READ + REMOTE” keywords (101)
The “Keyword (Any)” allows us to specify the bits that we want to filter on where if any of the event bitmask matches our filter we get a hit.
Let’s say we want read events. We could set Keywords (Any) to “001” and receive any events that have this bit set in their value. If we want to be more specific we can set the “Keywords (All)” to “101” to get only Event 2 or “011” to get only event 1.
In other words the “Any” filter let us match with any events that have at least matching bits whereas the “All” filter indicate that all the bits must match to capture the event. This will come in handy when we query trace sessions and see their configuration to understand which events are captured and which are not.
Consumers
The last component of the ETW architecture that we’re gonna talk about are consumers. Which are application or programs that will read / listen to Trace Files / Sessions. A well known consumer is the Event Viewer.
Now that we’ve talked about the theory a little bit and understood how things work (a little) let’s illustrate everything and see how we can interact with these providers and trace sessions that we’ve been talking about from the start.
Interacting With ETW
Logman
The first utility that we’re gonna talk about is “logman.exe” which is a built-in utility in windows that plays the role of a controller.
We’ve talked about providers and trace sessions. One thing to note is that windows comes with more than 1000 registered providers by default and at least a dozen trace sessions. We can list all of this using logman.
To view the list of available providers on the system we can use the following command:
# logman.exe query providers
[Provider] [GUID]
--------------------------------------------------------------------
...
Microsoft-Windows-Crypto-CNG {E3E0E2F0-C9C5-11E0-8AB9-9EBC4824019B}Microsoft-Windows-Crypto-RNG {54D5AC20-E14F-4FDA-92DA-EBF7556FF176}Microsoft-Windows-D3D9 {783ACA0A-790E-4D7F-8451-AA850511C6B9}Microsoft-Windows-Data-Pdf {B97561FE-B27A-4C48-AA3E-7D3ADDC105B1}Microsoft-Windows-DCLocator {CFAA5446-C6C4-4F5C-866F-31C9B55B962D}Microsoft-Windows-DDisplay {75051C9D-2833-4A29-8923-046DB7A432CA}...
From this result we can then query information about any specific provider we want
# logman.exe query providers "Microsoft-Windows-WMI-Activity"
Provider                                 GUID
--------------------------------------------------------------------
Microsoft-Windows-WMI-Activity           {1418EF04-B0B4-4623-BF7E-D74AB47BBDAA}
Value               Keyword              Description
--------------------------------------------------------------------
0x8000000000000000  Microsoft-Windows-WMI-Activity/Trace
0x4000000000000000  Microsoft-Windows-WMI-Activity/Operational
0x2000000000000000  Microsoft-Windows-WMI-Activity/Debug
Value               Level                Description
--------------------------------------------------------------------
0x02                win:Error            Error
0x04                win:Informational    Information
PID                 Image
--------------------------------------------------------------------
0x000012d4          C:\Windows\System32\wbem\WmiPrvSE.exe
0x00000dd4          C:\Windows\System32\svchost.exe
0x00000dd4          C:\Windows\System32\svchost.exe
0x00000cb4          C:\Windows\System32\wbem\WmiPrvSE.exe
0x00000a30          C:\Windows\System32\svchost.exe
As you can see these are all familiar information that we described above such as keywords and log levels. An interesting information here is the PID / Image section that provides information about the processes that are currently sending using this provider.
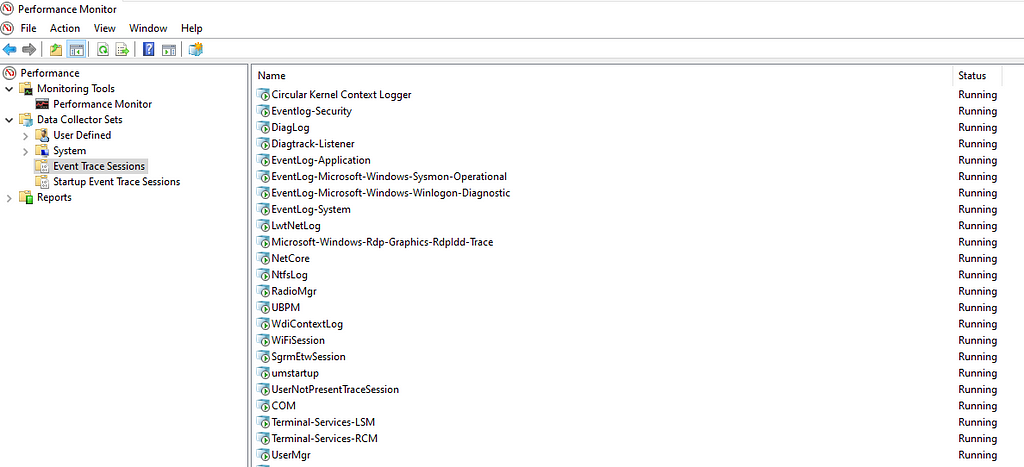
We can also query active trace sessions on the system using logman
# logman.exe query -ets
Data Collector Set              Type                  Status
--------------------------------------------------------------------
...
Circular Kernel Context Logger Trace Running
Eventlog-Security Trace Running
DiagLog Trace Running
Diagtrack-Listener Trace Running
EventLog-Application Trace Running
EventLog-System Trace Running
LwtNetLog Trace Running
NetCore Trace Running
NtfsLog Trace Running
...
Using the name of the trace session we can get more details such as the type and providers that it is subscribed to.
# logman.exe query "EventLog-System" -ets
Name:                 EventLog-System
Status:               Running
Root Path:            %systemdrive%\PerfLogs\Admin
Segment:              Off
Schedules:            On
Segment Max Size:     100 MB
Name:                 EventLog-System\EventLog-System
Type:                 Trace
Append:               Off
Circular:             Off
Overwrite:            Off
Buffer Size:          64
Buffers Lost:         0
Buffers Written:      1345
Buffer Flush Timer:   1
Clock Type:           System
File Mode:            Real-time
Provider:
Name:                 Microsoft-Windows-FunctionDiscoveryHost
Provider Guid:        {538CBBAD-4877-4EB2-B26E-7CAEE8F0F8CB}
Level:                255
KeywordsAll:          0x0
KeywordsAny:          0x8000000000000000 (System)
Properties:           65
Filter Type:          0
Provider:
Name:                 Microsoft-Windows-Subsys-SMSS
Provider Guid:        {43E63DA5-41D1-4FBF-ADED-1BBED98FDD1D}
Level:                255
KeywordsAll:          0x0
KeywordsAny:          0x4000000000000000 (System)
Properties:           65
Filter Type:          0
Provider:
Name:                 Microsoft-Windows-Kernel-General
Provider Guid:        {A68CA8B7-004F-D7B6-A698-07E2DE0F1F5D}
Level:                255
KeywordsAll:          0x0
KeywordsAny:          0x8000000000000000 (System)
Properties:           65
Filter Type:          0
...
To recap. Using these commands we can :
- Get a list of available providers on the system which can be a fun thing to do to discover new providers between newer version of windows [maybe].
- Get a quick overview on the keyword and levels available in a provider.
- List trace sessions on the system and maybe detect if any software you have installed (EDR or AV) uses ETW.
Performance Monitor
Now while you we can create, start, stop and update trace sessions using logman a quicker way (for me at least) is to use “Performance Monitor”.
 Perf Monitor
From the GUI we can see the different trace sessions that are running. By double clicking we can see everything related to a trace. From providers and their enabled properties to the type of the trace. We can also modify these sessions by adding or removing providers and finally we can create new sessions by selecting the “User Defined” menu.
Powershell (.NET)
If you don’t like to use the logman utility there is the possibility to use powershell (.NET) using the “System.Diagnostics.Eventing.Reader Namespace”
System.Diagnostics.Eventing.Reader Namespace
For example to list all the providers:
[System.Diagnostics.Eventing.Reader.EventLogSession]::GlobalSession.GetProviderNames()
To list the properties for a specific provider:
# [System.Diagnostics.Eventing.Reader.ProviderMetadata]("Microsoft-Windows-Powershell")Name : Microsoft-Windows-Powershell
Id : a0c1853b-5c40-4b15-8766-3cf1c58f985a
MessageFilePath : C:\Windows\system32\WindowsPowerShell\v1.0\PSEvents.dll
ResourceFilePath : C:\Windows\system32\WindowsPowerShell\v1.0\PSEvents.dll
ParameterFilePath :
HelpLink : https://go.microsoft.com/fwlink/events.asp?CoName=Microsoft Corporation&ProdName=Microsoft® Windows® Operating System&ProdVer=10.0.19041.1&FileName=PSEvents.dll&FileVer=10.0.19041.1
DisplayName :
LogLinks : {Microsoft-Windows-PowerShell/Operational, Microsoft-Windows-PowerShell/Analytic, Microsoft-Windows-PowerShell/Debug, Microsoft-Windows-PowerShell/Admin}Levels : {win:Error, win:Warning, win:Informational, win:Verbose...}Opcodes : {win:Start, win:Stop, Open, Close...}Keywords : {Runspace, Pipeline, Protocol, Transport...}Tasks : {CreateRunspace, ExecuteCommand, Serialization, Powershell-Console-Startup...}Events : {4097, 4098, 4099, 4100...}As you can see almost all of the elements that we talked about previously are visible here (Events, Keywords, Opcodes, Levels…etc). To query a specific object we can use for example the following command:
# [System.Diagnostics.Eventing.Reader.ProviderMetadata]("Microsoft-Windows-Powershell") | Select-Object -ExpandProperty OpcodesName Value DisplayName
---- ----- -----------
win:Start 1 Start
win:Stop 2 Stop
Open 10 Open (async)
Close 11 Close (Async)
Connect 12 connect
Disconnect 13 Disconnect
Negotiate 14 Negotiate
Create 15 On create calls
Constructor 16 to be used when an object is constructed
Dispose 17 To be used when an object is disposed
EventHandler 18 To be used when an event handler is raised
Exception 19 To be used when an exception is raised
Method 20 To be used when operation is just executing a method
Send 21 Send (Async)
Receive 22 Receive (Async)
Rehydration 23 Rehydration
SerializationSettings 24 Serialization settings
ShuttingDown 25 Shutting down
Message Analyzer
The last tool we’re gonna look at in this section is “Message Analyzer”. That is an alternative to interact with ETW. We can create / update sessions and during the configuration of these sessions we can obtain a list of available providers, available keywords and log levels.
Note: This tool is no longer supported by Microsoft and they don’t offer a way to download it. Fortunately you can easily find it on the internet :)
To do this follow these steps:
- Start Message Analyzer as Administrator
- Select “New Session” and then select “Live Trace”
- Select “Add Providers” — “Add System Providers”
 Message Analyzer — 1
With this we can visualize all of the available providers.
- After selecting a provider we then select the “configure” option
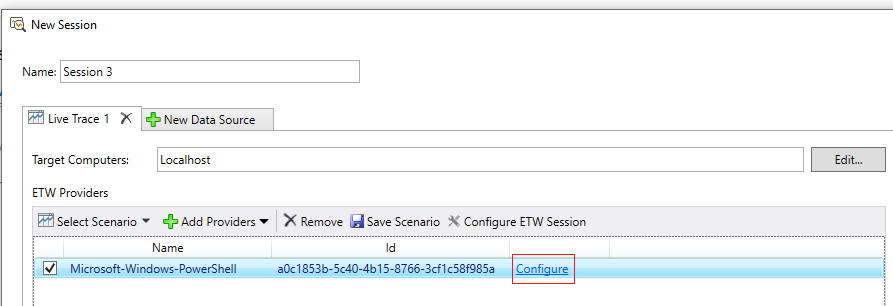 Message Analyzer — 2
And we can see a list of “keywords” and “levels” available
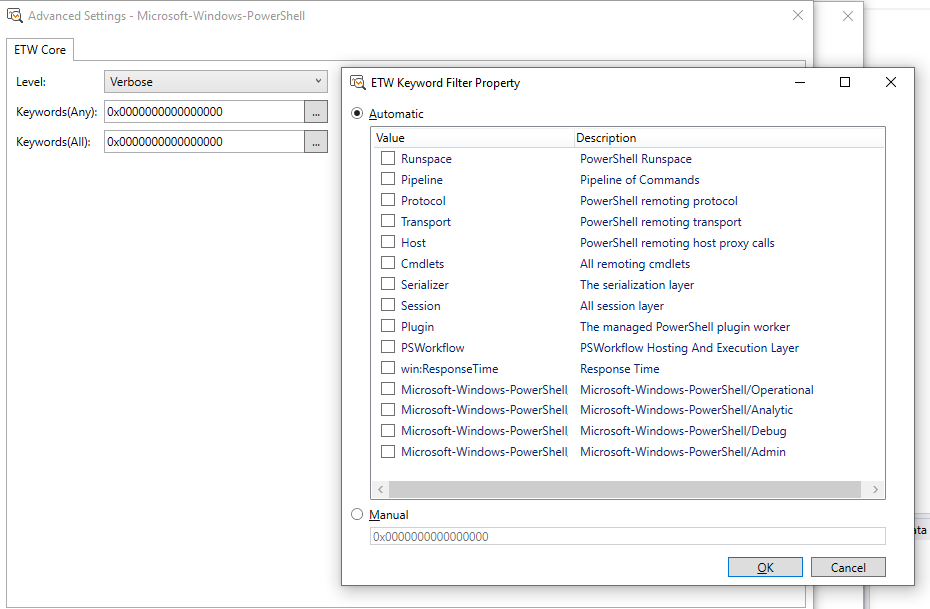 Message Analyzer — 3
Remember this is just another way of seeing the information ;) I suggest you run a quick session to view things in action.
Extracting ETW Providers
We’ve seen some examples on how we can interact with ETW. But sometimes we just want the provider manifest in hand. A single file instead of properties of object. Fortunately there are a couple of ways we can extract these manifests.
ETW Explorer / Perfview
“ETW Explorer” and “Perfview” actually use the same API under the hood to extract the provider manifest.
RegisteredTraceEventParser.GetManifestForRegisteredProvider
We can download ETW Explorer from github and start using it immediately
GitHub - zodiacon/EtwExplorer: View ETW Provider manifest
We are presented with a GUI interface that is pretty self explanatory. You select the provider you want and it shows the results. (See image)
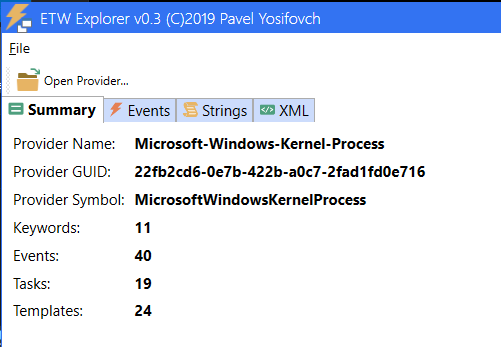 ETW Explorer — Summary
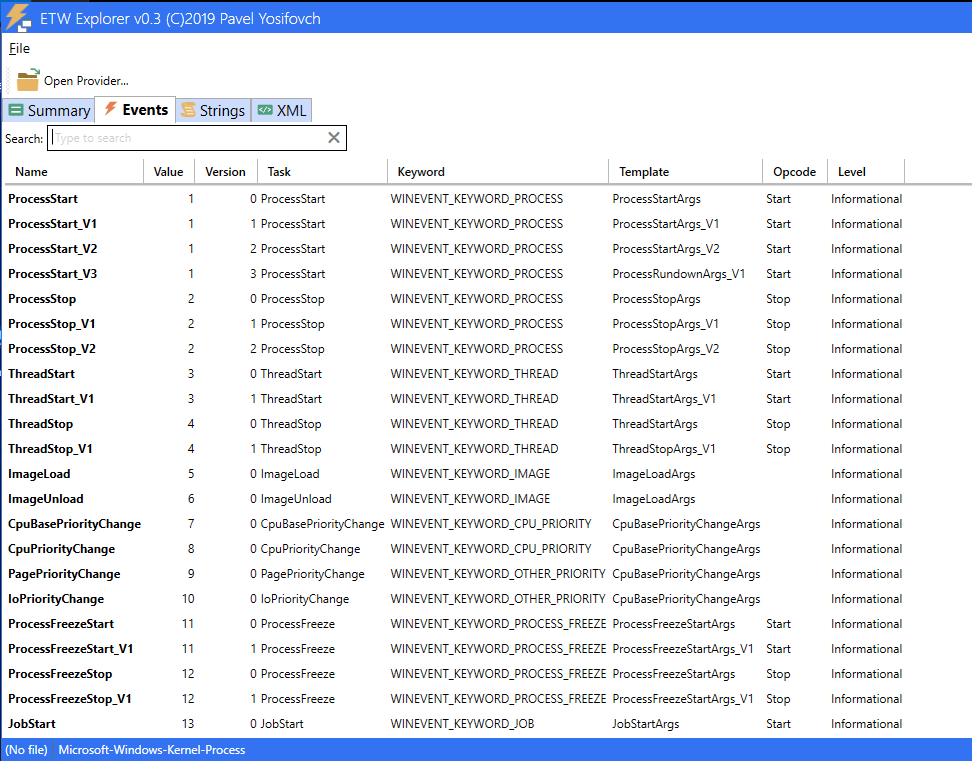 ETW Explorer — Events
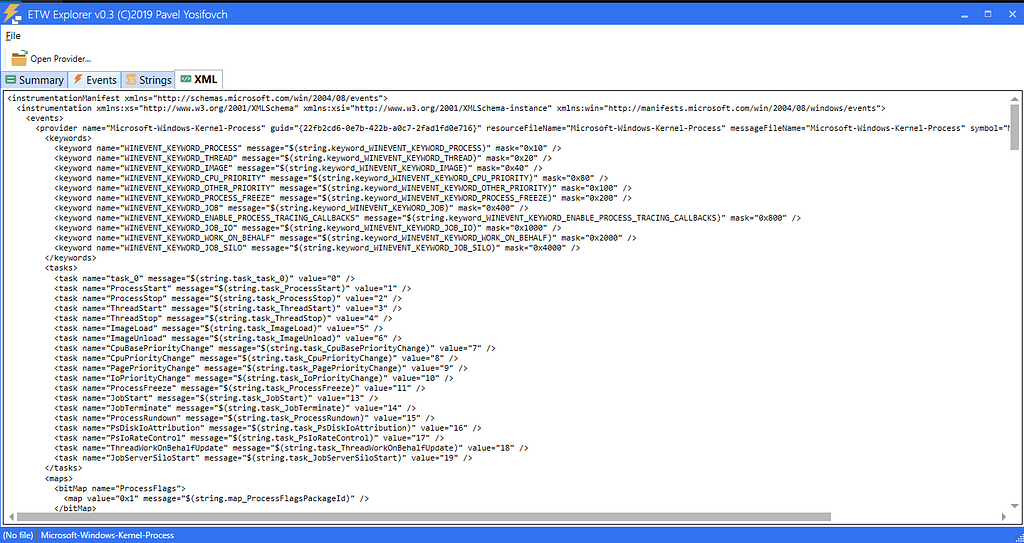 ETW Explorer — Manifest
Similarly using perfview we can dump the provider manifest using the following command from the GUI
DumpRegisteredManifest providerName [outputFileName]
Open perfview and select “File” -> “User Command” or press “Alt+U” and then type the command below.
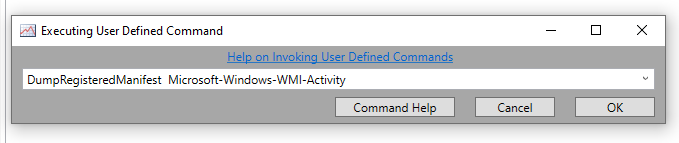
This will dump and XML file with the same name as the provider in the directory where perfview is running.
One thing you’ll notice when dumping manifests this way is that the files sometimes don’t contain all of the XML element mentioned at the start of this blog such as the “Channel” element. This is due to how the “dumping” function is implemented (See source)
Fortunately there is another tool that’ll provide’s us with a different output.
WEPExplorer
Similar to ETW Explorer, WEPExplorer let us visualize ETW provider manifests. (Download the tool here)
WinTools/WEPExplorer at master · lallousx86/WinTools
This tool uses a similar concept as described in this MSDN blog and uses the “winevt” API.
Getting a Provider's Metadata - Win32 apps
It’s straight forward to use just launch it, search for the specific provider and double click it. Here is an example using the “Microsoft-Windows-Kernel-Process” provider:
 WEPExplorer Output
The output pretty much contains all of the elements available in a manifest. The tool automatically generates an XML file for us once we double clicked on the provider. Just search the folder from where its launched.
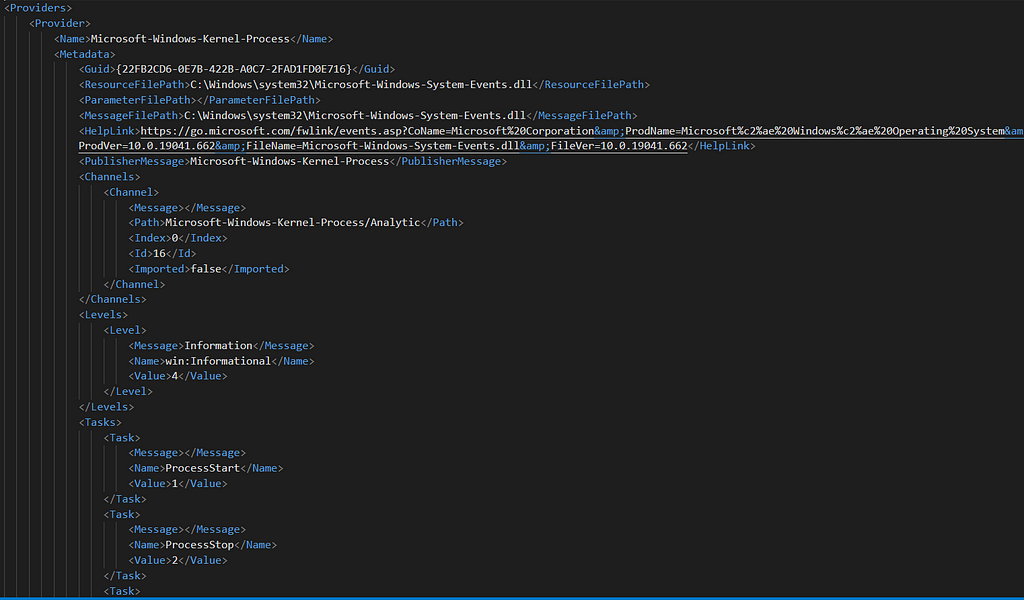
As you can see the output is a little bit different from what we’ve seen at the start of the blog but the information is exactly the same. I suggest you use both tools when dumping an ETW manifest to get the full picture.
Script ETW
The last aspect i wanted to talk about before we wrap this, is the ability to talk to ETW via a programming language. There are multiple option to interact with ETW pragmatically such as:
- KrabsETW
- SilkETW
- PyWintrace
- Powershell(.NET)
- WinAPI (Tdh.dll, Wevtapi.dll)
And the list goes on. Those are all really cool tools that you should definitely check out if you want to write some detections or understand more of ETW. Check out the GitHub resource at the end for a more thorough list.
More ETW
Visualizing “Analytic” / “Debug” Channels
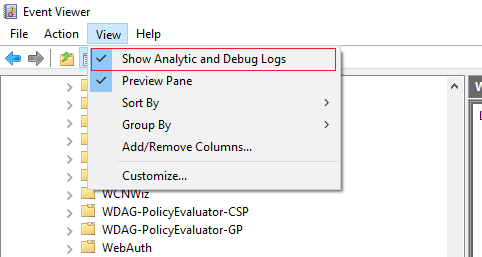
When you use WEP Explorer you’ll notice that there are a lot of ETW providers that output to either the “Debug” or “Analytic” channels. By default these channel don’t show up when using the event viewer. But you can easily enable them by opening Event Viewer and clicking on the “View” tab (See image)
After doing this the “Debug” and “Analytic” channels will be visible but not yet enabled. To enable one we must right click on the log and choose “enable”
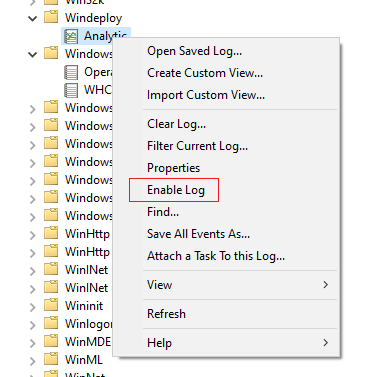
Once this is done the system will create an new trace session for this specific provider so keep that in mind.
Regist(ry)ered ETW Providers
All of the registered ETW providers can be found in the registry in the following path
HKLM\SOFTWARE\Microsoft\Windows\CurrentVersion\WINEVT\Publishers\
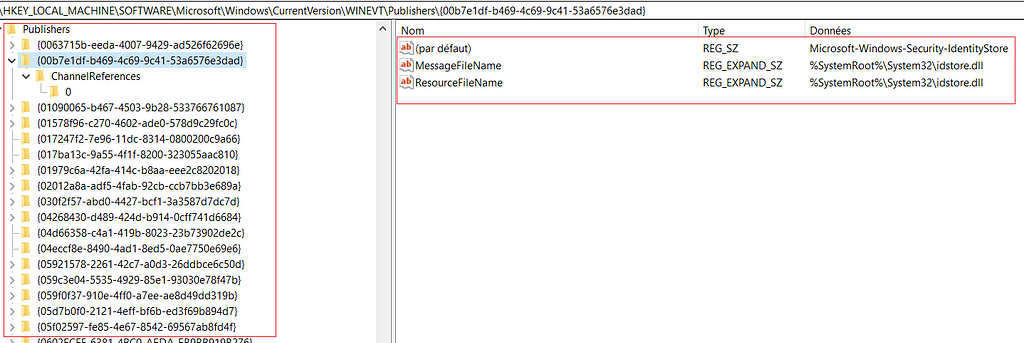 Registry location
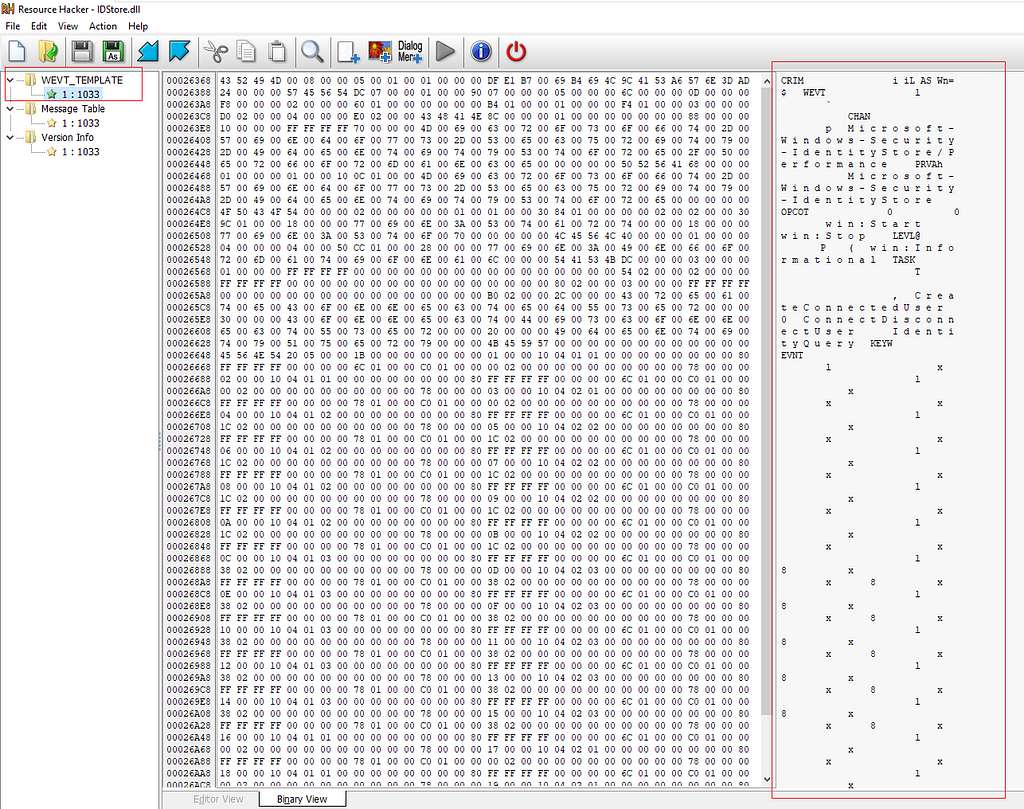
As we can see the “ResourceFileName” and “MessageFileName” are the same referenced inside the manifest and actually if we take a look at one of these Resources Files we can find the binary structure that contains the Manifest definition that we dump using the tools above. (Here is how it looks using a tool like resource hacker)
Conclusion
Thanks for reading and a big shout out to palantir for their blog on ETW its a really great read.
Tampering with Windows Event Tracing: Background, Offense, and Defense
And many thanks to Microsoft for their documentation on MSDN. I hope you found this post useful and got something out of it.
I’ve compiled all the interesting resources that I've found with some other stuff in a GitHub repository that you can find here
GitHub - nasbench/ETW-Resources
Finally, the next blog will be about how to use the information in this blog to try and find some detection and forensic goodness. So stay tuned :)
For anything else you can find me on twitter @nas_bench
Article Link: A Primer On Event Tracing For Windows (ETW) | by Nasreddine Bencherchali | Medium