JPCERT/CC Cyber Metrics Group utilizes various kinds of data in order to understand what is happening on the Internet and call for appropriate cybersecurity measures based on the analysis. For example, we operate TSUBAME [1], an Internet threat monitoring system, and Mejiro [2] , an Internet risk visualization service. In this article, we used data from Shodan Trends to check how the recent situation in Ukraine looks on the Internet.
What is Shodan?
Shodan [3] is a service that scans the Internet and uses the responses to find out what devices are connected and where they are hosted on the Internet.You can search for devices by various queries and get detailed information such as which countries are more connected, which versions of software are more commonly used, and so on.
While the basic use of Shodan as a search engine is to look up information at the time of a search, it also offers a separate service called "Shodan Trends" [4]. This service provides a time-series data of the number of scan responses by various aggregation axes using accumulated scan data. Currently, monthly data since June 2017 is available.
While the military situation in Ukraine has been reported, we used data from Shodan Trends to see what the situation is like on the Internet.
Ukraine in Shodan Trends
Shodan Trends provides time-series data by ASN, city, organization, port number, product, and various other angles, and so we used this data to see any changes in Ukraine. The following chart compares the total number of scan responses obtained from each of the five aggregation axis. In Ukraine or in any region, the behavior can be different depending on the aggregation axis, perhaps due to differences in observations and subsequent data processing. Similar differences are found in Mejiro [2], an Internet visualization service provided by JPCERT/CC.
Fig.1 shows a large gap in data by city and organization after March 2021. The reasons for this gap are not clear, but the trends are generally similar, except for the data by product. The amount of data by product is extremely small, but this may be due to the fact that only a few products can be identified from the scan responses. Here, we look at trends for Ukraine as a whole, using data by port number as shown in Fig.2, which has remained relatively stable.
The number of Internet-reachable devices appears to be slowly decreasing as a whole. This trend is probably due to the increased attention to devices and servers connecting to the Internet and the countermeasures such as applying updates are becoming more prevalent. For example, as seen in Fig.3, when we focus on products that appears to be broadband routers, we see a similar downward trend. We suspect that this trend is due to the replacement of older router products with newer products.
We now turn our attention to changes in the data around Feb 24, 2022; the time when the invasion into Ukraine began. In Fig.4, the prediction for 2022 based on the data prior to December 2021 is also displayed. We use Prophet [5], a time-series analysis package provided by Facebook, for forecasting.
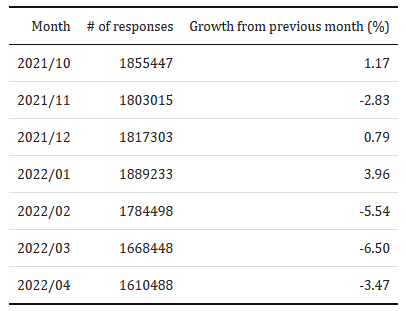
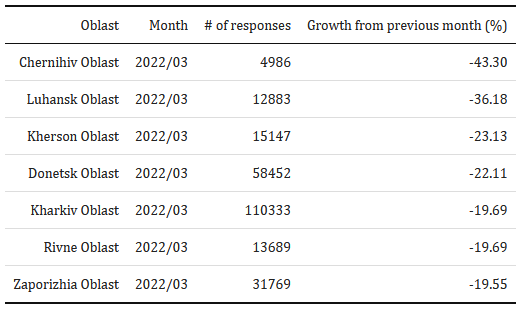
While the major trend in Ukraine since 2017 seems to be a gradual decrease in the number of Internet-reachable devices, the most recent values indicate a sharp drop, which looks outside of that trend. Table 1 shows the number of cases and the growth from the previous month, indicating that the number, which used to be relatively stable since 2020, has been continuously falling since February. Based on the media coverage about the local situation, we assume that the Internet accessibility may have been reduced due to physical disconnection of devices or network infrastructure.
For changes by product and by Ukrainian oblast, see Appendix.A and Appendix.B.
Summary
Using data from Shodan Trends, we can see what is happening on the Internet. In this article, we saw the data from Ukraine and found the following facts in the number of responses to Shodan scans:
- The number of Internet-reachable devices reachable in Ukraine has been on a long-term downward trend, possibly due in part to the increasing replacement of older products with newer ones
- A sharp decline is seen from March 2022, far outside the previous downward trend, and this is especially applicable in areas of intense invasion, as seen in the Appendix
In time series scanning data such as Shodan, we can see that similar changes have occurred many times so far due to the effects of natural disasters, access restrictions, and other external factors. There are also several examples of analyses using such scan data, like analyzing the increase or decrease in scans and remaining vulnerabilities. We can objectively understand what is happening on the Internet by looking at data. JPCERT/CC will continue to study the possibility of utilizing various types of data. If you are interested in data analysis in the context of cyber security, we would be happy to hear from you.
Yuki Murakami
Appendix
Appendix.A Behavior of Data by Product
With regards to the downward trend in Internet-reachable devices in Ukraine, it is important to indicate which devices are declining.
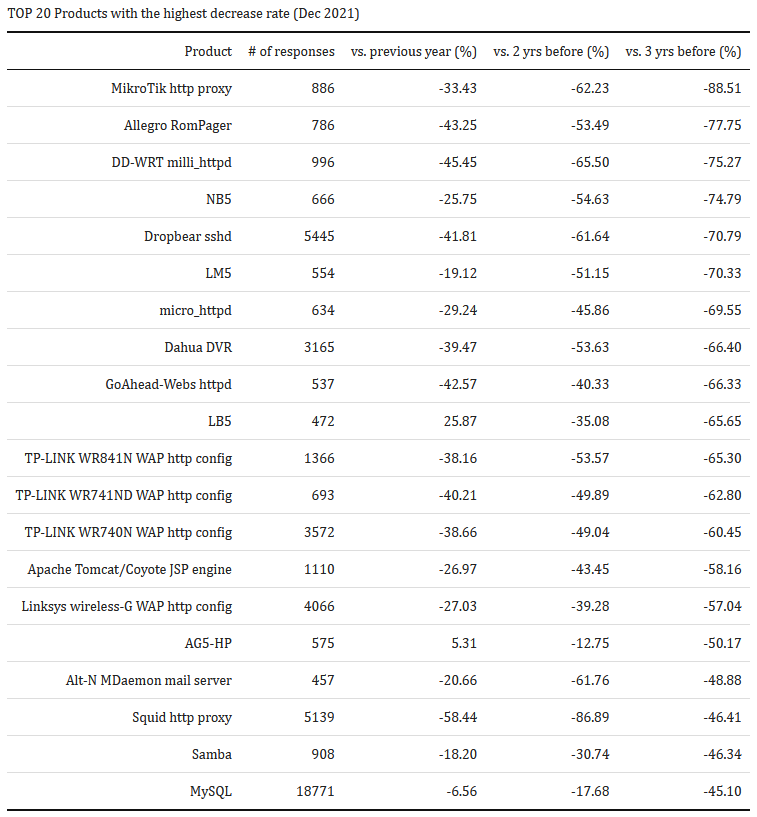
Table 2 compares the number of scan responses by products between December 2021 and the same month of the previous 3 years respectively, sorted in descending order of decreasing percentage from 2018 to 2021. Comparing December 2018 to December 2021, there were 42 products that no longer responded to scans. We assume that older products and servers are being updated.
There were 10 products that increased over the three-year period. Table 3 shows in order of the largest percentage increase compared to the values three years ago. We have seen changes in the Internet use, services, and connected devices in Ukraine.
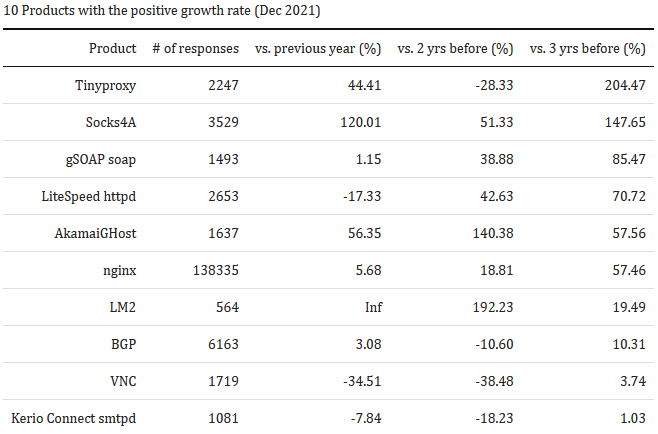
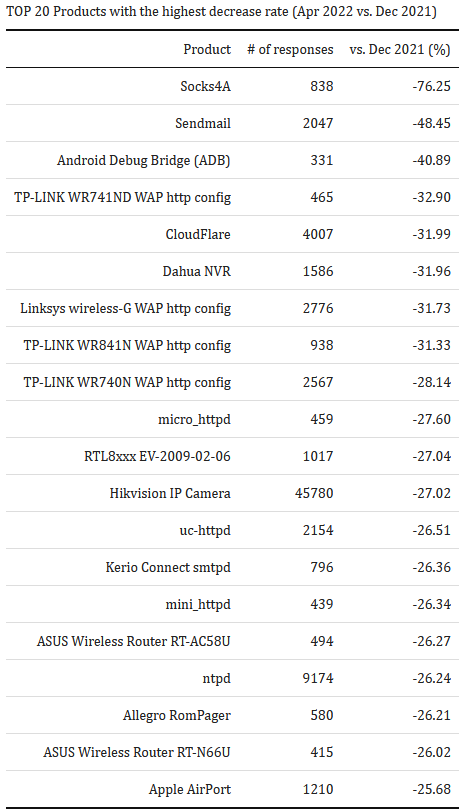
Table 4 shows the Top 20 products with the largest percentage decrease as of April 2022 compared to December 2021(Those with a non-zero number of cases in April 2022). We can see that the impact is widespread with specific-use network services (Socks), broadband routers, and DVRs.
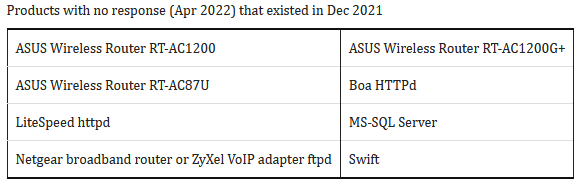
Products that existed in December 2021 but had zero cases in April 2022 are listed in Table.5. Connectivity of devices such as WiFi routers was lost.
Appendix.B Changes within Ukraine (by oblast: Ukraine state)
The data by region reveals more of the impact of the invasion.
The city-by-city data from Shodan Trends cannot be used as-is due to the orthographic variation and misspelling of city names, but here we have corrected these errors and used the results aggregated by oblasts (24 oblasts, 1 autonomous republic, and 2 special cities). However, data in which we were not able to identify its oblast were removed.
Fig.5 shows the time series of results aggregated by oblast. The value for the city of Kyiv is quite high compared to the other oblasts. The usage is probably concentrated in urban areas.
Just like in the comparison by city, there is a large gap in March 2021, most of which appears to be due to the increase in the city of Kyiv.
In Fig.6, we plot the percentage growth from the previous month by oblast on the map in March 2022, when the number of scan responses declined sharply.
In order to display the map by oblast, the special cities of Kyiv and Sevastopol were combined into the Kyiv Oblast and the Autonomous Republic of Crimea, respectively.
This map shows a decrease in the number of responses, mainly in the eastern and northern parts of the country where the invasion is most severe, and it seems likely to be the main reason for the sharp decline in March.
(* We see an extreme increase in Kirovohrad Oblast near the center, but it returned to the normal level in April; factors unknown, but considered temporary)
Reference
[1]: TSUBAME: https://www.jpcert.or.jp/english/tsubame/
[2]: Internet Risk Visualization Services Mejiro: https://www.jpcert.or.jp/english/mejiro/
[3]: Shodan: https://www.shodan.io/
[4]: Shodan Trends: https://trends.shodan.io/
[5]: Prophet: https://facebook.github.io/prophet/