Troubleshooting issues in Kubernetes can be tough. When diagnosing these problems, you can find yourself with tons of microservices to review. Sometimes you come across the root cause straight away, but when dealing with complex issues you may lose a lot of time going back and forth, and time is a precious asset when everything goes up in flames.
Sysdig Agent leverages eBPF for granular telemetry. It not only pulls metrics from your Kubernetes clusters, but gets insights from the Kernel capturing syscalls in real time. This data is used to generate new metrics and to enrich others. As a result, your own application metrics now gain Kubernetes and cloud context.
Extended labels give you a wider visibility on what’s going on in your cluster, correlate your business metrics with Kubernetes and cloud valuable data, or get insights on which application process within a container is making noise. With Sysdig, you can do all these things and much more thanks to the metric enrichment provided out of the box.
Do you want to learn more? Keep reading and discover how extended labels in Sysdig can help you troubleshoot issues.
Troubleshooting issues with extended labels
Sysdig Advisor is a troubleshooting product in Sysdig Monitor that helps users troubleshoot issues in Kubernetes environments. You won’t only find performance related metrics, but plenty of information about the Kubernetes objects, status, events, logs from Pods, and much more. Everything you might need to find the root cause of an issue is in Advisor.
In this troubleshooting use case, we use Sysdig Advisor as a starting point of our troubleshooting exercise. Here, you can easily get clues on the issue itself, like: which are the applications involved, when did the problem start, is there any Kubernetes event that can give clues on the problem, or the application logs reported in every Pod, etc. When dealing with complex issues, we may need to dig deeper and make use of metrics extended labels. In this troubleshooting exercise, you’ll see how powerful this feature is, the enormous amount of possibilities that it offers, and how to make use of those labels in Sysdig Monitor.
In our Kubernetes cluster, we have a few microservices running in the default namespace. These applications have their own dependencies, but for this use case it’s not worth mentioning these relationships. Let’s go straight to the point!
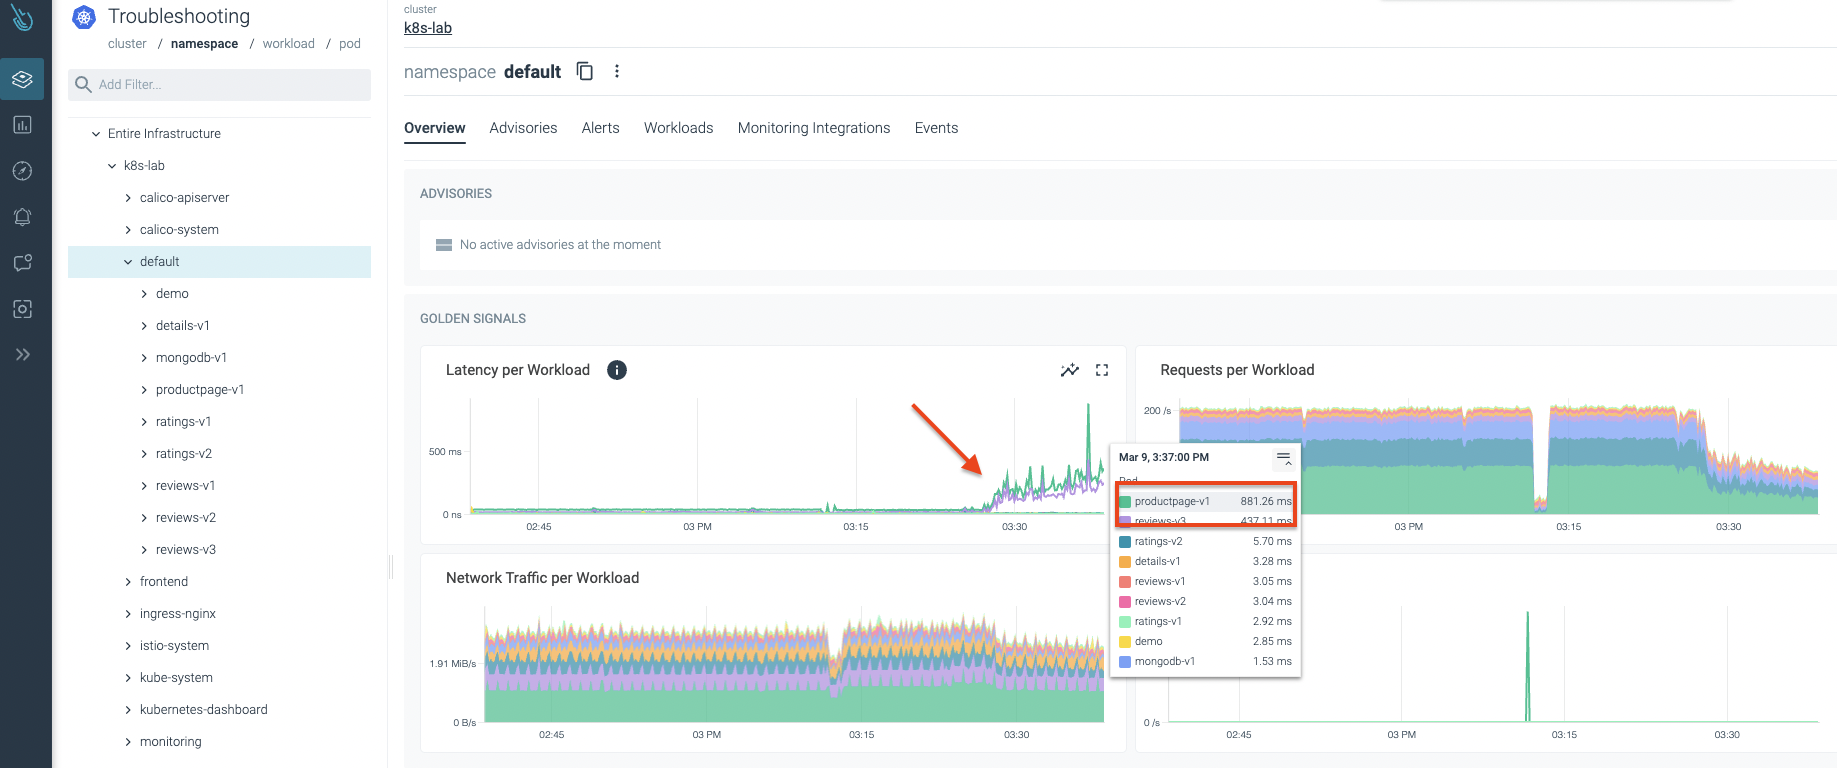
An abnormal behavior is detected in the Sysdig Advisor console. As you can see in the following image, there is a latency spike. One of the applications seems to be facing some kind of issue, and latency started to increase suddenly!
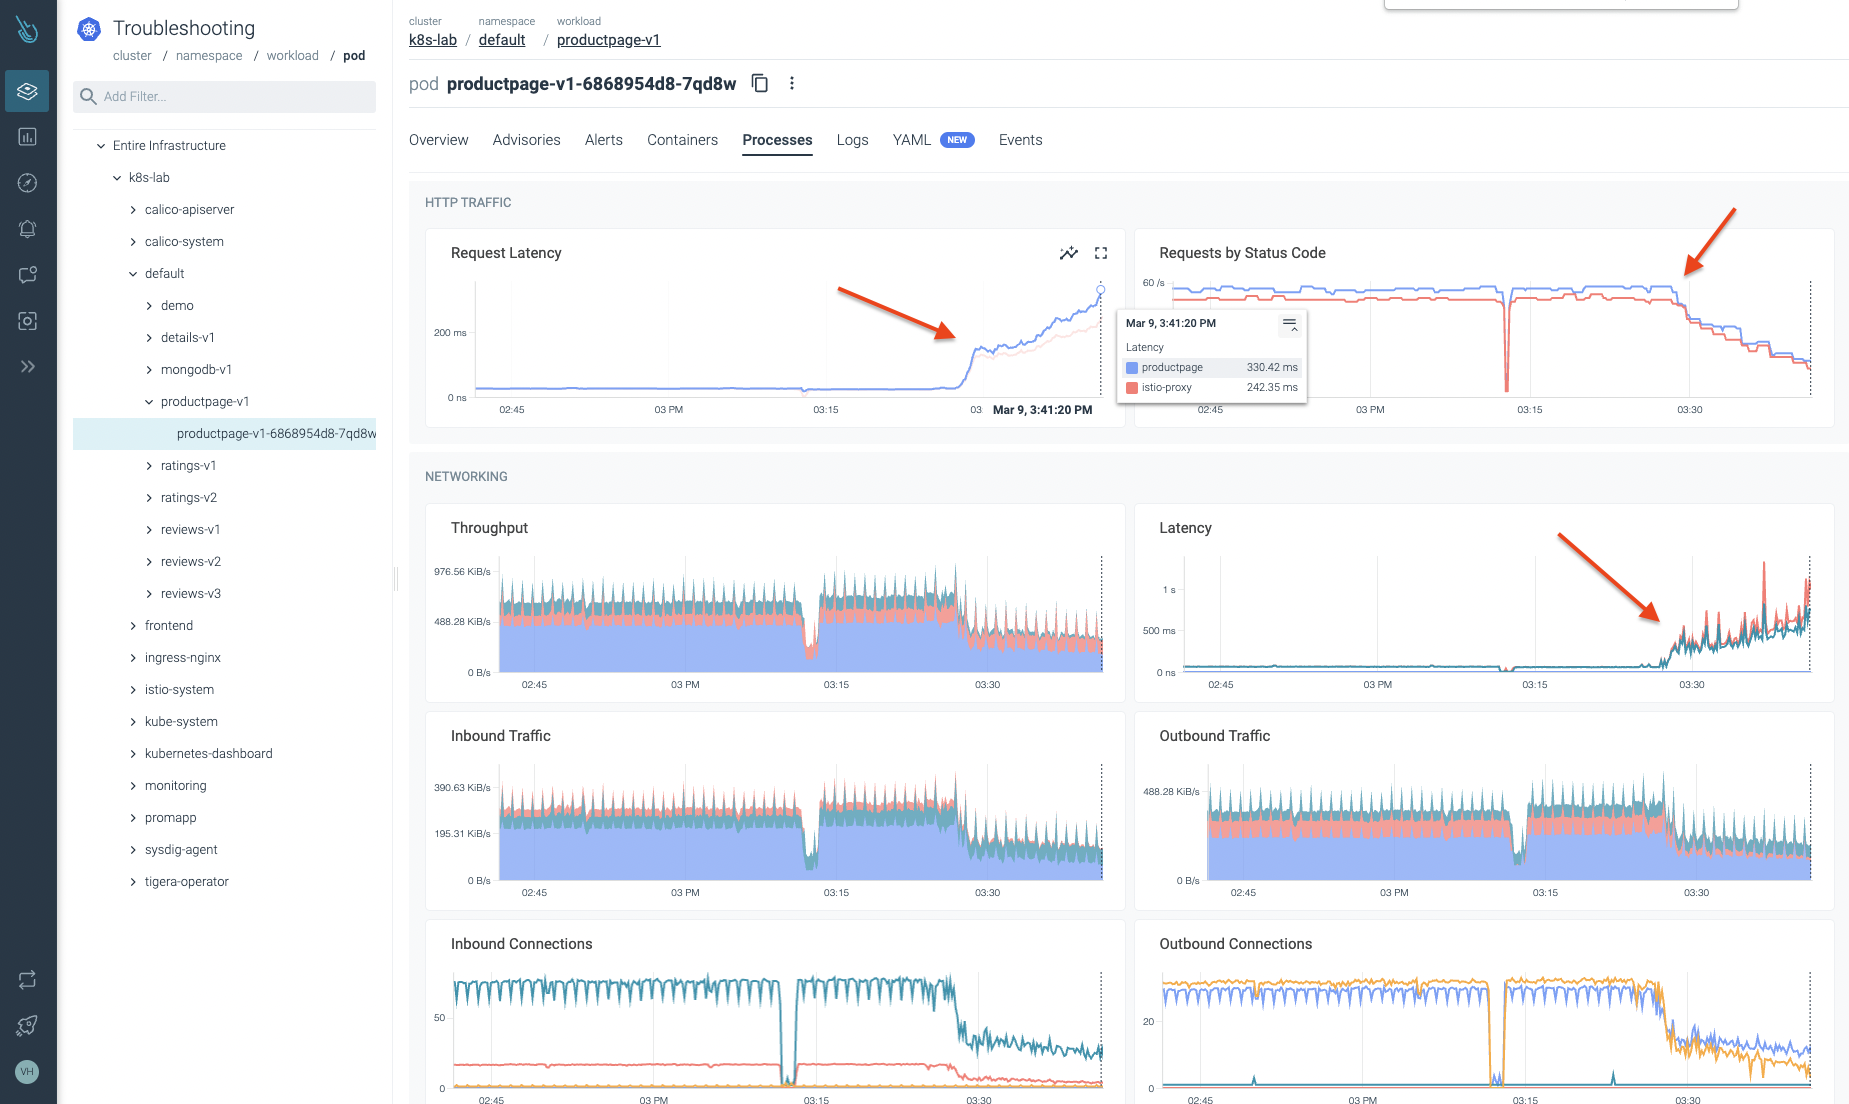
Let’s dig deeper into the default namespace. We start reviewing the workload that seems to be going through problems. As you can observe in the following image, we can certify there is a potential issue with this workload. Latencies growing and traffic being dropped can’t be good.
As described in this article, Sysdig not only pulls metrics from your Kubernetes nodes and cloud environments, but it leverages eBPF to get kernel data from Syscalls. After pulling this data, Sysdig agent combines this information and turns it into metrics.
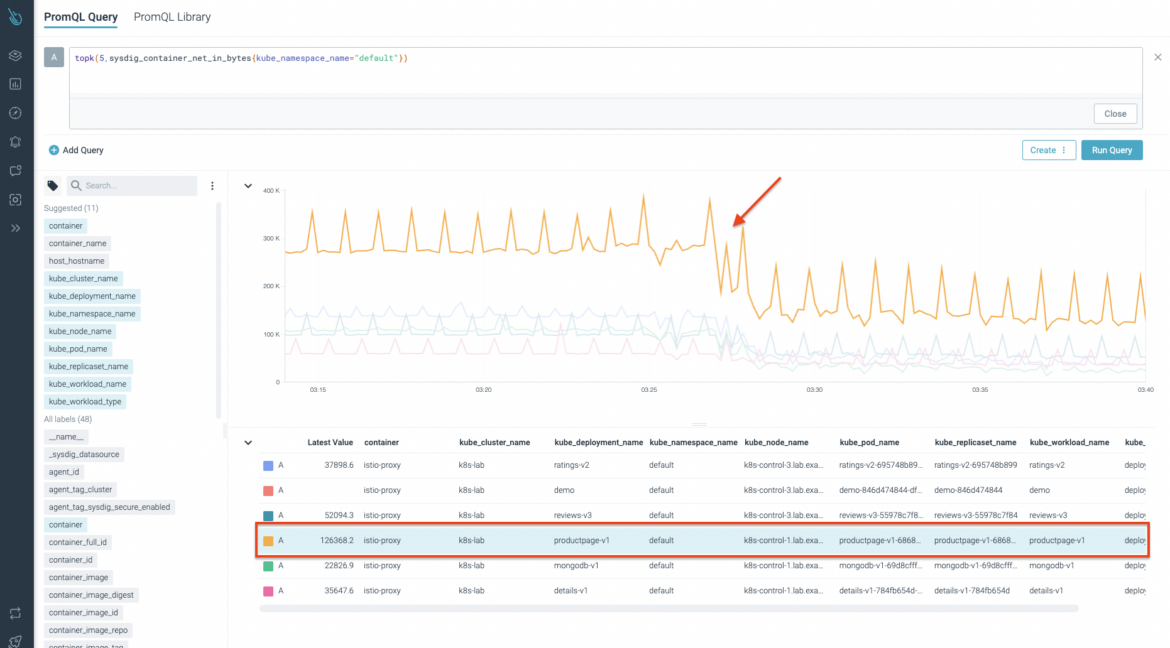
This time, we use one of the Sysdig metrics for network container inspection: sysdig_container_net_in_bytes. This metric provides the number of inbound network bytes for that scope. As you can see in the following image, you can certainly identify a network traffic drop at the same time latency starts to grow. Thanks to the metrics enrichment, you can get valuable information like the kube_deployment_name, kube_pod_name, container, kube_replicaset_name, kube_workload_name, kube_workload_type, and much more, as you’ll see very soon.
Next, we use the sysdig_program_net_in_bytes metric. This metric gives you further information, like the cmd_line, which is the running process detail for a specific container. In the following picture you can see the top result belongs to the productpage-v1 workload, and more specifically, to the envoy process.
It’s time to find the culprit of such network issues. For that, we use a more generalistic metric, sysdig_connection_net_in_bytes. That way, we can check at a wider scope. We have to wisely choose the extended labels we need to correlate the events, like cmd_line, net_client_ip, net_local_endpoint, net_protocol, and net_remote_endpoint.
In the image below, you can see the top result belongs to a curl process running in a promapp application. Thanks to the extended labels that Sysdig provides out of the box, we can easily identify the source IP, the remote IP, and port.
We just found the offending container and the process responsible for those network issues in the productpage-v1 service!
Let’s check in the promapp Pod to verify whether there is a curl process running. Yes! That process is the culprit of injecting a high amount of traffic into the productpage-v1 service.
root@promapp:/go# ps -ef
UID          PID    PPID  C STIME TTY          TIME CMD
root           1       0  0 11:41 ?        00:00:03 /bin/prometheus-example-app
root          15       0  0 14:12 pts/0    00:00:07 /bin/bash
root       17725      15  0 14:59 pts/0    00:00:00 /bin/bash
root       17740   17725  0 14:59 pts/0    00:00:00 curl -s -o /dev/null http://192.168.119.31:30296/productpage
root       17741      15  0 14:59 pts/0    00:00:00 ps -ef
After talking to the team responsible for that service, we have the green light for recreating that promapp application! In the meantime, they are getting their hands dirty inspecting and fixing that service.
Voila! After recreating the promapp Pod, everything seems to go back to normal.
Conclusion
In this article, you have learned about the importance of extended labels for application troubleshooting. Thanks to the metric enrichment that Sysdig provides out of the box, your metrics gain Kubernetes and cloud context. Information like the process running in a container, the deployment name, or any other Kubernetes and cloud labels can be key when troubleshooting issues in Kubernetes.
If you want to learn more about how Sysdig Monitor can help with monitoring and troubleshooting your Kubernetes clusters, request a 30-day trial account and try it yourself. You’ll be up and running in minutes!
The post Troubleshooting Application Issues with Extended Labels appeared first on Sysdig.
Article Link: https://sysdig.com/blog/troubleshooting-application-issues/


