
I want to share below a roller coaster experience me and my team had while coming up with optimal Solr setup for our use case. The performance was so bad for most of our testing that we ended up optimising almost all parts of our setup including the config, schema, environment, JVM settings and the queries. We learned many valuable lessons during this exercise and hopefully you will too.
The problem
- We had 40 million documents (with avg. doc size of 1 kb) so total index size is ~40 GB. The document count will remain more or less same overtime though we will have high number of updates coming in.
- Our query has a fixed pattern and only has 5 or 6 filter queries (fqs) (no query search term, facets or sorting).
- P99 read latency has to be within 150ms.
- We will be limiting updates to 150K documents per min .
Machine size is fixed at 28 GB RAM and 8 Core CPU. - The commit interval is set to 15 mins which is our SLA for any updates to be visible to the user.
And what we want to optimise is for read throughput after meeting our latency SLA and write throughput limit .
Initial setup
Based on the above info and then reading a lot of articles on Solr (which I will link below and can be pretty helpful) we came up with our initial setup of 5 shards.
This was based on the fact that 40GB index/5 shards=8GB/shard. We know that you want your Index to be cached on your OS file cache. So we kept JVM heap size at 16GB, which means we are leaving almost 12GB for the index and some buffer. Also the fact that more shards means your writes get divided and based on our previous testing we knew that single shard can handle around 30K doc updates per min.
Everything looks good till now and we have no reason to doubt that setup will not work.
Testing
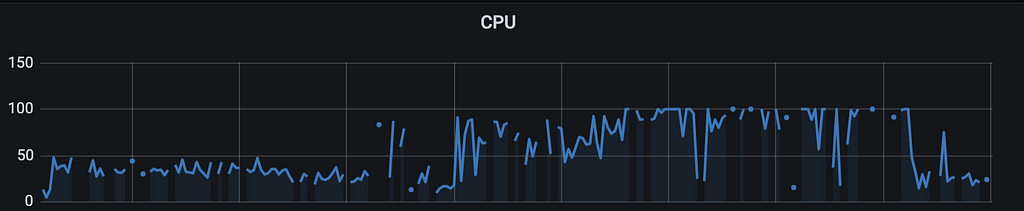
At this point we ran our first perf test but the results were quite unexpectedly horrible. We were barely able to support 1 QPS per node. The system CPU reached 100% and then crashed after few hours of testing (that too with writes disabled). Look at the metrics below -
P99 Latency at ~50secCPU reaching 100%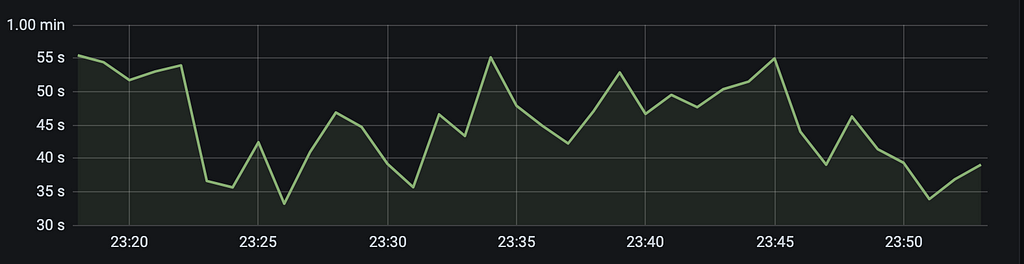
Post this we ran multiple tests to understand and fix the root cause -
— our filter cache had a hit ratio of 0.6, in order to improve this we increased our filter cache size. This did not help as JVM heap usage and CPU were still reaching 100%
— document cache had decent hit ratio of 0.5 but very high eviction rate which would have caused more frequent GC cycles. So we reduced document cache size. Though still not much improvement.
— on re-visiting our schema.xml we found that few fields did not have indexed=true and we were running filter queries on them. So we updated the schema. Still no luck.
Even though none of the above optimisations had much performance impact, one thing we noticed was that filter cache warmup time was around 500secs which was extremely large for our queries. And given CPU and JVM heap size were constant bottleneck in our tests, we decided to move our setup and test on higher config XXL machines with 128GB RAM and 32 cores CPU.
Finally some hope
During our first read only (no writes) test with XXL machines, the CPU peaked at 60% during the entire 4hr duration of the test. We had no major GC runs and JVM heap usage was maximum 70%. The P99 dropped to 111ms which seemed incredible at the time.
For the next test we introduced writes at 21K doc updates/min. But the read latencies changed quite drastically during this test. The P99 was around 37secs even though P95 was still around 100ms. This vast difference in P99 and P95 latencies meant that we needed to dig deeper into what was happening.
Understanding Solr writes and performance
Within Solr as soon as you introduce writes, your setup performance can change drastically. This can be primarily due to the following reasons —
— all caches will now get invalidated after each commit and have to be warmed up again.
(To manage this better Solr will automatically pre-populate caches for top queries from the earlier cache. The time taken in this is called cache warm-up time)
— Write requests will start taking up CPU cycles as well
— Increase in number of segments over time can reduce read latency
(to counter this Solr runs “optimise” based on Solr Merge policy. Though the optimise step has a major cost in terms of CPU and disk usage. So it’s best to configure it to run infrequently)
— Disk I/O can be major bottleneck during hard commit if enough memory is not present to cache written data in OS Page cache
As we understood more about writes impact on Solr setup we concluded that for us, the caches getting invalidated resulted in some of our queries taking large amount of time to process. And the same queries must be responsible for the extremely large cache warm-up time that we observed in earlier tests.
Optimisation: Queries
We had one fq with frange filter on a function which computes max and min price based on few other fields for each document. On deep diving into this we found that in Solr all fqs are run on the entire index by default and then intersection is taken on these individual results. Solr does this to take advantage of filter cache, as it can cache these results independently and then use them for all future queries. But the problem with this approach arises when there is a fq which does not repeat frequently (such as a range filter) and is very expensive to calculate. Such a fq is going to radically degrade overall query performance.
To manage this Solr provides an alternate approach where we can add cost parameter to such fqs and any fqs with cost>=100 are run on the resultant set of the rest of the query as opposed to the entire index. And for frange queries (in SOLR 8) with cache=false defaults to cost of 100 as explained in this JIRA ticket. So that is exactly what we did. Post which our -
— P99 reduce to 130ms from 37secs.
— filter cache warmup time reduced to 20secs from 500secs
Example use case -
Min price selected is 0
Max price selected is 1500
Original query -
{!frange l=0.0 u=1500.0}
Optimised query -
{!frange cache=false l=0.0 u=1500.0}
Though this was a good first step in the right direction but we were excited to run our tests again on the original XL machines with 28GB memory and 8 core CPU. The XL machines were almost one-third the cost and would have resulted in major cost savings.
Back to original setup
The next test with XL machines were significant improvement over the earlier runs —
— the CPU and JVM heap usage did not spike to 100%
— the P99 latency started around 150ms but was gradually increasing and reaching ~70 sec after 4 hrs
This meant that there were still other bottlenecks in our setup.
Trying to do something new (Image source: Medium)
Finding the bottleneck
Testing if query is the bottleneck —
We had already optimised one part of the query and seen very good improvement. To further investigate into our queries, we ran one experiment in which we removed all the fqs from our query except the term filter which was responsible for fetching the documents back.
Sample simplified query —
“q”: “:”,
”fq”: “{!terms f=item_id}2ZSZKDSO4X5T,2WCULXLPA0JO,6R9RIWPF50AL,2EQYBAO5L251,69HCJ07YYR6T,14WVKW7HK898,10KWB6Y3YQE9,4R8JZCRANJVO,26WMP7XFQ5XA,1ZV85IKWLSWU,5BPBP26KIBBO,2RIRBKGUEVO6”,
”wt”: “json”
Even this simplified query did not result in any performance improvement. Hence we can rule this out.
Testing if network is the bottleneck —
We knew the network bandwidth on XL machines is much lower than XXL machines. Given this fact, inter shard communication could have been a major bottleneck. To test this we limited all our queries to only fetch data from a single shard using the shards query parameter.
As we didn’t see any performance improvement, we ruled this out as well.
Testing if Disk I/O is bottleneck —
Disk I/O can be a major bottleneck especially when Solr latency is concerned. By default Linux will automatically cache frequently used files into OS Page cache (if free memory is available). Reading from memory is much faster than from reading disk (even if the disk is SSD) as can be seen from example below.
First run (file is being read from disk)
[my_linux_machine]$ /usr/bin/time -p cat 20_GB_FILE > /dev/null
real 177.64
user 0.50
sys 21.5
Second run (file is now cached in memory by OS)
[my_linux_machine]$ /usr/bin/time -p cat 20_GB_FILE > /dev/null
real 10.50
user 0.39
sys 10.10
As you can see once the file is cached, the time to read it drops from 177sec to 10sec. Solr relies on this system behaviour to cache it’s index files for better performance.
You can monitor the available memory using free -m and disk I/O using iostat/vmstat. You can also use amazing free utilities like vmtouch to lock your index on OS page cache.
Optimisation: JVM tuning
To allow us to optimise for disk I/O, we decided to reduce our JVM heap size. Along with this to ensure we don’t run into OOM issues on heap space we —
— reduced filter cache size back to original settings
— disabled fieldValueCache and documentCache altogether because of their high eviction rate
We did the test with JVM heap set to 8GB (from 16GB initially) and voila we get amazing results back —
— P99 read latency reduced from avg. 30secs to 137ms.
— CPU and JVM heap were still under limits and no spikes were observed
One final optimisation (or so we thought)
We tried to do one more optimisation which was merging the index to a single segment before starting the test as suggested by a lot of articles on tuning Solr. Though Solr uses merge policy to “optimise” the index, you can still force optimise manually.
To manually optimise (merge segments) -
/update?optimize=true&maxSegments=1
However for us the results were very poor. The P99 jumped to 79secs. In our case as opposed to the general guidelines, index with multiple smaller segments performed much better compared to index with a larger single segment.
Final Result
We now have our final setup. And if we think about it, we did not make any complicated changes in Solr to achieve the same. Though it did require us to build proper understanding of underlying Solr design to evaluate and make the required optimisations. And as we can see from this exercise (gist captured in table below) there is huge performance gain to be realised with proper tuning.
<a href=“https://medium.com/media/3d5cb64580477706f854ad1394d6e9c7/href”>https://medium.com/media/3d5cb64580477706f854ad1394d6e9c7/href</a>Lessons learned
Solr has a lot of moving parts which are affected by each other. So tweaking one parameter can have undesired results on some other parameter. Therefore it is very important to iteratively test your setup and make only few changes between these tests in order to be confident that you are moving in the right direction.
- There is no definitive answer for sizing Solr hardware. Iteratively tuning and testing your setup is the only real method.
- Monitor your disk I/O. (Unless latency is not a concern at all)
- Set your Solr JVM heap size carefully. It should be able to accommodate all caches and internal objects while leaving enough headroom to avoid running frequent GCs but not so large as to not leave room for OS page cache to cache your index.
- Check for any fqs which are unique across queries and mark them as cache=false.
- Solr Caches are not always your friend. Monitor your cache hit ratio and eviction ratio. Both low hit ratio or high eviction ratio is bad for your setup. We disabled document cache altogether and saw no degradation in latencies.
Further reading
Solr Performance Tuning was originally published in Walmart Global Tech Blog on Medium, where people are continuing the conversation by highlighting and responding to this story.
Article Link: https://medium.com/walmartglobaltech/solr-performance-tuning-beb7d0d0f8d9?source=rss----905ea2b3d4d1---4