Nowadays, Threat Hunting is a very popular topic among not just security practitioners in the InfoSec community, but also organizations that are looking to take their security posture to the next level. Several great hunting resources have been shared that provide complex queries and methodologies that facilitate the detection of techniques used by real adversaries. Some have even shared maturity models and explained how important data, tools, and skills are when building your hunt team. However, only a few resources have gotten into the details of how to really start your program and develop metrics to track the effectiveness of the hunt team from day one.
A few months ago, I blogged about "How Hot is Your Hunt Team" where I examined the MITRE ATT&CK framework in the form of a heat map in order to measure the effectiveness of a hunt team, and loved the way the community embraced it. That was my first attempt to share the basics of putting a number to hunt team effectiveness while validating the detection of techniques defined by the ATT&CK framework. Even though the score definitions were very subjective, the main purpose of the post was to provide a basic approach to measure the current state of a hunt team program.
In this post, I wanted to take my current heatmap sheet/approach and go a little bit deeper on one of the main factors of a hunt program that, in my opinion, should be assessed and measured before your first engagement: "Data." I know you want to start hunting (do the cool stuff) and show/learn all the different ways to find evil; however, without the right data quality, it is very hard to focus on the mission, be productive, and hunt effectively.
What is Data Quality?
One definition used the most about data quality is from Joseph M. Juran, author of Juran's Quality Handbook, who quoted, in page 998, "Data are of high quality if they are fit for their intended uses in operations, decision making and planning." In other words, if data needed for a hunting engagement does not meet specific requirements defined by the hunt team, then the data is not considered quality data since it is affecting the intended purpose of it. I liked how Stephanie Zatyko from "Experian Data Quality" defined it by saying that if data was water, data quality ensures water is clean and does not get contaminated.
Data Quality Goals (hunting perspective)
- Reduce the time hunters spend fixing and validating data issues increasing productivity during hunting engagements.
- Improve consistency across data sources to manipulate data more efficiently allowing more complex analytics that rely on several resources for extra context.
- Enhance automation flow
Why do I have to care about Data Quality? That’s not my job!
This is a great question, and I have heard that multiple times. If you have a SIEM that collects and integrates data from different tools, then yes, most likely there is a data governance team in your organization and they might be already measuring and fixing the quality of the data you use. However, how many times have you run across these scenarios even when you have a dedicated team:
Did it sound familiar? The idea here is not to do the job of a governance team, but to guide them in the right direction and provide recommendations. You are the security subject matter expert after all. I hope the basic examples above made you think a little bit about why you also need to care about how the quality of your data is assessed/measured when getting ready for a hunting campaign.
| Scenarios | Details |
| Data fields from different data sources do not have the same name (standard naming convention) | DeviceName, hostname, host, computername
Src, dst, host, ipaddress, IP
SecurityID, username, accountname, NewLogon.username
|
| Data sources missing data, not being parsed/split properly | CommandLine values are not present in a few endpoints, and they are replaced with blank or null values
"Message" fields containing extra information needed for stacking purposes, but not available.
|
| Timestamps reflect only ingestion time and not actual creation time, and data is only available for a certain period of time. | What if, your endpoints stop sending logs to your SIEM after disconnecting from the network. Next day your SIEM gets several alerts on events from several systems that are 24 hours old, but the main timestamps show that the events happened earlier in the morning. |
| Endpoint data is only available from high value targets and for a week only. | You are ready to hunt and realize that you can only hunt in certain parts of your environment because your company only purchased/configured only parts of your network to send data back to your SIEM. |
Did it sound familiar? The idea here is not to do the job of a governance team, but to guide them in the right direction and provide recommendations. You are the security subject matter expert after all. I hope the basic examples above made you think a little bit about why you also need to care about how the quality of your data is assessed/measured when getting ready for a hunting campaign.
I might be doing that already..
Even if you have been already sending emails to your data governance team about similar issues, do you track what aspects of your data quality are affecting your hunting engagements the most? How do you categorize those issues and focus on what is most important? This is where data quality dimensions are super useful to start understanding how to measure the quality of your data.
Data Quality Dimensions
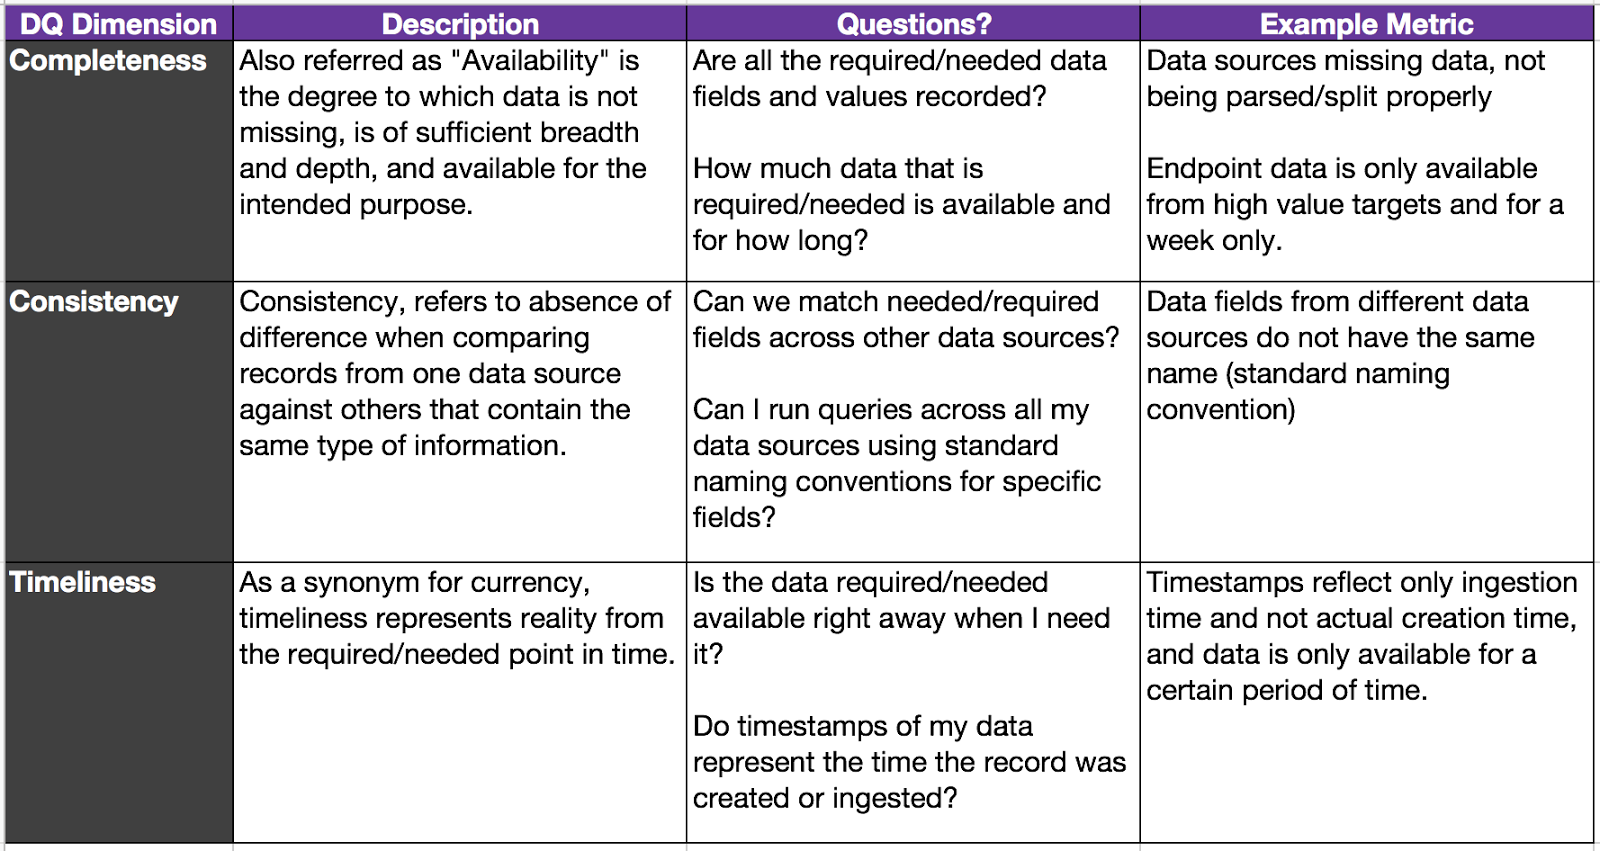
Used to simplify the representation of measurable characteristics of data quality. There are several data quality dimensions defined out there that are useful, depending on the intended use of the data. However, for data that I need for a hunt program, I like to reference a few data quality dimensions from the "DoD Core Set Of Data Quality Requirements." A few of those Data Quality (DQ) dimensions could help your team categorize gaps found in data intended to be used for hunting purposes. I will explain in a bit which dimensions are very helpful to measure the effectiveness of your hunt team from a data perspective. For now, let’s get familiar with the ones provided by the DOD (These are just general definitions of data quality dimensions. We will adapt those definitions to our specific data).
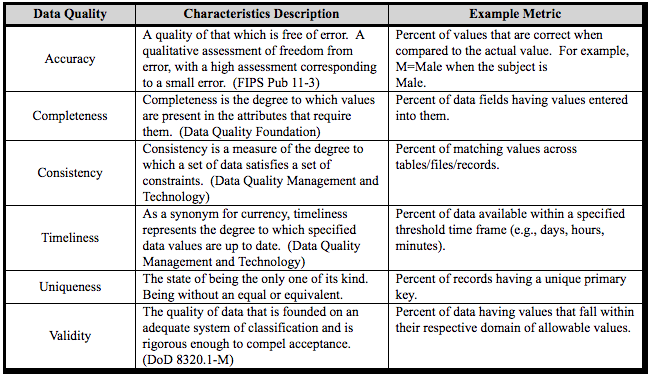 |
| Figure 1: DoD Core Set Of Data Quality. |
So, Where do I start?
Identify Data Sources needed for your Hunt program
Before you even start measuring the quality of your data, make sure you understand and document first what data sources you actually need. This will allow you to identify what to expect and plan accordingly since day one from a data perspective. In addition, this will help you to assess your current tools and make sure they are providing the data you really need. If you do not know what data sources you might need from a hunting perspective, take a look at the MITRE ATT&CK framework. I don't know if you have noticed, but almost every technique defined in the framework has a field named "Data Sources" in the reference box to the right which tells you what Data Sources are recommended for the detection of the specific technique. Shown in Figure 2 below:
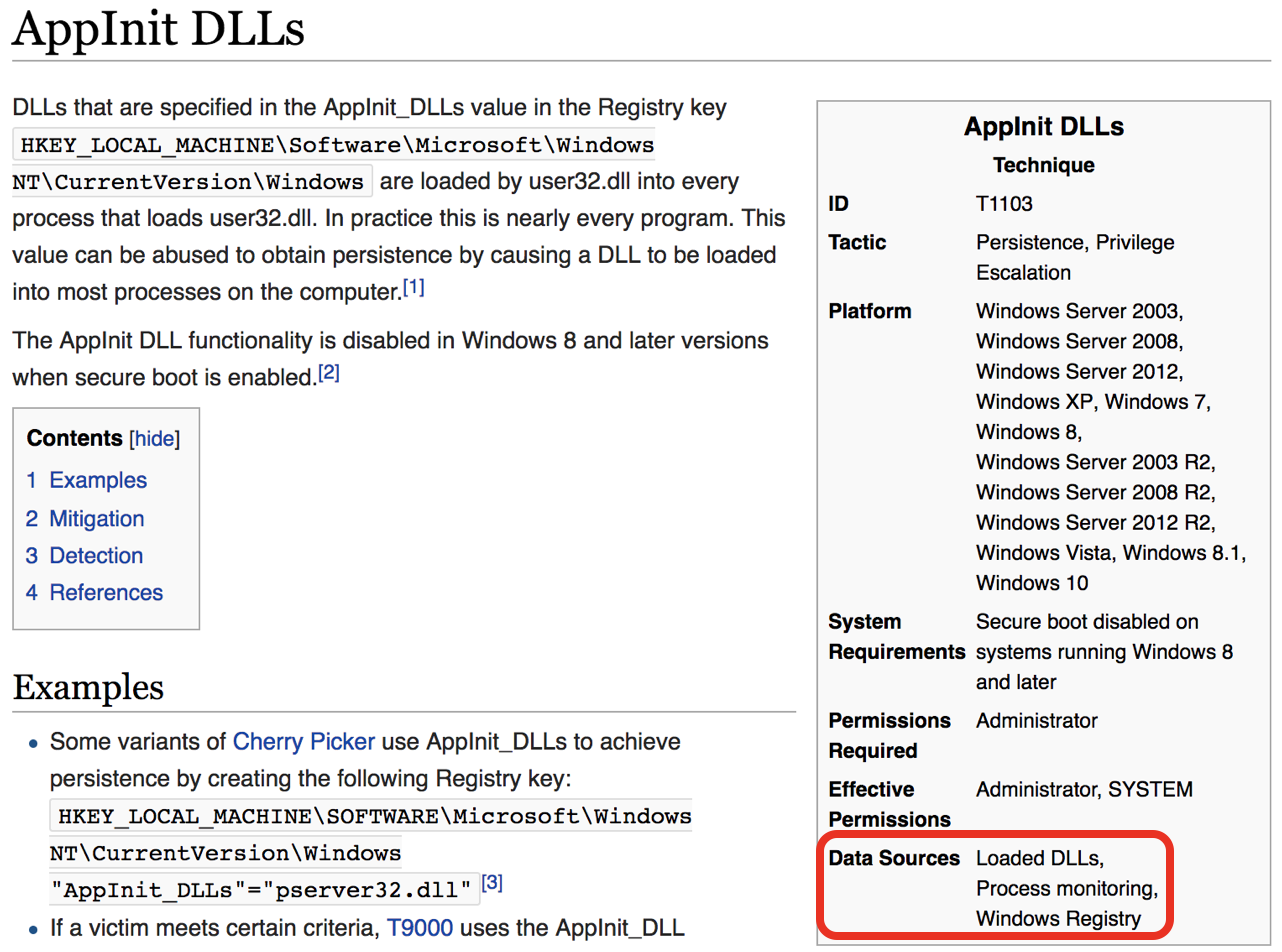 |
| Figure 2: APPInit DLLs Technique |
You can retrieve that information from every single technique without going manually through every single technique page by using Invoke-ATTACKAPI as shown in figure 3 below:
Import-Module .\invoke-ATTACKAPI.ps1
$techniques = Invoke-ATTACKAPI -Category -Technique
($techniques | select -ExpandProperty ‘Data Source’).ToLower() | select -unique
(($techniques | select -ExpandProperty ‘Data Source’).ToLower() | select -unique).count
 |
| Figure 3: Using Invoke-ATTACKAPI to pull Data Source names from MITRE ATT&CK |
This information will help identify data coverage gaps when you start mapping the data sources you have with the ones recommended by the ATT&CK framework. Remember that this is just an idea, and you might disagree with what is needed per technique according to MITRE, but at least this is a good place to start. I encourage you to define new data sources that are not defined by the ATT&CK framework and that you believe will get you closer to the detection of specific techniques (Please share any new data sources with MITRE that you believe are missing. This helps the community). If you want to know what data sources map to specific techniques, you can get that data from the HuntTeam_HeatMap spreadsheet I put together or by using Invoke-ATTACKAPI with the following commands:
Import-Module .\invoke-ATTACKAPI.ps1
$techniques = Invoke-ATTACKAPI -Category -Technique
$techniques | select Tactic, TechniqueName, ‘Data Source’ | more
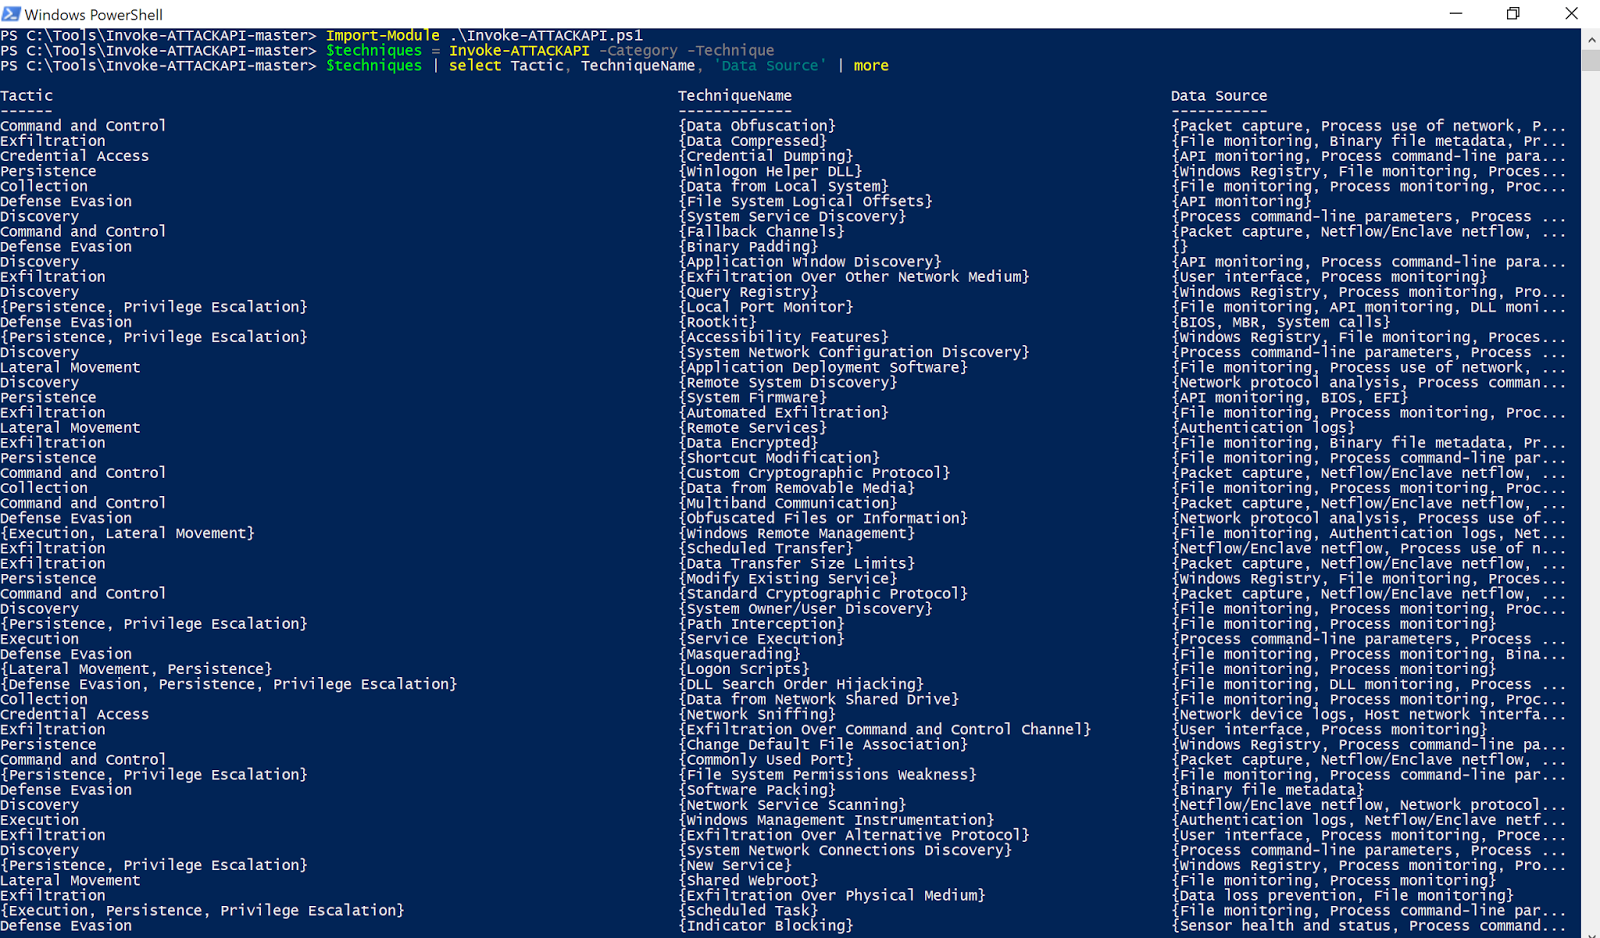 |
| Figure 4: Using Invoke-ATTACKAPI to map tactics and techniques to data sources recommended. |
Identify Data Sources that you have for your hunt program
It is time to identify the data sources that you have. One way to expedite this process is by looking at the tools that your organization has purchased or configured to give you the data that you are currently working with. For example, instead of coming up with data source names, such as the ones from MITRE, I recommend starting to document the tools that are present in your environment such as, for example, Sysmon, OSQuery, Moloch, AV, Bro, EDR solutions, etc.
Map the data sources that you have to what you need
Take each data source needed and ask this question about each of the tools you have: Is this tool providing the data source I need? With a binary system, you can mark each with a 1 or a 0 depending on your answer. Don't focus on how well or how much the tool is giving you, per data source (DS). Those aspects will be addressed while measuring the quality of your data. One example I have is shown in Figure 4 below, where I put together a table with data sources from MITRE ATT&CK on the left and tools on the top as column names. Remember this is just an example and the numbers just represent a Yes or a No for now. After adding Data Quality measurements, your numbers will change. This is just to start at least having an idea of where you might be from a data availability perspective.
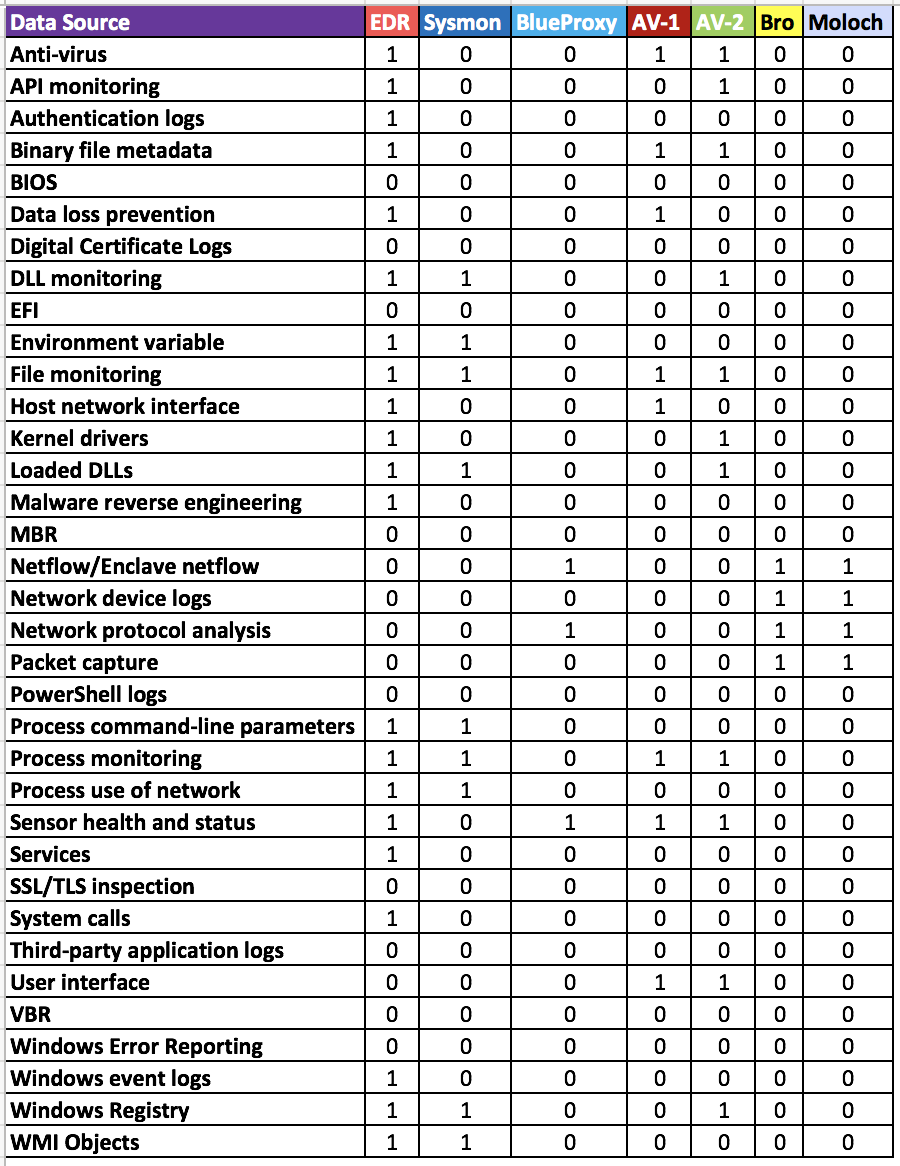 |
| Figure 5: Data that you have mapped to what you need. |
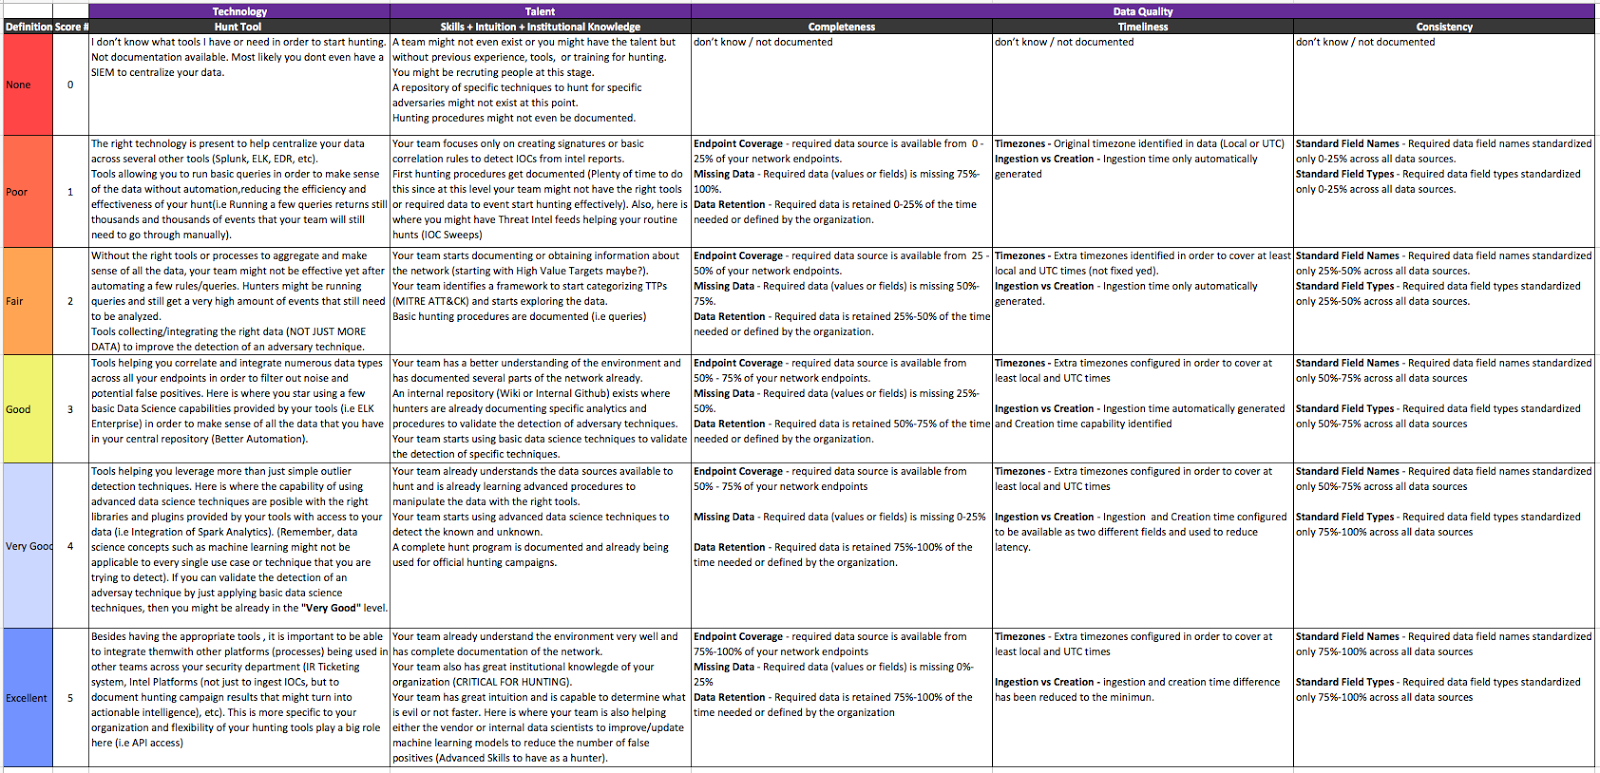
Define Data Quality Dimensions
This is where you take your data sources to the next level. If your organization already has DQ dimensions defined, work with your data governance team and make sure you follow their DQ requirements to start. Some DQ dimensions defined in your organization for other data sources might not apply to the data you use for hunting, and it is fine. As I explained earlier, one good reference to define data quality dimensions is the "DOD Core Set Of Data Quality Requirements," which helped me to define the following:
 |
| Figure 6: DQ Dimensions Definitions and Examples. |
I removed Uniqueness because event logs are not necessarily always unique and can be repeated several times even with the same timestamp depending on the type of activity. I also removed Accuracy and Validity because I feel that those dimensions might be a little hard and time consuming to validate from a hunter’s perspective. Starting with the three DQ dimensions defined above, you will start adding value to your program. I also added questions to the table that I believe should help you to identify gaps faster. In addition, if you didn't notice, I added the same scenarios I showed you earlier to their respective DQ dimension. That is a basic example of how you can start categorizing the gaps you currently present from a data quality perspective (Very useful for reports.)
Create a Scoring Table for your data quality dimensions
This part is very important and there is no a right or wrong answer. Questions or sections of your scoring table will depend on your organization. For example, your company might accept the risk of retaining data for 30 days instead of 6 months so you will have to adjust your scoring to reflect what is good or not from a retention (completeness) perspective. I created the following table as a basic approach to give you a few ideas for when you also build your own one:
 |
| Figure 7: DQ Scoring Table. |
A few things that I want to make sure are followed when using the table score above:
- In order to get a full score per level and move to the next one, you have to comply with all the requirements of the specific level where you currently are at. For example, in Completeness, if you have 100% endpoint coverage from a data source perspective and 75% of required data missing then your score in Completeness will be 1 and not a 5. Not just because your tool is deployed everywhere, it gets a high score. This is very important to remember.
- Each level requirement must be defined by your team. I am just providing examples and just basic ideas. My examples might not be detailed enough for you or your team. If you have better requirements and would like to share, let me know and I would encourage you to submit a PR in the ThreatHunter-Playbook project. I will appreciate it a lot!
- If you think that other Data Quality Dimensions apply to your data, feel free to add them to the table and define the requirements for it.
- Consistency and Timeliness are measured across all your data sources at once and not individually. This is the case when you have your logs in a centralized location and managed from there (ELK, Splunk, EDR, etc.) Therefore, when you set the scores for Consistency and Timeliness, make sure you remember that the scores could be the same across all your data sources if you are sending everything to a SIEM.
- You don't have to be 100% right on your answers. Going very deep into the specific details of the quality of your data might take longer than you think. The idea here is to start understanding your data from a high level perspective and start conversations with the team in charge of maintaining your data (internal or external parties).
- For example, if you work in an environment where your developers are constantly spawning AWS containers and getting rid of them after a day or two of testing, it will be almost impossible to say that you have 100% coverage because you might not be able to protect those systems (some developers might make those containers public and you never know)
Show Me How This Helps Now
Now that you have your data quality dimensions defined and a scoring table ready, you can start showing some value. First, do you remember that we created a table to show how many required data sources were being provided by your tools purchased or configured in your organization (Figure 5)? Based on that table, you can draw some conclusions from a DATA SOURCE COVERAGE PERSPECTIVE ONLY on how much your tools will help you during hunting engagements.
Tool and Data Source Coverage (Per Technique)
Since you have a tool mapped to specific data sources, then you can use again the Data Sources field from each technique in the ATT&CK Framework and calculate the percentage of the data sources provided by your tool from the number of data sources recommended.
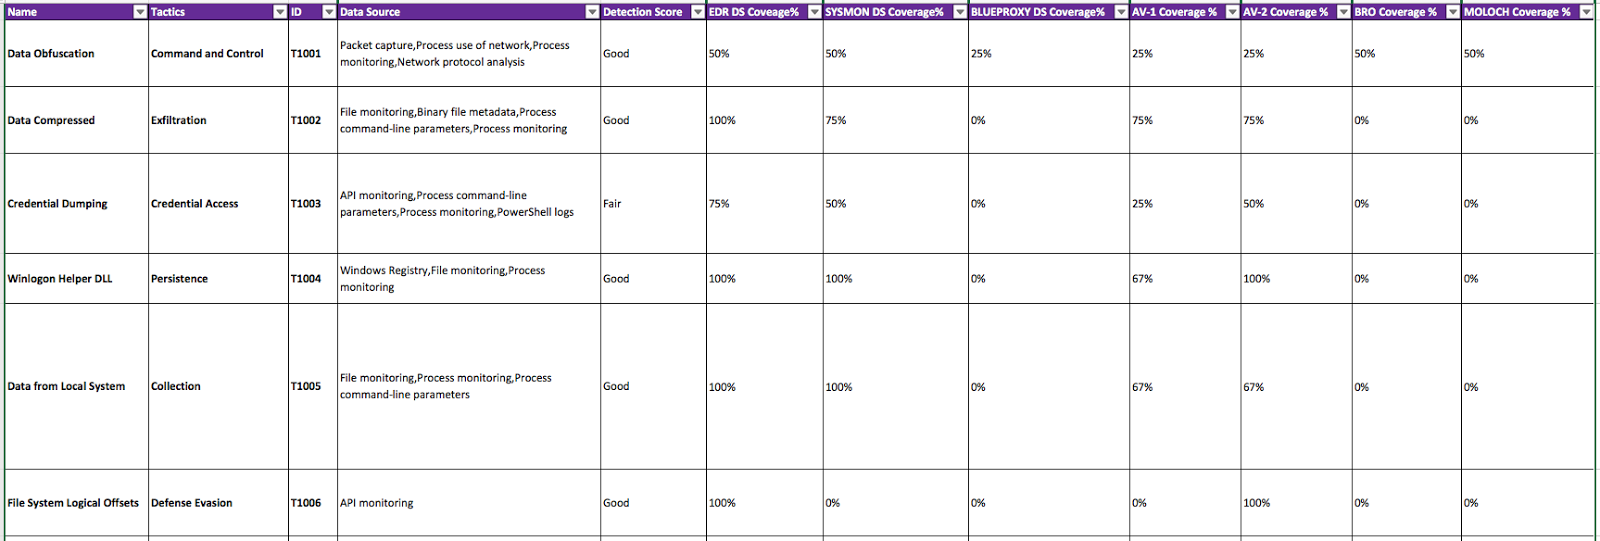 |
| Figure 8 : Percentage of DS provided by your tools per technique. |
A few things that I want to point out from figure 8 above:
- You can see that your EDR solution looks to be doing better than your other solutions since it provides more data sources than what you other tools are capable of or configured to do so. However, you should NOT take that score as your final score when doing an inventory of your tools and asking yourself, “What tools are helping my team to hunt specific techniques?” I have seen tools being mapped to the ATT&CK Matrix in recent presentations and I don't see much value on just saying that they help because they give you the required data (my opinion).
- Another misconception that might be created from Figure 8 above is that your EDR solution seems to have similar scores with open source tools such as SYSMON. Here is where you might have people saying: Why do I need to buy EDR when I have SYSMON? I can see the 100% in both when it comes to detect "Data From Local System" so why buy? (don't get me wrong both have their pros and cons. I just don't like to make decisions based on the data that the tool says it provides).
- Sysmon works with Exclude and Include rules. The moment you exclude something that is being used to perform the specific technique, you get zero value from the tool (for targeted detection).
Once you take the percentages per technique and tool, you can then create bins to organize your results (0-20, 20-40, 40-60, 60-80, 80-100). You will be able to see the numbers of techniques mapped to the percentage of data sources provided by each tool as shown in Figure 9 below.
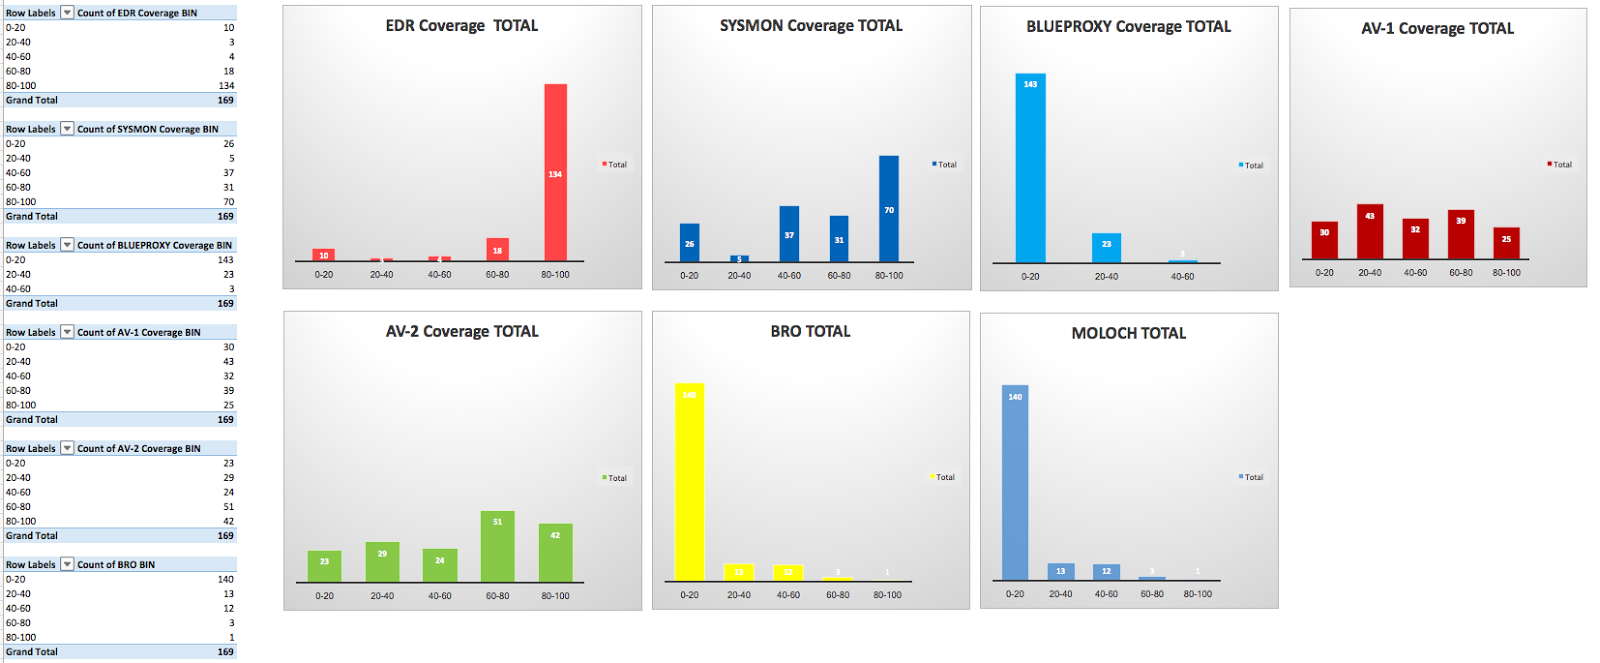 |
| Figure 9: Number of techniques where tools seem to have great coverage. |
A few statistics:
- Your EDR seems to be the most effective tool to use when hunting for 134 techniques out of the 169 defined in the ATT&CK Framework. Without the extra context that I will show you later with DQ dimensions, that number does not mean much to me.
- I can see that my network tools are not doing well and it is because there are more techniques calling for host rather than network logs. However, you know that network and host complement each other. I just would not use my Moloch tool when I am looking for Credential Dumping activity and my traffic is encrypted.
- I can see also that my SYSMON configured in a certain way, it is not going to help me as much by itself. I will need to correlate the data with other tools to be more effective.
Tool and Data Source Coverage (Per Tactic)
Then, what does it look like from a Tactics Perspective?
 |
| Figure 10: Number of tactics where tools seem to have great coverage. |
The graph above is basically now showing you the coverage but per tactic after grouping each technique with its specific tactic. A very useful graph for when you want to see your full coverage from a DATA SOURCE AVAILABILITY ONLY perspective per tactic across all the techniques that ATT&CK defines.
Considering availability as the only requirement for a data source, this is what your HuntTeam_HeatMap might look like:
Considering availability as the only requirement for a data source, this is what your HuntTeam_HeatMap might look like:
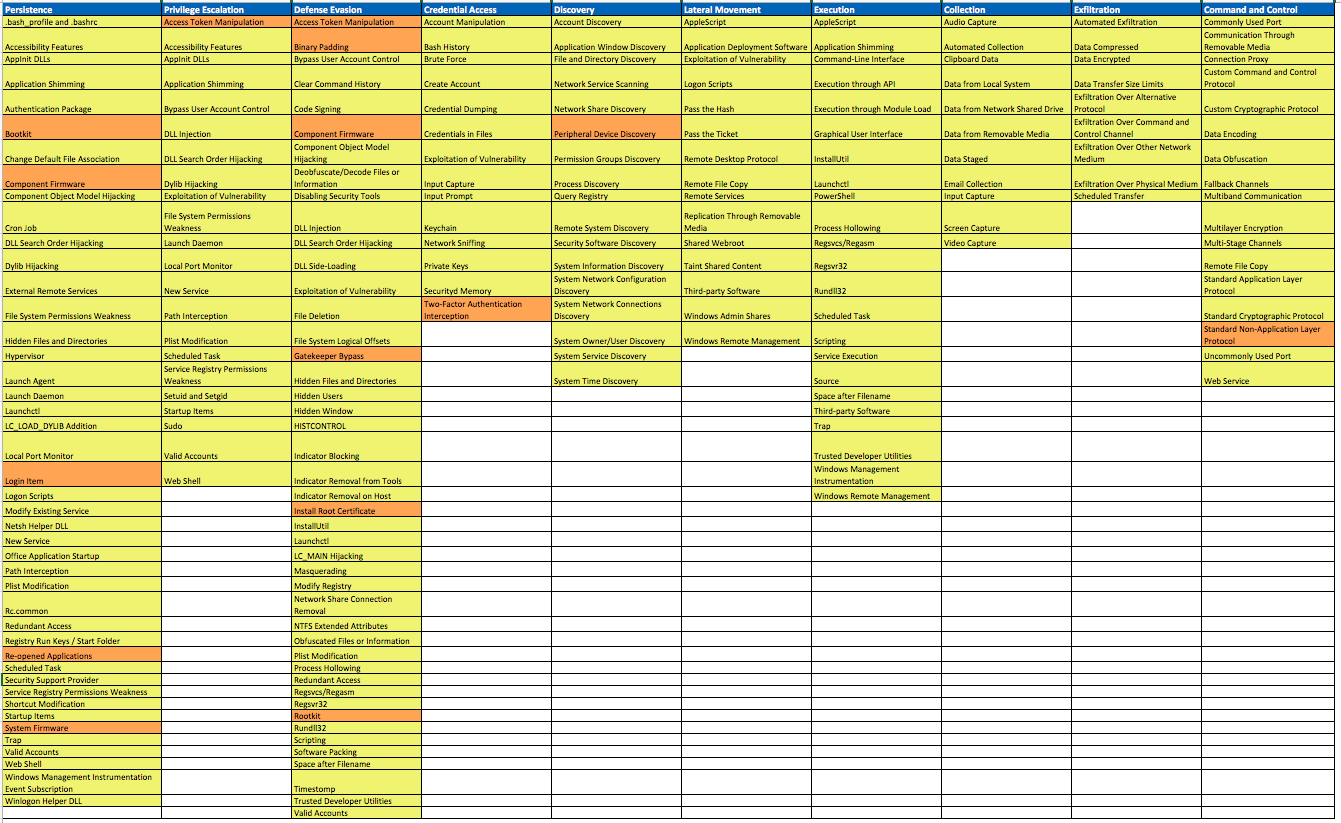 |
| Figure 11: Current view considering availability as the only requirement for a data source. |
Expand your Coverage Results with Data Quality Dimensions
I created a table where I got rid of the binary system scoring and started using the table scoring from Figure 7. I went over each data source per tool and started measuring the quality of my data.
I like the view from Figure 12 above because it tells me more about what I get from a specific tool that I purchased or configured in my environment. For example:
 |
| Figure 12: Adding scores to all the DQ dimensions per tool and data source |
I like the view from Figure 12 above because it tells me more about what I get from a specific tool that I purchased or configured in my environment. For example:
- A vendor tells me that the tool I am purchasing provides registry monitoring, and that it automates the collection of AutoRuns. However, during the POC I find out that it is missing several registry locations identified by my team to start hunting for persistence. By measuring the completeness of the data, I can tell that the quality of the data I am getting from a commercial tool is not going to help me much to validate the detection of several persistence mechanisms.
- Sysmon is configured to collect loaded modules events (EID 7), but due to the high number of events generated, its config is cut back to only monitor 5 specific modules/images. By limiting the number of information being collected, it also limits the detection capability for techniques calling for DLL monitoring. Not just because you set your Sysmon config to include a few LoadedImages and collect that data, you are satisfying the "DLL Monitoring" required data source.
- Sysmon gets configured to pull every single hash type capable to calculate, but it is all pushed into one field named “Hashes” (by default). You are also collecting MD5 hashes from your AV data source. You want to run a query to stack MD5 hashes from both. How can you stack the values of a specific hash type across those two data sources when every hash type in Sysmon gets populated under one field?.
- Example:
- Hashes:MD5=59273BB2B6DDAFCF9C7F95AA71AC9C56,SHA1=38998A827EB2E7B4879BC4E8B09DE632793E4976,IMPHASH=88FFDD8F354A1E65DF5D6F793E536605,SHA256=086E202398A409CB872C4D17424F81477A4CB37BCD2BBE59A26639D63801621C
- You can use regex, but it can add extra load to your server and time to your engagement while trying to figure out a workaround. That is not a good example of good Consistency.
Also, I calculated the average of each tool and the Max values of Data Quality overall per data source. One final thing to notice, too, is that for my EDR tool, I applied a different score under Consistency and Timeliness from the rest of the data sources. This is because usually when an organization buys an EDR solution, it usually comes with its own infrastructure and standards for our specific DQ dimensions.
How do I add that to my overall score?
I updated the HuntTeam_HeatMap's Score Defs sheet with the new DQ dimensions scoring definitions in order to improve the current ones, and get a little bit closer to a more realistic score.
 |
| Figure 13: Updated Score Definition in the HuntTeam_HeatMap document |
Next, after also considering talent and technology for our overall score, you can automatically start generating an overall score based on an average score from (Data Quality, Talent & Technology). The HuntTeam_HeatMap document in the ThreatHunter-Playbook performs those calculations automatically for you and replaces the final number with the score label.
 |
| Figure 14: Updating overall score with new scoring definitions. |
What does our heat map look like now?
Considering the numbers that I see as my final data quality ones, I can tell that my numbers are looking Fair (not as "Good" as how the availability score was making it look like, but Good/Fair, mostly Fair overall). This is also because I graded talent and technology a 3 (Good scores).
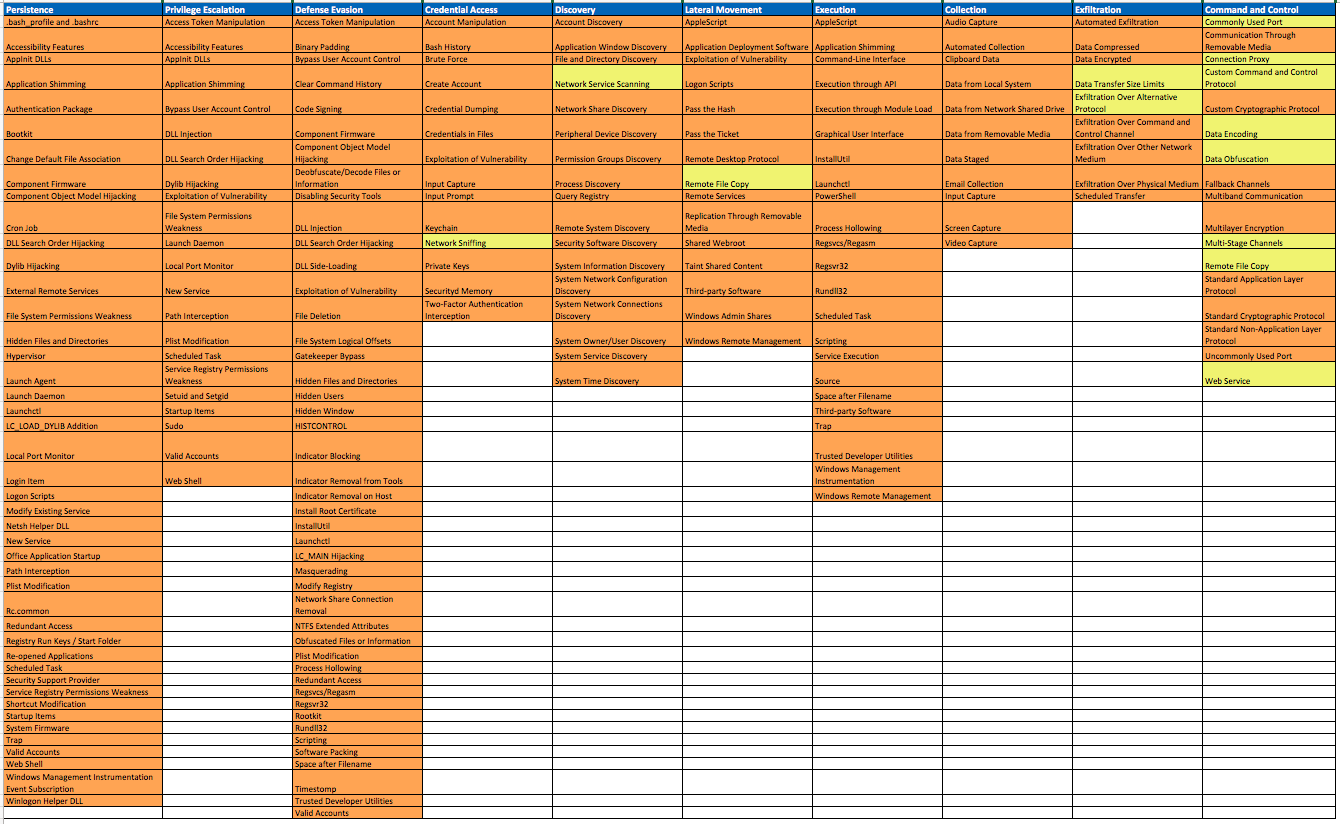 |
| Figure 15: Looking at the current scores across my ATT&CK Matrix. |
Now what if I reduce the score of my data quality and technology to Poor and leave the talent at Good?
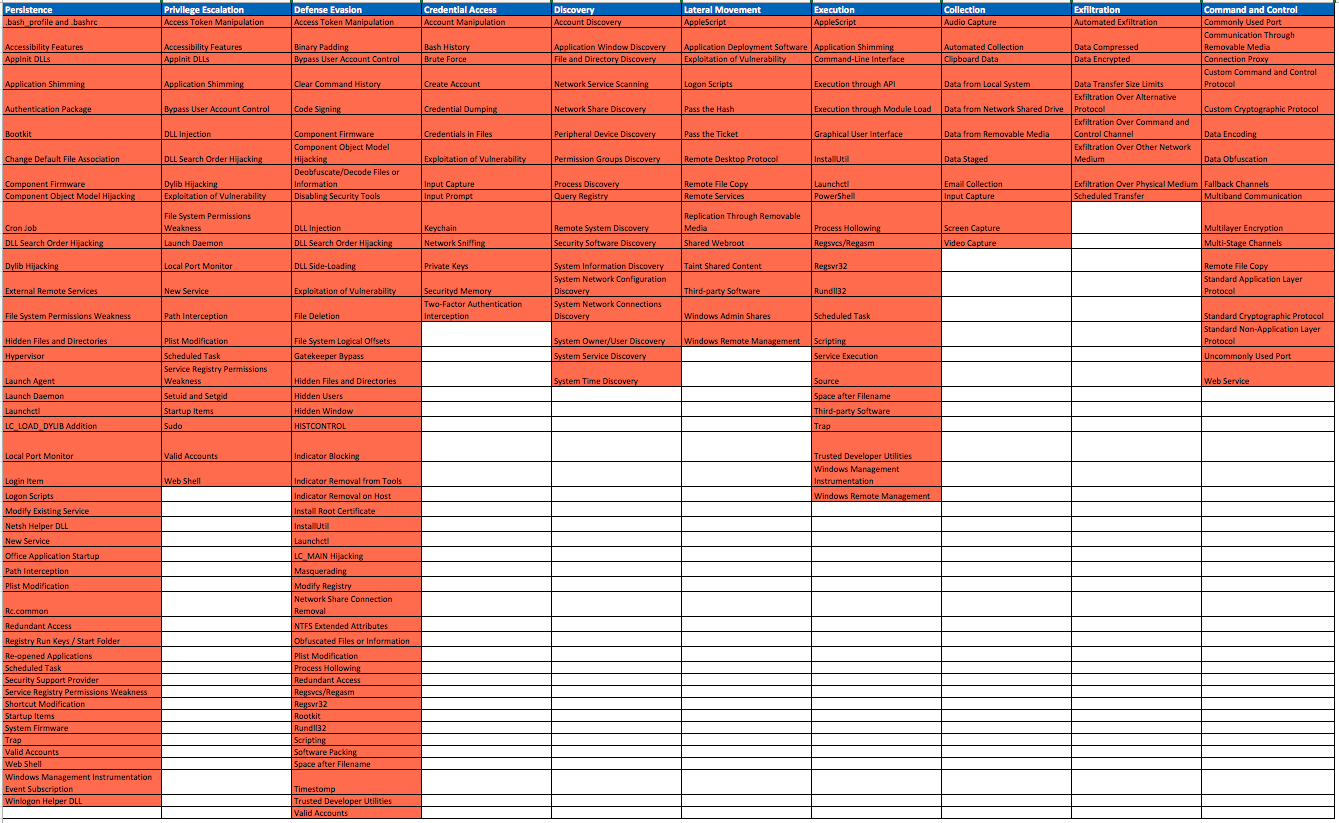 |
| Figure 16: Reducing Data quality and technology |
You can see that the effectiveness of your hunt team to validate the detection of adversary techniques went from mostly Fair and a little bit of Good to Poor overall. You might still have good good talent whom can put together a few scripts and start scanning your network, but it is not enough. You need good data quality and the right technology.
I hope this was very helpful for those trying to create metrics around the quality of their data, add it to their overall score, and willing to do the respective pre-hunt activities to hunt more effectively and efficiently. You can find the updated. I would love to hear your thoughts on these new metrics, and if it is helpful to start creating your own.
Feedback is greatly appreciated!
ThreatHunter-Playbook:
https://github.com/Cyb3rWard0g/ThreatHunter-Playbook
HuntTeam_HeatMap CSV: https://github.com/Cyb3rWard0g/ThreatHunter-Playbook/blob/master/metrics/HuntTeam_HeatMap.xlsx
Article Link: http://cyberwardog.blogspot.com/2017/12/ready-to-hunt-first-show-me-your-data.html