If you are not familiar with Fluent Bit, it is an open-source application written in C to help ship data from many sources to many destinations, such as VMs, Containers, and IoT devices. Fluent Bit is exceptionally lightweight, performant, and resilient — which makes it ideal for Kubernetes environments.
To send data to Splunk, we will need to define an output within Fluent Bit configuration. We will mask the host and Splunk_token parameters and use ‘tls’ Verify to allow us to skip adding the certificate for now.
We also have configured dynamic index creation per namespace in Splunk for applications onboarded to the Kubernetes clusters.
Challenges
For the stable operation of Kubernetes, we need to capture events happening in running applications by gathering log information from all applications/pods/containers/jobs, etc. Since applications running on Kubernetes based on Docker containers, there are considerations for logging :
- Log information is stored locally in the host OS without associated Kubernetes metadata, such as namespace, pod name, label, and annotations name.
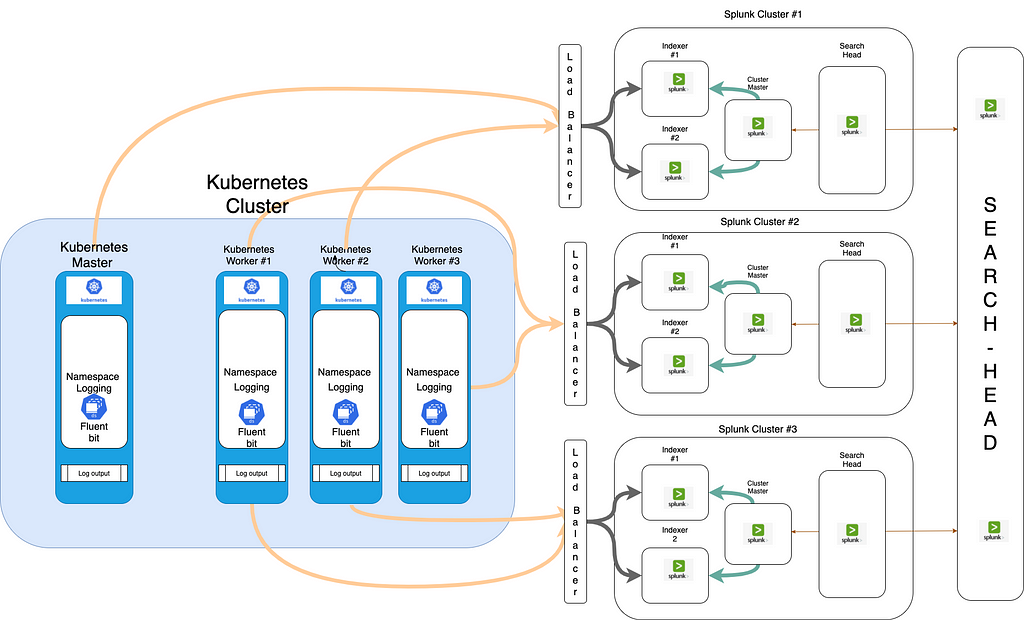
- Log information gets deleted when containers are terminated. Kubernetes delivers native functionality to capture the log messages by performing “kubectl logs” commands, but it does not work in highly scaled and distributed environments. That is where Fluent Bit comes in; Fluent Bit helps you centralize the log information of running applications with Kubernetes metadata and route the information to desired destinations such as Splunk. In this post, We will share how Fluent Bit works, for example, Kubernetes and Splunk, Dynamic index creation, Index mapping, Multi cluster Support for Splunk configuration.
- We can learn more about the logging concept of Kubernetes in Logging Architecture.
- Dynamic index mapping for the application on a multi-tenant Splunk cluster based on labels or annotations.
- Dynamic index creation at the time of namespace creation on Splunk cluster.
- Dynamic flow for dedicated Splunk clusters for application teams.
How Fluent Bit works
Fluent Bit provides “Fluent Bit DaemonSet, “ which enables you to collect log information from containerized applications easily. With DaemonSet, you can ensure that all (or some) nodes run a copy of a pod. Fluent Bit provides Kubernetes filter plugins that enrich pod log information by adding records with Kubernetes metadata. With that, we can identify where log information comes from and filter information easily with tagged records. We can learn more about Fluent Bit DaemonSet in Fluent Bit Doc. We can find Fluent Bit DaemonSet container images and sample configuration files for deployment in Fluent Bit DaemonSet for Kubernetes.
Dynamic index creation on Splunk
Since we have multi-tenant clusters, we require applications to maintain application logs to their dedicated Splunk index and clusters.
So we have added dynamic index creation and mapping support to the fluent bit configuration using JSON Store and Lua.
At the time of namespace creation (happening through the APIs), we have injected one more API to push index data in dedicated JSON stores for all the Kubernetes clusters.
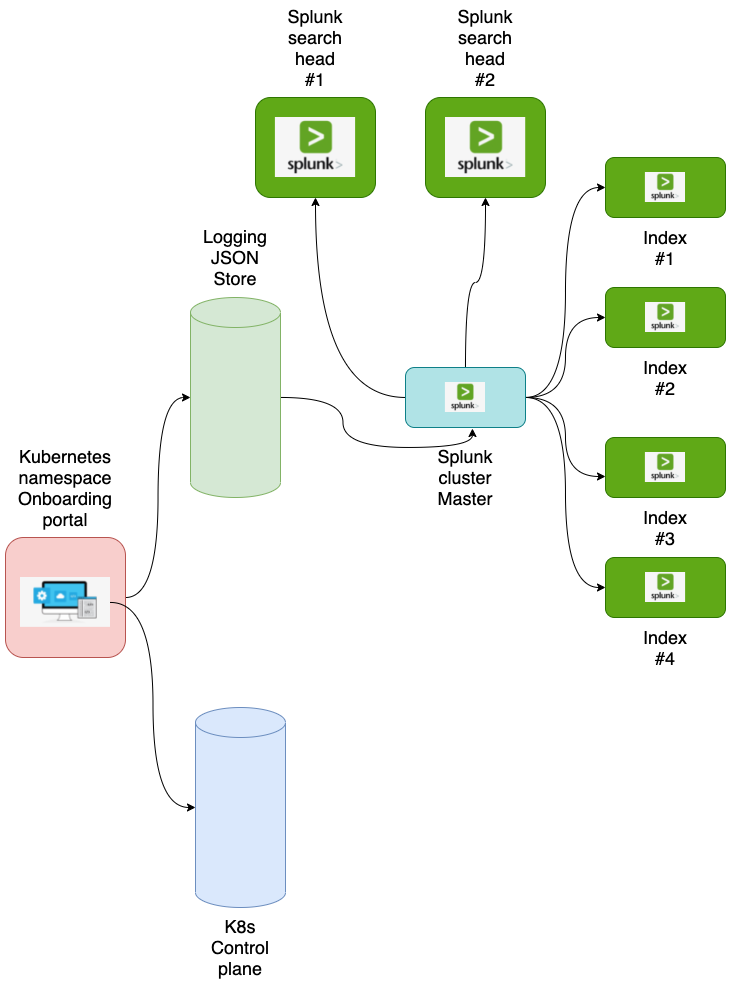
the default configuration for the Splunk index, later application can update attributes either through ansible playbooks or API to update in JSON Store.
{
  "name": "splunk-test",
  "delete": 1,
  "cluster-id": "splunk-1",
  "misc_props": [
    {
      "value": 1,
      "attribute": "maxWarmDBCount"
    },
    {
      "value": 1000,
      "attribute": "maxTotalDataSizeMB"
    },
    {
      "value": 604800,
      "attribute": "maxHotSpanSecs"
    },
    {
      "value": 1209600,
      "attribute": "frozenTimePeriodInSecs"
    }
  ],
  "maxDataSize": "auto",
  "maxHotBuckets": 1
}
{% for index in splunk_index | default(default_indexes) %}
{% if index.delete is not defined and index.deleteProd is not defined %}
# Adding index {{index.name}}
[{{index.name}}]
{% if index.internal is not defined or index.internal!=true %}
repFactor = auto
homePath = {{volume_dirs.1}}/{{ index.name }}/db
coldPath = {{volume_dirs.2}}/{{ index.name }}/colddb
thawedPath = $SPLUNK_DB/{{ index.name }}/thaweddb
maxDataSize = {{ index.maxDataSize | default(default_maxDataSize) }}
maxHotBuckets = {{ index.maxHotBuckets | default(default_maxHotBuckets) }}
{% endif %}
{% if index.datatype is defined %}
datatype = {{index.datatype}}
{% endif %}
{% if index.misc_props is defined %}
{% for prop in index.misc_props %}
{{ prop.attribute }} = {{ prop.value }}
{% endfor %}
{% endif %}
{% endif %}
{% endfor %}
After index.conf created on to the Splunk cluster-master we have ansible role configure to apply cluster bundle.
- name: apply cluster-bundle
  become: true
  become_user: "{{splunk_user_name}}"
  command: "{{splunk_install_dir}}/splunk/bin/splunk apply cluster-bundle --answer-yes -auth {{web_username}}:{{web_password}}"
Logging with Splunk
Let us see how Fluent Bit works in Kubernetes in an example use case with Splunk. In this example, We deployed application pods and services and reviewed how log messages are treated by Fluent Bit, and visualized using Splunk. With this example, we can learn Fluent Bit behavior in Kubernetes logging and how to get started. Overview of example use case is described in the following image.
In this post, We use internal Splunk.
As we can see below, Fluent Bit is configured as daemonset in the logging namespace.
a0d00qf@m-c02dj3hfmd6n ~ % kubectl get ds -n logging
NAME         DESIRED   CURRENT   READY   UP-TO-DATE   AVAILABLE   NODE SELECTOR   AGE
fluent-bit   12        12        12      12           12          <none>          27h
a0d00qf@m-c02dj3hfmd6n ~ %
a0d00qf@m-c02dj3hfmd6n ~ % kubectl get nodes
NAME                                 STATUS   ROLES        AGE    VERSION
cp2-scus-dev-amls01-vmss000000       Ready    master       348d   v1.18.18
cp2-scus-dev-amls01-vmss000001       Ready    master       348d   v1.18.18
cp2-scus-dev-amls01-vmss000002       Ready    master       348d   v1.18.18
etcd2-scus-dev-amls01-vmss000000     Ready    etcd         348d   v1.18.18
etcd2-scus-dev-amls01-vmss000001     Ready    etcd         348d   v1.18.18
etcd2-scus-dev-amls01-vmss000002     Ready    etcd         348d   v1.18.18
istio2-scus-dev-amls01-vmss00001d    Ready    istio,node   64d    v1.18.18
istio2-scus-dev-amls01-vmss00001f    Ready    istio,node   64d    v1.18.18
istio2-scus-dev-amls01-vmss00001g    Ready    istio,node   64d    v1.18.18
worker2-scus-dev-amls01-vmss000017   Ready    node         64d    v1.18.18
worker2-scus-dev-amls01-vmss000018   Ready    node         64d    v1.18.18
worker2-scus-dev-amls01-vmss00001a   Ready    node         64d    v1.18.18
a0d00qf@m-c02dj3hfmd6n ~ %
Below configuration for the Splunk output in Fluent Bit configMap.
[OUTPUT]
        Name       splunk
        Match       loggingApp1
        host       splunk-1.xyz.net
        port       80
        Retry_Limit 3
        Splunk_Send_Raw On
        splunk_token e42f79e4-xxxx-xxxx-xxxx-xxxx-xxx
        tls false
        tls.verify false
        Alias App1
        net.keepalive true
        net.keepalive_idle_timeout 5
        net.keepalive_max_recycle 12096
        net.connect_timeout 30
[OUTPUT]
        Name       splunk
        Match       loggingApp2
        host       splunk-2.xyz.net
        port       80
        Retry_Limit 3
        Splunk_Send_Raw On
        splunk_token e42f79e4-yyyy-xxxx-yyyy-xxxx-xxx
        tls false
        tls.verify false
        Alias App2
        net.keepalive true
        net.keepalive_idle_timeout 5
        net.keepalive_max_recycle 12096
        net.connect_timeout 30
As mentioned earlier in this post, we have a dynamic index mapping for application depending on the events' labels post-Kubernetes filter (Post metadata added to the events). We have configured the Lua script to read and map the labels. Lua script will insert key (index) and value as the labeled value to the index field in each event.
If an application has not set any labels for the Splunk index, Lua script will configure it to index name to namespace name.
[FILTER]
    Name                kubernetes
    Match              loggingApp.*
    Kube_URL            https://kubernetes.default.svc:443
    Kube_CA_File        /var/run/secrets/kubernetes.io/serviceaccount/ca.crt
    Kube_Token_File     /var/run/secrets/kubernetes.io/serviceaccount/token
    Annotations Off
    Merge_Log      On
    Merge_log_key       log
    K8S-Logging.Exclude On
    Keep_Log false
[FILTER]
    Name rewrite_tag
    Match loggingApp.*
    Emitter_Mem_Buf_Limit 1G
    Emitter_Name kube
    Alias emiiter_kube
    Rule $event['kubernetes']['labels']['splunk-cluster'] ^([(a-z)(A-Z)(0-9)]+)$ $event['kubernetes']['labels']['splunk-cluster'] false
[FILTER]
    Name      lua
    Match      kube.*
    script rename_index.lua #name to a script in ConfigMap
    Protected_mode true
    call splunk_index
Lua function for index mapping:
function splunk_index(tag, timestamp, record)
  local updated_log = {}local k8s_metadata
  local extracted_value = ""
  log = record
  if type(log) == 'table'
  then
    k8s_metadata = log["kubernetes"]
    if type(k8s_metadata) == 'table'
    then
      extrLabels = k8s_metadata["labels"]
      if (extrLabels ~= nil)
      then
        extracted_label = k8s_metadata["labels"]["splunk-index"]
        if (extracted_label ~= nil)
        then
          new_index = extracted_label
          updated_log = log
          updated_log["index"] = new_index
        else
          extracted_value = k8s_metadata["namespace_name"]
          extracted_value = .. extracted_value
          updated_log = log
          updated_log["index"] = extracted_value
        end
      else
        extracted_value = k8s_metadata["namespace_name"]
        extracted_value = .. extracted_value
        updated_log = log
        updated_log["index"] = extracted_value
      end
    else
      return -1, timestamp, updated_log
    end
  else
    return -1, timestamp, updated_log
  end
return 2, timestamp, updated_log
end
In the configuration, as we can see, we have used a rewrite-tag filter, this is to rewrite the tag based on the configuration for the Splunk cluster provided in the labels, through which we will forward logs to the designated Splunk cluster by supporting multi Splunk cluster logging with dynamic mapping.
[FILTER]
    Name rewrite_tag
    Match loggingApp.*
    Emitter_Mem_Buf_Limit 1G
    Emitter_Name kube
    Alias emiiter_kube
    Rule $event['kubernetes']['labels']['splunk-cluster'] ^([(a-z)(A-Z)(0-9)]+)$ $event['kubernetes']['labels']['splunk-cluster'] false
Checking events in Splunk
Sample event in Splunk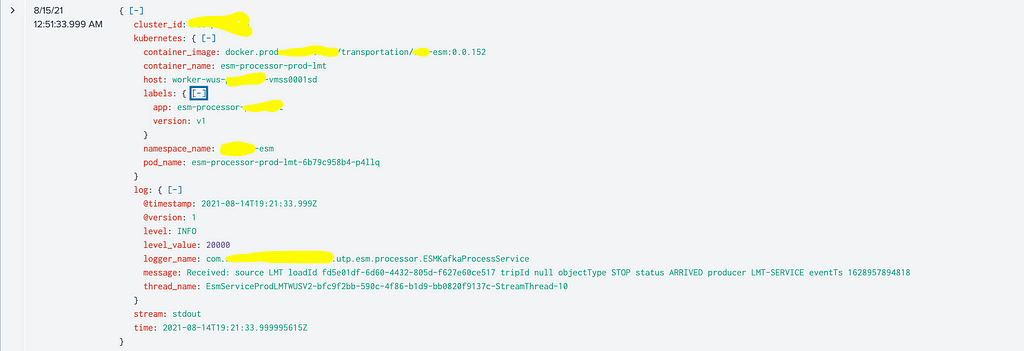
Limitations
- Splunk supports the limited number of indexes depending upon the cluster size and health.
- Dynamic index creation after a long run may create instability for the Splunk cluster. To mitigate this, we can set the number of indexes fixed per cluster, and if needed, we will add a new cluster master with an indexer to support new index creations under the same search head.
- If the number of Splunk clusters and indexes increases, Fluent Bit may have a resource issue and performance impact due to the number of filters.
- Event format and size will also affect Fluent Bit performance.
Conclusion
This post shows how Fluent Bit is configured to send logs to multiple Splunk clusters and Splunk index with dynamic mapping of Splunk indexes and clusters.
Pumped-up logging with Fluent Bit and Splunk was originally published in Walmart Global Tech Blog on Medium, where people are continuing the conversation by highlighting and responding to this story.
Article Link: Pumped-up logging with Fluent Bit and Splunk | by Akshay Dubey | Walmart Global Tech Blog | Sep, 2021 | Medium