Nowadays, it is rather common to see companies adopt several monitoring solutions based on Prometheus, but this is not exempt from pain. A huge number of systems, applications, and third-party software are not instrumented to expose Prometheus metrics natively. Here is where Prometheus exporters come into play.
Deploying, configuring, and maintaining dozens, maybe hundreds, of Prometheus exporters can be painful. Have you ever found many different exporters for the same software and didn’t know which one best fits your needs? Have any of your exporters ever stopped reporting metrics for some reason? Are you tired of troubleshooting Prometheus exporters issues? In this article, you’ll go through the challenges of running and maintaining Prometheus exporters.
Sysdig Monitor provides tons of integrations out of the box, offering a consolidated observability experience thanks to its automatic integrations and Prometheus exporters wizards. Sysdig offers a smooth experience when integrating third-party software metrics. There’s no need to worry about maintaining Prometheus exporters anymore, Sysdig takes care of that on your behalf.
Do you want to learn more? Keep reading!
What are Prometheus exporters?
A Prometheus exporter is a kind of agent or software that runs in a host or in a container. It is responsible for communicating with a specific software or application (target), and its mission is to fetch information and export this data via a new metrics endpoint.
In terms of architecture and design of Prometheus exporters, the programming language can vary depending on the exporter instrumentation and implementation itself. Every Prometheus exporter can have its own mechanisms to fetch data from its target, via API, endpoint or service already exposed, or any other way. The port where the /metrics endpoint is exposed and the protocol used for that endpoint (http or https) will vary as well.
There are tons of Prometheus integrations available and maintained by the community. You’ll find Prometheus exporters for lots of different use cases, like:
- Kubernetes components
- Databases
- Hardware related stats
- HTTP services
- Storage
- Public APIs services
- …
One of the most known and widely adopted Prometheus exporters in Kubernetes are the kube-state-metrics or the Prometheus node exporter.
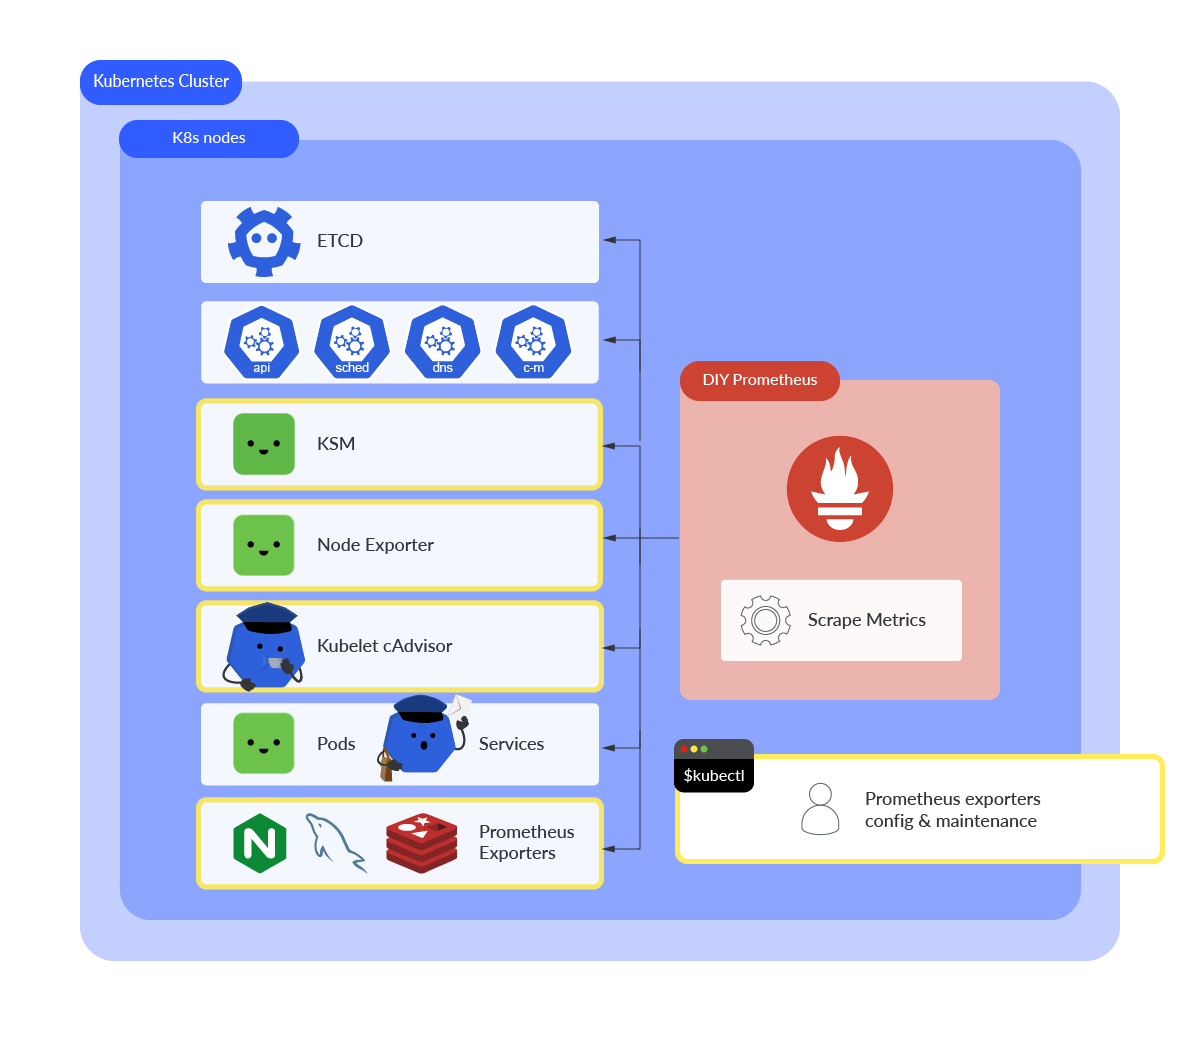
For example, as you can see in the following diagram, node exporter Pods are running on every Kubernetes node. This exporter is responsible for fetching all the required data from the nodes, like CPU statistics, filesystem information, or the load average among many others. The node exporter turns this data into metrics and exposes this information in a public /metrics endpoint. Prometheus is able to scrape these and other metrics, and store them in its own TSDB (Time Series Database).
At this point, you may be wondering: Why should I use Prometheus exporters to get metrics from third-party software? Is there any way to bypass this kind of add-on and get metrics straight away? The answer is simple: it depends on the software you want to get metrics from. If it is properly instrumented, and exposes its own metrics endpoint, then you can get metrics. If not, you need to deploy a Prometheus exporter. For example, for etcd monitoring you don’t need any exporter at all.
The Sysdig Promcat team is actively working and contributing to the Prometheus exporters community. One of its missions is to provide open source solutions in the form of Prometheus exporters for multiple applications. These exporters are curated and maintained by the Sysdig engineering team. One of the goals is to facilitate Prometheus exporters adoption and, at the same time, a great user enterprise experience.
Challenges and pain points
It’s time to cover some of the challenges and pain points you might encounter when dealing with Prometheus exporters.
- For a single application, you may find several exporters. What is the best exporter? What should you choose? These questions may have an answer after spending time to check which one fits better to your needs.
- Quite often, you’ll find many different images for an exporter. You’ll usually rely on the “latest” tag, but sometimes this is not correctly pinned. It may happen that the image has moved away from the original repository. This can make you waste a lot of effort and time.
- Many base images for exporters may contain a lot of vulnerabilities, exposing you to a high risk.
- The open source community feeds Prometheus with tons of exporters. There are a lot of owners and maintainers, so every exporter has its own configuration, like secrets, variables, configmaps, etc. There are not commonly defined architectures, designs, etc., so every exporter brings its own adventure.
- Prometheus exporters may be outdated or not maintained. That could prevent you from pulling metrics in some circumstances. For example, you may be running a newer version of a specific software and the exporter was designed for previous versions. In such a scenario, the exporter can’t communicate with the API because methods have changed.
- You can find yourself running and maintaining a huge number of exporters. If the application is not instrumented and exposing its own
/metricsendpoint, then you need to deploy a dedicated exporter. - Prometheus scrape configurations are needed every time you want to add a new custom
/metricsendpoint. It’s not a big deal, but you may end up configuring and maintaining a large number of jobs.
How Sysdig Monitor integrations works
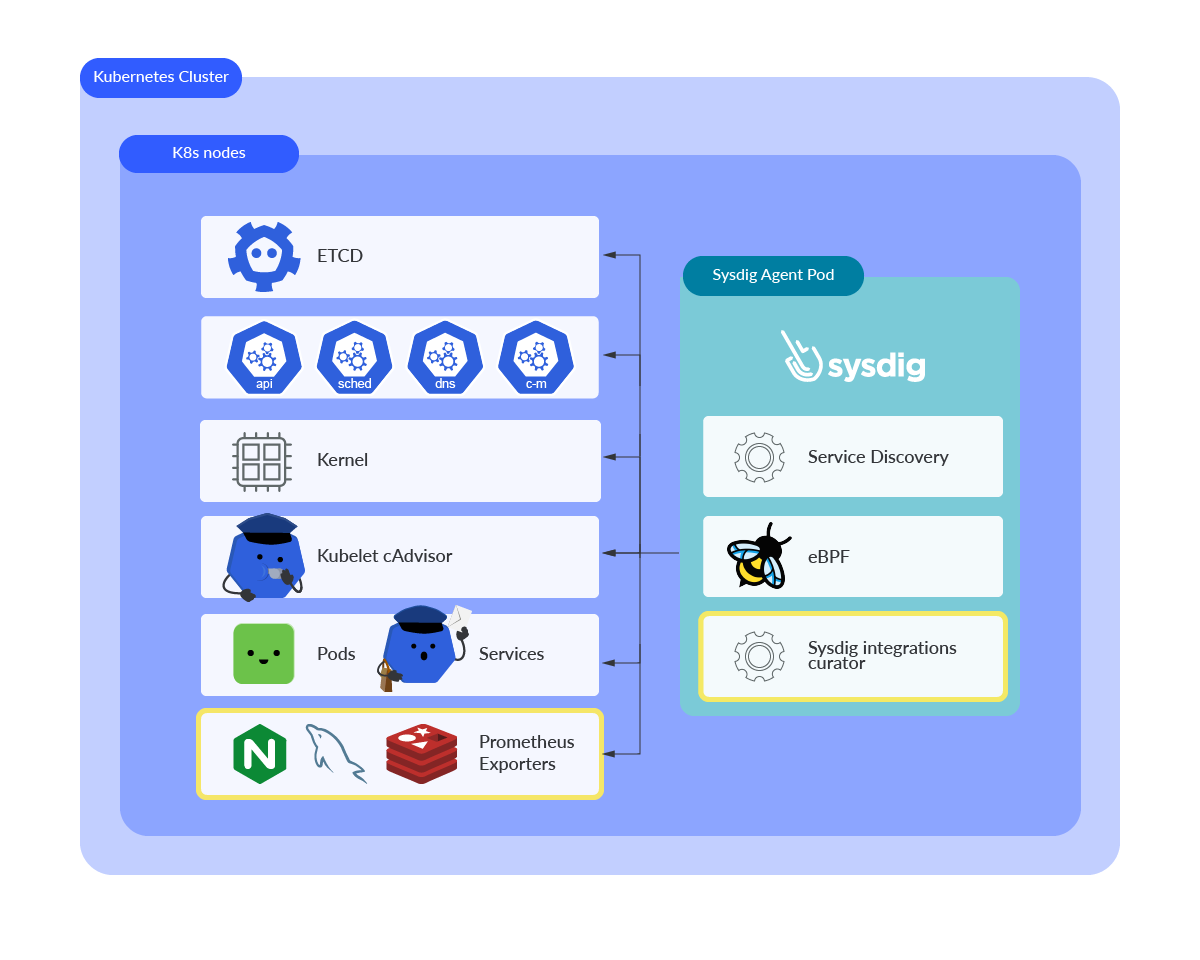
Sysdig has its own agent to fetch data and pull metrics from your Kubernetes and cloud environments. If you want to learn more about how the Sysdig Agent works behind the scenes, check out this article. You’ll get a better understanding on how metrics are ingested, as well as the benefits of using the Sysdig Agent.
In short, Sysdig Agent has embedded a lightweight Prometheus instance. That way, it’s able to scrape metrics from Kubernetes or custom endpoints as a regular DIY Prometheus. So, there is no need to deploy your own Prometheus instance in Kubernetes, deploy KSM, or deploy Prometheus node exporter.
As discussed here, Sysdig Monitor detects both Kubernetes components and your own third-party workloads. This is achieved thanks to the Kernel insights collection. If you want to check the Prometheus integrations offering, check out the documentation page.
Many of these integrations are enabled by default with Sysdig Monitor, since its portal will show you your metrics data in out-of-the-box dashboards, and will let you choose if you want to enable some of the predefined alerts available for that service.
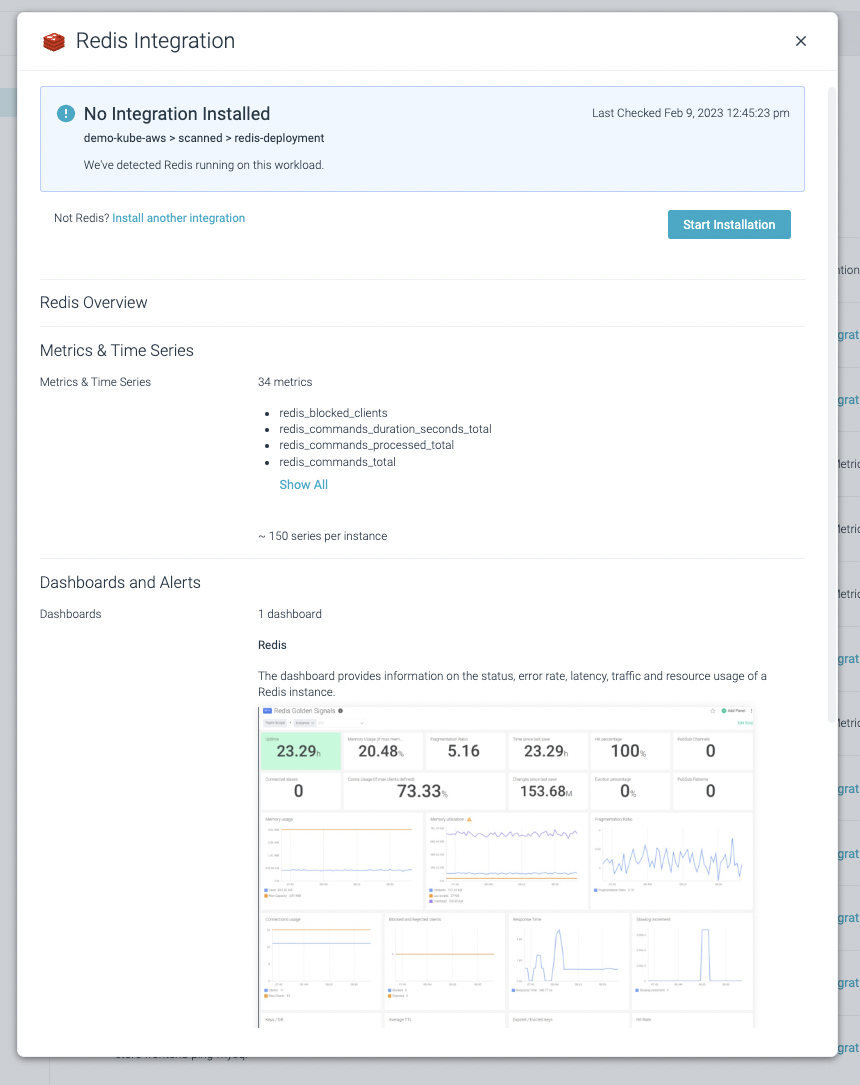
Some integrations may require manual steps. In some cases, it is required to create a ConfigMap or secrets to allow the agent to get metrics. In that case, Sysdig Monitor offers a full enterprise experience through configuration wizards that will allow you to configure and deploy the integrations in a few guided steps.
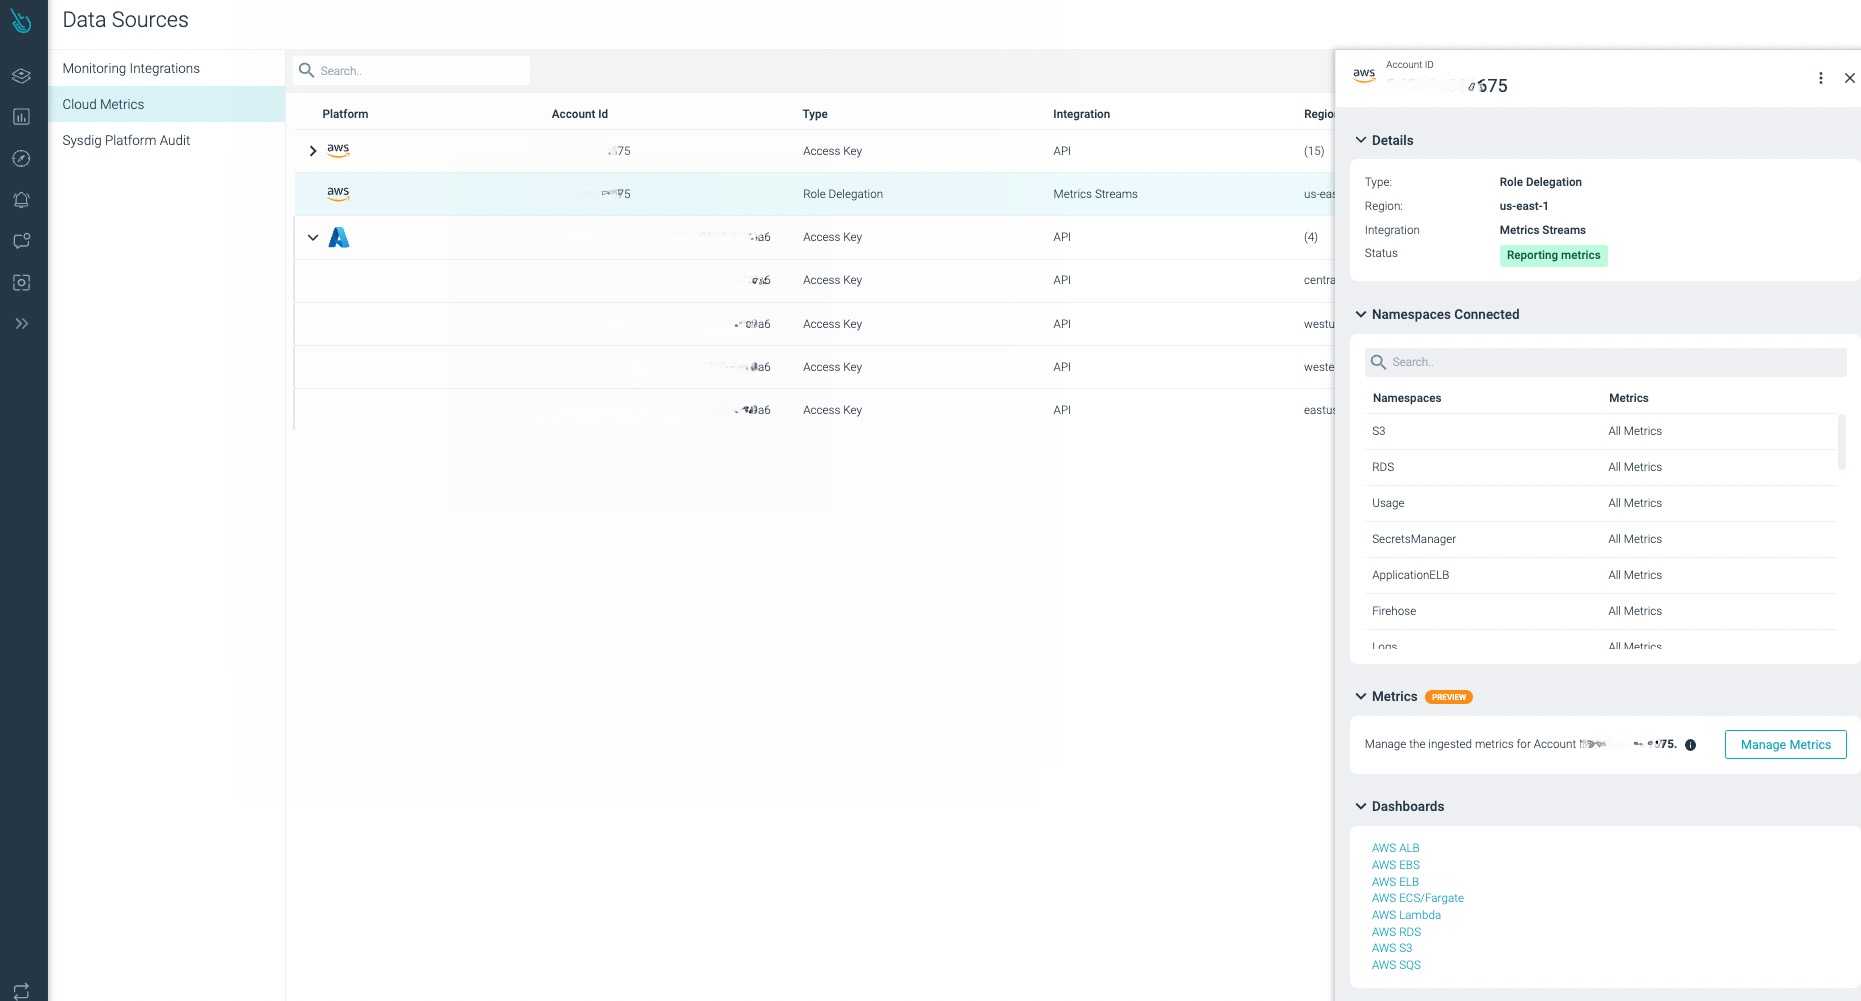
Cloud integrations for main Cloud providers are available as well. Just connect Sysdig Monitor with your cloud provider and benefit from a bunch of cloud metrics, along with the out-of-the-box dashboards and alerts for cloud services.
Benefits of using Sysdig Monitor with third-party software integrations
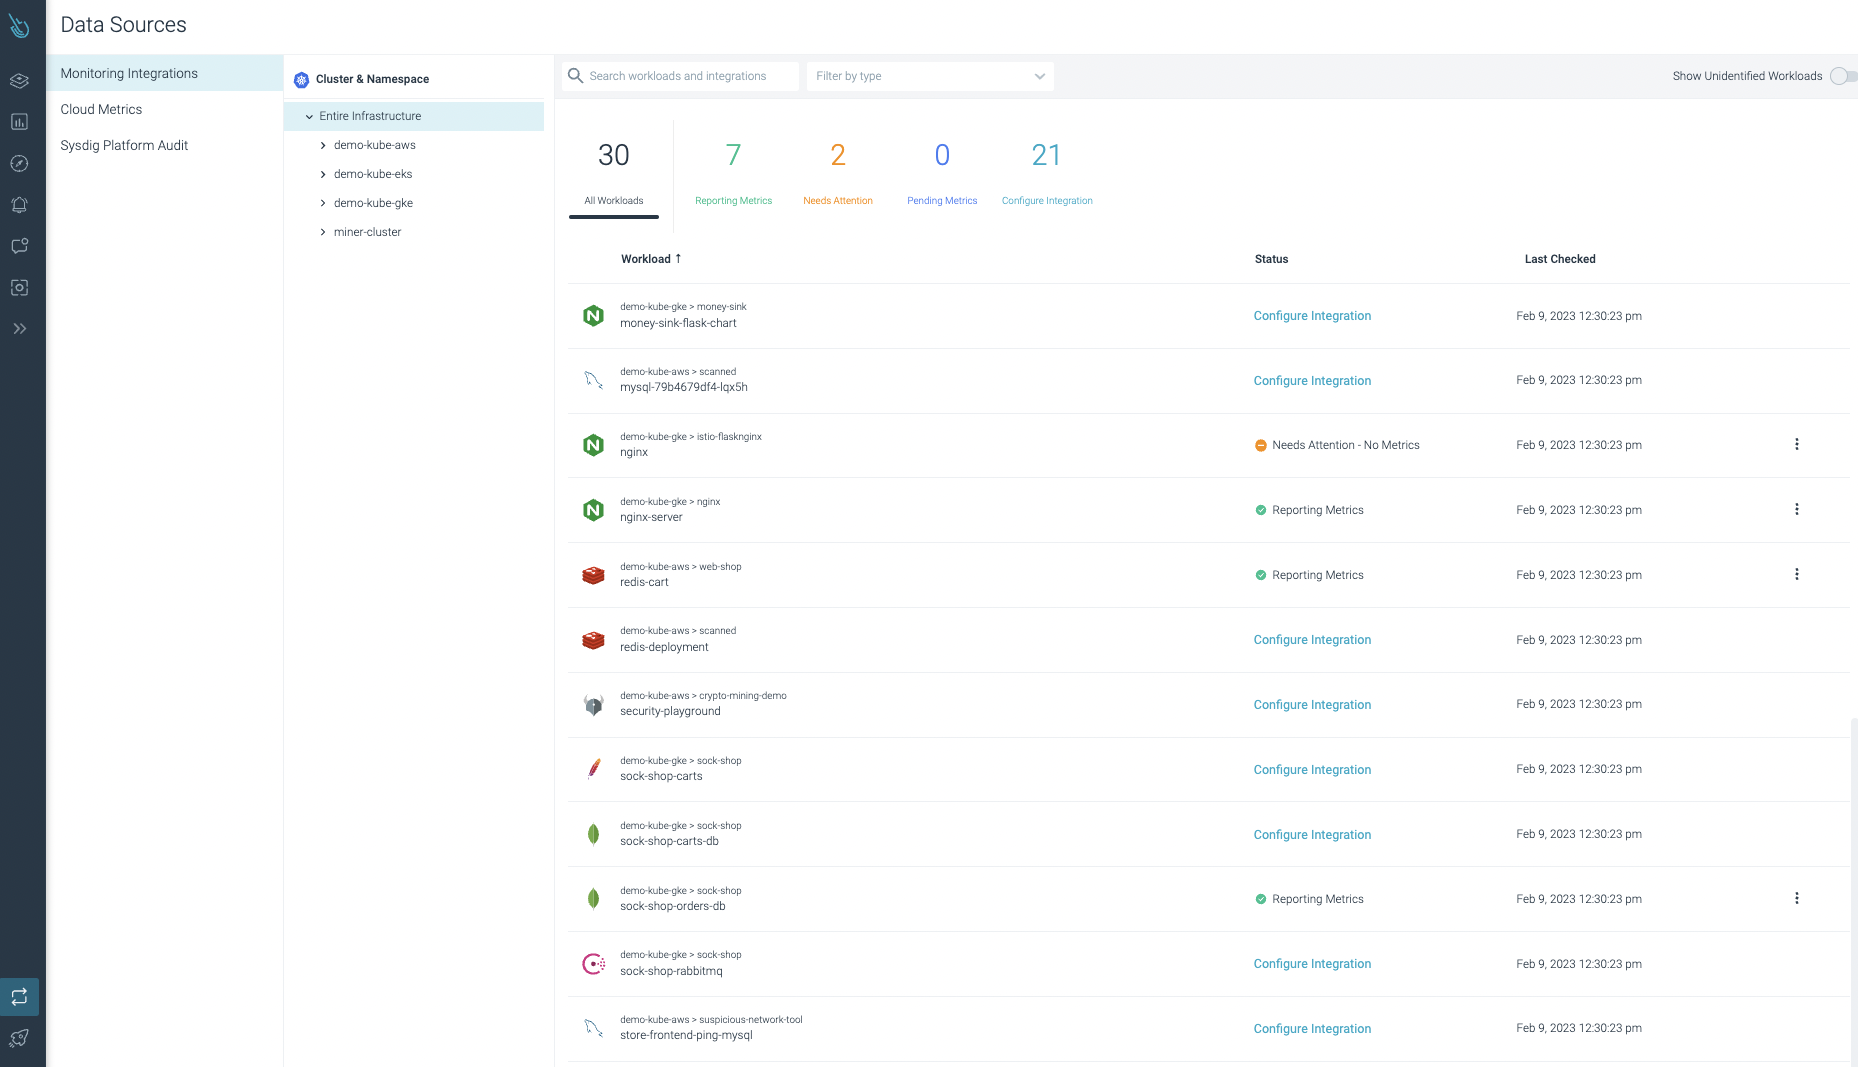
As you already have seen, Sysdig Monitor provides a unique and smooth experience when it comes to third-party applications integrations. From the console, you’ll find a summary with all the information about integrations, from the ones that were already configured to the others that are still pending to be installed.
Let’s enumerate the benefits of Sysdig Monitor integrations vs. Prometheus exporters.
- Monitoring integrations are available for you from day 0. Many of these integrations are already implemented and collecting metrics for you, automatically. Others need extra manual steps, like Secret or ConfigMap creation, but there’s no reason to worry: a guided wizard is available for you.
- Some critical endpoints, like the Kubernetes control plane components, are already monitored and available from the very beginning. There’s no need to deploy any exporter or configure any Prometheus config file.
- The base images used for Sysdig Monitor exporters are maintained by Sysdig. We take care of image version history and maintain correct tagging. UBI images are available.
- Sysdig takes care of image vulnerabilities.
- Monitoring integrations available in the Sysdig Monitor portal are already maintained, tested, and fully functional. You don’t need to worry about stability and other configuration issues. If you deploy the monitoring integration, you’ll get metrics and predefined alerts as promised. Sysdig takes care of the integration lifecycle, ensuring metrics will never stop working.
- Helm charts are available when deploying Sysdig monitoring integrations, which makes the task easier.
- Sysdig Agent is responsible for scraping metrics. You don’t need to maintain or configure any prometheus.yaml file at all. You’ll reduce your burden significantly.
Conclusion
Configuring and maintaining Prometheus exporters can be a tough task. While there are tons of Prometheus exporters created and maintained by the open source community, you may struggle when pulling data from your Kubernetes environments and cloud-native applications.
Sysdig Monitor offers an enterprise solution. You don’t need to worry anymore about which Prometheus exporter from a huge list is the good one, or you won’t have to go through complex exporter installations. Everything you may need is in the Sysdig Monitor portal. Just enjoy the integrations already provided out of the box, and deploy others following a few steps thanks to the guided wizards.
If you want to learn more about how Sysdig Monitor can help with third-party software monitoring, and Prometheus exporters, visit the Sysdig Monitor trial page and request a 30-day free account. You will be up and running in minutes!
The post Prometheus Exporters in Sysdig Monitor appeared first on Sysdig.
Article Link: Prometheus Exporters in Sysdig Monitor – Sysdig

