Prometheus is one the the most acclaimed solutions for Kubernetes monitoring. There are multiple add-ons and exporters that facilitate the task of pulling Kubernetes metrics. Sysdig Monitor is a cloud-native observability platform that helps businesses with the whole observability lifecycle. It provides simplicity at all times, allowing companies to rapidly pull their Kubernetes and Prometheus metrics without headaches.
Monitoring Kubernetes and all of its workloads and services can be really hard. Nowadays, companies rely on dozens, hundreds, or even thousands of Kubernetes nodes supporting applications and key business processes. When using DIY (Do it Yourself) Prometheus deployment in Kubernetes, you also need to deploy and configure other add-ons and exporters. This is the way to get metrics from your Kubernetes infrastructure, its services, and your own applications. This can be very time consuming and tough to maintain, especially when running lots of Kubernetes nodes. In addition, using Prometheus at scale can be really challenging and a huge pain for many companies.
Sysdig Monitor is a complete and robust cloud-native observability platform that allows customers to start pulling not only their Kubernetes metrics, but also their Prometheus metrics from the very beginning, almost immediately and without extra effort. Its Prometheus-managed service, along with tons of out-of-the-box dashboards and other unique features like Advisor and Cost Advisor, help companies with monitoring, troubleshooting Kubernetes, and reducing costs.
In this article, you’ll learn more about how Sysdig Monitor can help you with Kubernetes and Prometheus metrics ingestion, and the advantages of using its Prometheus managed service. Do you want to learn more? Then, keep reading!
DIY Prometheus metrics ingestion
When it comes to monitoring Kubernetes, apart from your DIY Prometheus instance, you’ll need a few other things. If you want to get metrics and data related to your nodes, containers, or Kubernetes objects status, you need to deploy some exporters. Prometheus will start scraping metrics from these targets after being discovered by its own service discovery.
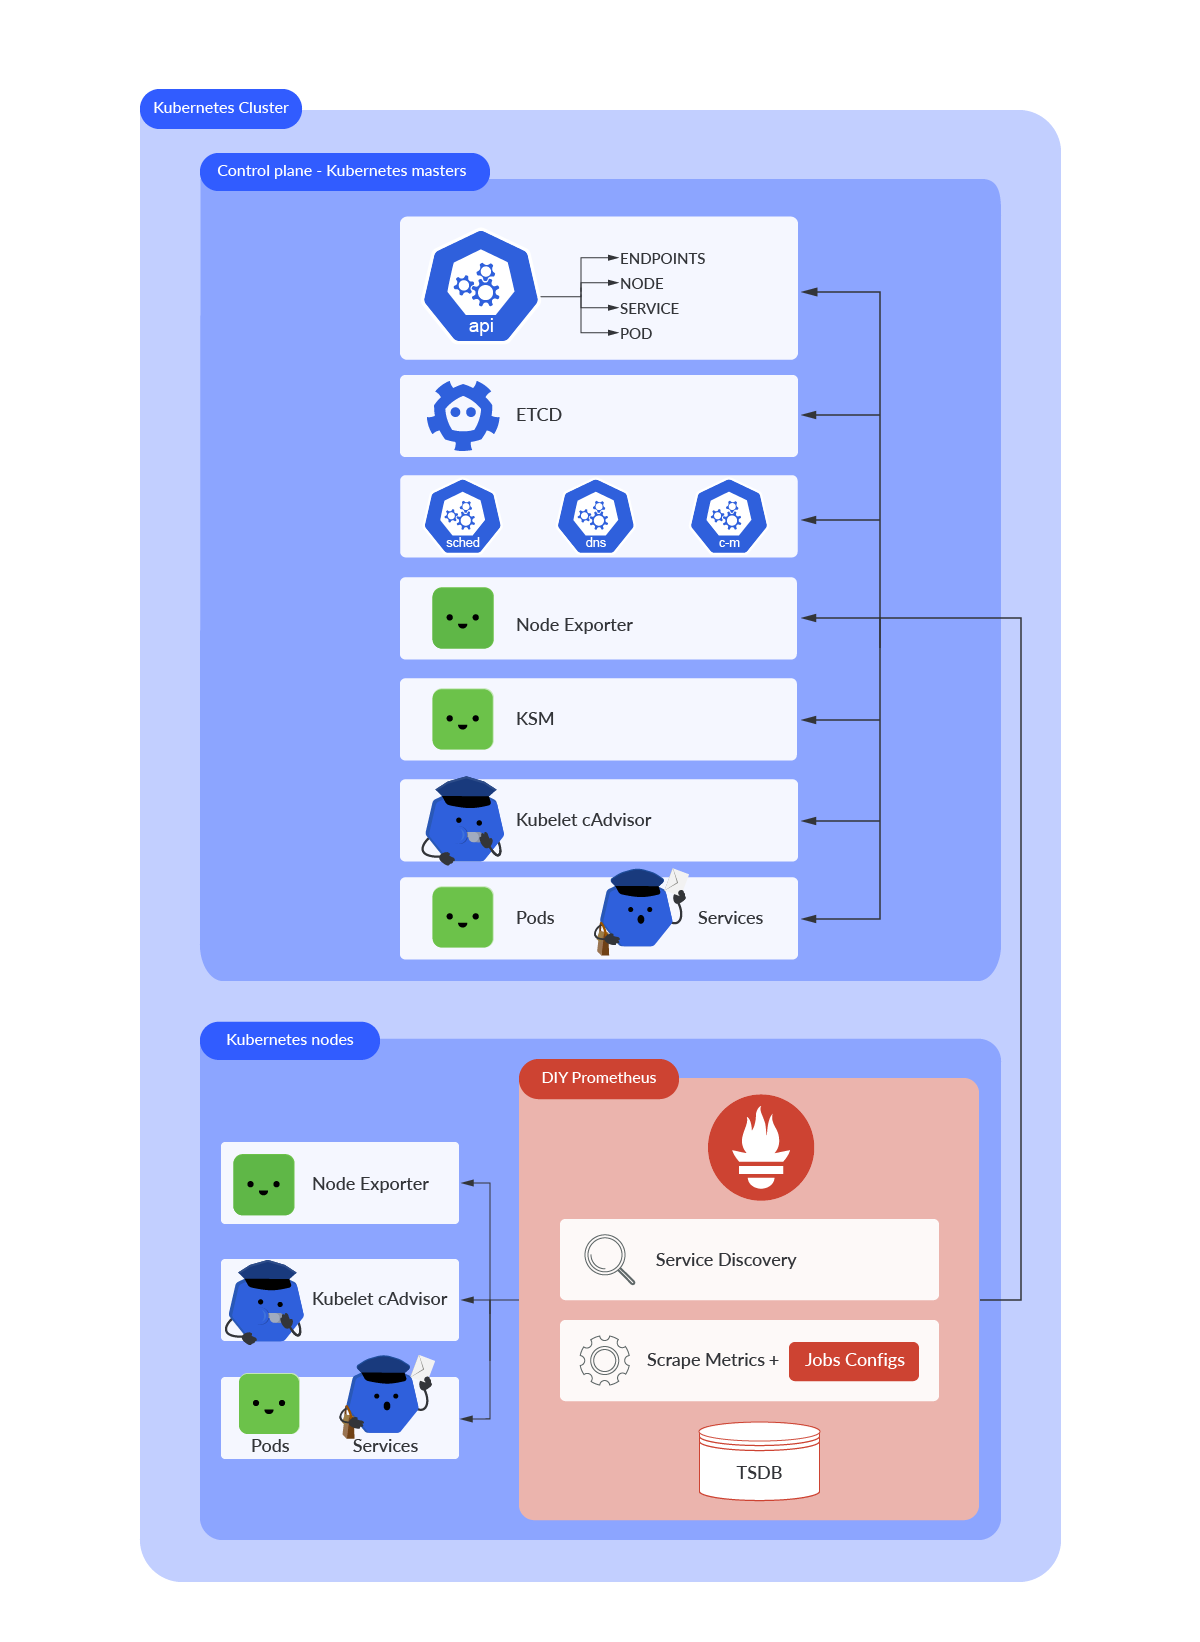
Let’s start talking about what you need and why.
cAdvisor
cAdvisor is a tool that provides visibility into container resource usage and container performance data. It is not required to deploy anything in Kubernetes, though. The Kubelet itself exposes its own /metrics endpoint. Thanks to the cAdvisor embedded code in the Kubelet via /metrics/cadvisor, you can get performance and resource usage information from containers. cAdvisor data is key for getting a better understanding of how your containers are performing.
$ curl -k -H "Authorization: Bearer $(cat /var/run/secrets/kubernetes.io/serviceaccount/token)" https://kubernetes.default.svc/api/v1/nodes/k8s-control-1.lab.example.com/proxy/metrics/cadvisor
# TYPE cadvisor_version_info gauge
cadvisor_version_info{cadvisorRevision="",cadvisorVersion="",dockerVersion="",kernelVersion="4.18.0-408.el8.x86_64",osVersion="CentOS Stream 8"} 1
# HELP container_blkio_device_usage_total Blkio Device bytes usage
# TYPE container_blkio_device_usage_total counter
container_blkio_device_usage_total{container="",device="",id="/",image="",major="11",minor="0",name="",namespace="",operation="Async",pod=""} 0 1675768595201
…
(output truncated)
Node exporter
The node exporter plugin exposes Kernel and hardware related metrics from every host. If you want to have all the key information about your Kubernetes hosts status and performance, you must have node exporter up and running. In Kubernetes, the node exporter is deployed through a DaemonSet to ensure every host has its own exporter instance running. Node exporter exposes its /metrics endpoint on port 9100. Metrics are prefixed with node_.
$ kubectl get svc prometheus-node-exporter -n monitoring
NAME                       TYPE        CLUSTER-IP      EXTERNAL-IP   PORT(S)    AGE
prometheus-node-exporter   ClusterIP   10.110.189.50   <none>        9100/TCP   147d

$ kubectl get ep prometheus-node-exporter -n monitoring
NAME                       ENDPOINTS                                                     AGE
prometheus-node-exporter   192.168.119.30:9100,192.168.119.31:9100,192.168.119.32:9100   147d

$ curl http://k8s-control-1:9100/metrics
# HELP go_gc_duration_seconds A summary of the pause duration of garbage collection cycles.
# TYPE go_gc_duration_seconds summary
go_gc_duration_seconds{quantile="0"} 3.0106e-05
go_gc_duration_seconds{quantile="0.25"} 0.000102311
…
 HELP node_arp_entries ARP entries by device
# TYPE node_arp_entries gauge
node_arp_entries{device="cali23d0a93a086"} 1
node_arp_entries{device="cali395ce2b1db4"} 1
node_arp_entries{device="cali64f632960f9"} 1
(output truncated)
Kube-state-metrics (KSM)
KSM is a service listening to the Kubernetes API service and generates its own set of metrics about the state of Kubernetes objects. It needs to be deployed in every cluster if you want to get these metrics. This service provides tons of metrics to check the status and other related information from objects like DaemonSets, deployments, nodes, namespaces, and Pods, among others. KSM is deployed through a Deployment and runs within a Pod. Its /metrics endpoint is exposed on port 8080.
$ kubectl get svc prometheus-kube-state-metrics -n monitoring
NAME                            TYPE        CLUSTER-IP      EXTERNAL-IP   PORT(S)    AGE
prometheus-kube-state-metrics   ClusterIP   10.98.209.205   <none>        8080/TCP   147d

$ kubectl get ep prometheus-kube-state-metrics -n monitoring
NAME                            ENDPOINTS             AGE
prometheus-kube-state-metrics   192.169.107.88:8080   147d

$ curl http://prometheus-kube-state-metrics.monitoring.svc:8080/metrics
kube_configmap_annotations{namespace="kube-system",configmap="extension-apiserver-authentication"} 1
kube_configmap_annotations{namespace="istio-system",configmap="istio-sidecar-injector"} 1
…
(output truncated)
Sysdig Monitor metrics ingestion
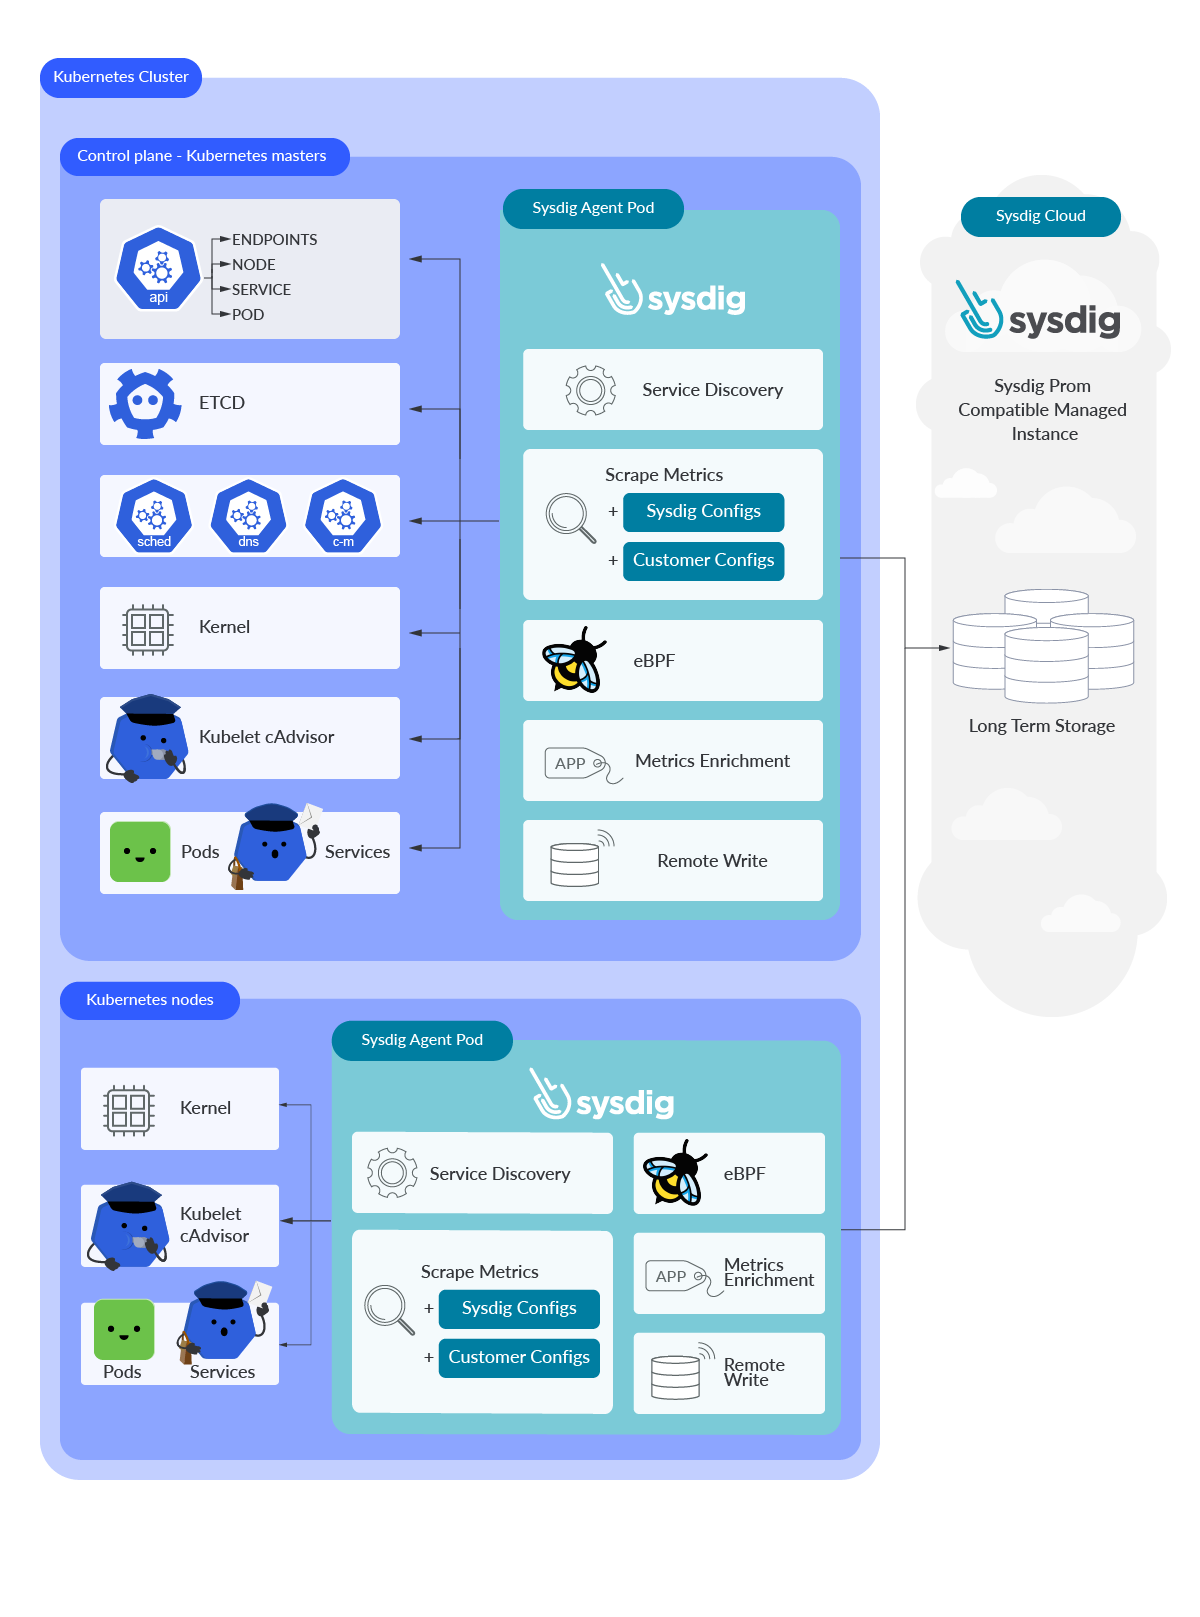
Sysdig Agent
Sysdig Monitor has its own agent running on the nodes. It can be easily deployed via a Helm chart or running a bash script provided by Sysdig. In both cases, a DaemonSet will be responsible for deploying a Sysdig Agent Pod in every Kubernetes node.
$ kubectl get pods -n sysdig-agent
NAME                 READY   STATUS    RESTARTS      AGE
sysdig-agent-6wfjv   1/1     Running   2 (62m ago)   6d2h
sysdig-agent-g2kg4   1/1     Running   2 (62m ago)   6d2h
sysdig-agent-h82d7   1/1     Running   2 (62m ago)   6d2h
After deploying the agent, it will take no more than one minute before the Sysdig Agent starts pulling your Kubernetes metrics from your infrastructure. There is no need to deploy any extra exporters or add-ons at all. The Sysdig Agent is able to reach your Kubernetes endpoints by itself thanks to a preloaded configuration curated and maintained by the Sysdig Engineering team. The same way, it will push this data to its own Prometheus-managed service in the Sysdig cloud. Your Kubernetes metrics, alongside with your own Prometheus and custom metrics and other data from your infrastructure, is available almost immediately for you.
Lightweight Prometheus instance
Sysdig Agent is not only able to start scraping metrics from Kubernetes automatically, but can also scrape your Prometheus metrics from your endpoints for you thanks to its Prometheus native service discovery and auto-scrape feature. A lightweight Prometheus instance is embedded into the Sysdig Agent and runs on every node. If you inspect the Sysdig container, you’ll see this Prometheus-like process.
$ kubectl exec -it sysdig-agent-6wfjv -n sysdig-agent -- /bin/bash
# ps -ef|grep prom
root        9945    5957  0 11:00 ?        00:00:16 promscrape_v2 --grpc.address=unix:/opt/draios/run/promscrape.sock --web.enable --web.listen-address=127.0.0.1:9990 --log.format=json --log.level=info --config.file=/opt/draios/etc/promscrape.yaml --source.label=pod_id,sysdig_k8s_pod_uid,remove --source.label=container_name,sysdig_k8s_pod_container_name,remove --source.label=sysdig_bypass,sysdig_bypass,remove --source.label=sysdig_omit_source,sysdig_omit_source,remove --cache.enable
Since it has its own Prometheus instance, you can still add your own custom Prometheus jobs to start ingesting from any new endpoints in your Kubernetes infrastructure if you want. Your own configurations in prometheus.yaml config file are fully supported. The same way, the Sysdig Agent is able to detect third-party software. Many of these, like Istio, are integrated and enabled by default. Others are available via integrations.
eBPF
A set of eBPF programs are integrated into the Sysdig observability instrumentation. Kernel system calls are captured in real time, feeding the Sysdig Monitor backend with all the information you may need from your Kubernetes and cloud infrastructure. No matter if you need to get any performance related data from your hosts, or you have to follow an internal system call thread from a container, everything is captured by the Sysdig Agent and pushed to the Sysdig Monitor backend.
So far so good. But in terms of Kubernetes and Prometheus metrics, apart from enhanced security and performance, what does the eBPF integration bring to Sysdig customers to make it unique among competitors?
Sysdig Agent turns Kernel insights into real metrics for customers. As an example, thanks to the eBPF instrumentation, Sysdig Monitor provides new sets of network metrics from your infrastructure, calculated at the Kernel level by measuring latencies between system calls. This data can not be obtained from either cAdvisor, exporter node, or KSM. eBPF is also used for Golden Signals metrics. Thanks to the syscalls data the agent collects from the Kernel, errors, saturation, traffic, and latency can be monitored. Besides those metrics already mentioned, processes and IO metrics are obtained from syscalls using eBPF as well.
The same way, due to the Kernel insights data, Sysdig Monitor is able to detect any workload running in your Kubernetes environment. With out-of-the-box dashboards and Sysdig Advisor, you can monitor and troubleshoot your own applications, even third-party ones, from the very beginning.
KSM, cAdvisor, and node exporter are not needed
That’s correct! When using Sysdig Agent, you don’t need to deploy any of these exporters and add-ons. When it comes to get the equivalent node exporter data, as described above, Sysdig Agent pulls this data from every Kernel node.
In terms of cAdvisor metrics, the Sysdig Agent scrapes its own set of metrics from the Kubelet cAdvisor module integrated on every Kubernetes node.
Sysdig’s node exporter and cAdvisor metrics are not compatible with DIY Prometheus names and labels.
What about KSM? The Sysdig Agent has its own job already configured to scrape KSM metrics from the Kubernetes API server. No exporter is required at all. When scraping KSM metrics, performance is something to keep in mind. In larger environments, scraping KSM metrics from the Kubernetes API server might not perform really well. Sysdig offers KSM optimized metrics for large scale environments. Those are being pulled every 10 seconds instead of the 60 seconds by default in DIY Prometheus. Sysdig KSM metrics are mostly compatible with OSS KSM metrics, so users can still rely on their own dashboards and PromQL queries.
As you can see, ingesting Kubernetes internal data is easier than using DIY Prometheus. Sysdig enables users to start pulling data automatically without any additional steps. There’s no need to deploy either maintain exporters or add-ons in your Kubernetes clusters.
Metrics enrichment
At ingestion time, something really exciting happens under the hood with your metrics and cloud infrastructure. As discussed earlier, Sysdig Agent discovers automatically and not only gets Kubernetes metrics, but Prometheus metrics as well. It also pulls Kernel related data and other infrastructure and cloud metrics. All that information from your infrastructure is used to tag every single metric via annotations. That way, you correlate your Kubernetes and your own application metrics with your cloud infrastructure information. That’s what we know as metrics enrichment.
Thanks to the metric enrichment, you don’t need to go through endless joins to get your data. Tons of labels are already applied in your metrics, and data already has Kubernetes and cloud context, so it is much more accessible to you.
With this metric enrichment, you can easily get the container_id, the IP instance, and the type of instance in your cloud provider… even the cost! Just click on your metric and get all that information and much more immediately, as labels, with no need for joins or other promQL secret magic.
Sysdig now collects and feeds your metrics with your Kubernetes and Cloud costs. There’s no need to deploy OpenCost or similar tools because everything is provided out of the box.
Sysdig remote write
Sysdig Monitor is remote write compatible. You can push your own metrics as you do with DIY Prometheus. This is especially useful for non-Linux Kernel environments where Sysdig agents can’t be installed, for example, Windows nodes or other Prometheus instances.
Benefits of ingesting data with Sysdig
Once you have gone through both metrics ingestion workflows and have learned more about each component, let’s summarize the benefits of using Sysdig for Kubernetes metrics ingestion.
- Sysdig Agent installation is easy and fast. Deploy it via Helm chart in a couple of minutes.
- No need to deploy any exporter or add-on for Kubernetes metrics. Sysdig Agent starts scrapping your Kubernetes metrics and infrastructure data automatically.
- Kubernetes control plane monitoring is key. Sysdig Agent collects all this data for you automatically, without any additional steps. With DIY Prometheus, you need to configure jobs for every control plane component. Explore the Kubernetes control plane data thanks to the out-of-the-box dashboards in Sysdig Monitor.
- Sysdig integrates its own eBPF programs in the Sysdig Agent for the sake of monitoring performance, security, and insights, among others. Kernel insights are now available as metrics in Sysdig Monitor, and no additional steps are required. Everything you may need is provided out of the box.
- The Sysdig Agent is able to detect your own workloads and other third-party software. Thanks to the out-of-the-box dashboards, you can observe your own applications performance from the very beginning. No extra action is required from your end.
- Thanks to the metrics enrichment, you get additional content for your metrics. Infrastructure and cloud-related data is associated with your own Kubernetes and Prometheus metrics. Your applications now gain Kubernetes context.
- Kubernetes and cloud costs are now available as metrics and dashboards in Sysdig Monitor. Are you aware how much money you are overspending? Cost Advisor will help you reduce your wasted spending.
- No need to deploy and maintain any DIY Prometheus instance. This is a huge pain for many customers that struggle with Prometheus at scale. The more metrics, the more resources you need to ingest, process, and keep your data safe. This is managed by Sysdig, you don’t need to take care of this critical point anymore.
- Sysdig ingests data every 10 seconds, instead of the 60 seconds by default in DIY Prometheus.
- Gain Kubernetes context with events, process, and network metrics from your Kubernetes clusters.
- You can push your metrics using remote write as you do with DIY Prometheus.
Conclusion
Pulling metrics from your Kubernetes clusters is not a big deal, but when you reach a certain volume of metrics, scraping metrics with a DIY Prometheus, maintaining, and ensuring availability can be challenging.
Sysdig Monitor takes care of all these hard tasks for you. From pulling Kubernetes metrics and your infrastructure information, to pushing all the data – going through a metric enrichment process first – to the Sysdig Prometheus compatible managed platform. You don’t need to worry about performance, scalability, and availability of your Kubernetes and Prometheus metrics. In addition, you can benefit from all the features that Sysdig Monitor brings for analyzing and troubleshooting issues in Kubernetes.
If you want to learn more about how Sysdig Monitor can help with Kubernetes metrics ingestion, visit the Sysdig Monitor trial page and request a 30-day free account. You will be up and running in minutes!
The post Prometheus and Kubernetes Metrics Ingestion appeared first on Sysdig.
Article Link: Prometheus and Kubernetes Metrics Ingestion – Sysdig