Timeline Explorer is a program that started out as a means to view mactime and Plaso generated CSV timelines without the need to use Excel. From these two formats, it has expanded into a tool that supports a wide variety of file formats generated by forensic tools in addition to any random CSV or Excel file you may run across.
Note: Timeline Explorer is not meant to open very large files. It is best to open smaller, targeted timelines than one giant one.
It supports opening more than one document at a time, allows for conditional coloring, filtering and grouping, and much more.
For many files, Timeline Explorer is much faster at both opening and interacting with the data contained therein.
The interface is very simple:
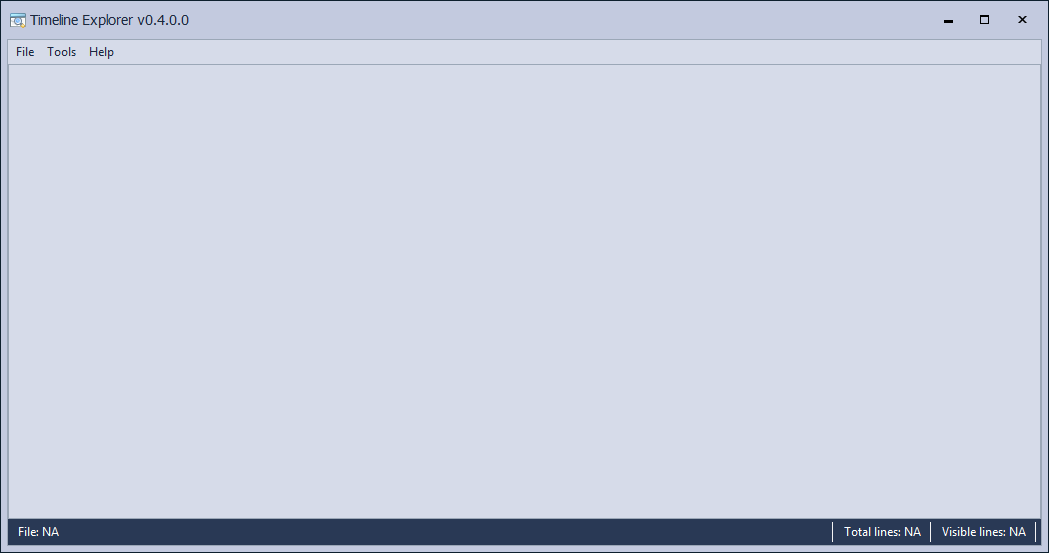
The File menu contains the following options:
Open: Select one or more file to open
Export | Excel: Exports the active tab and view to Excel. What you see is what will be exported
Exit: Quits the program
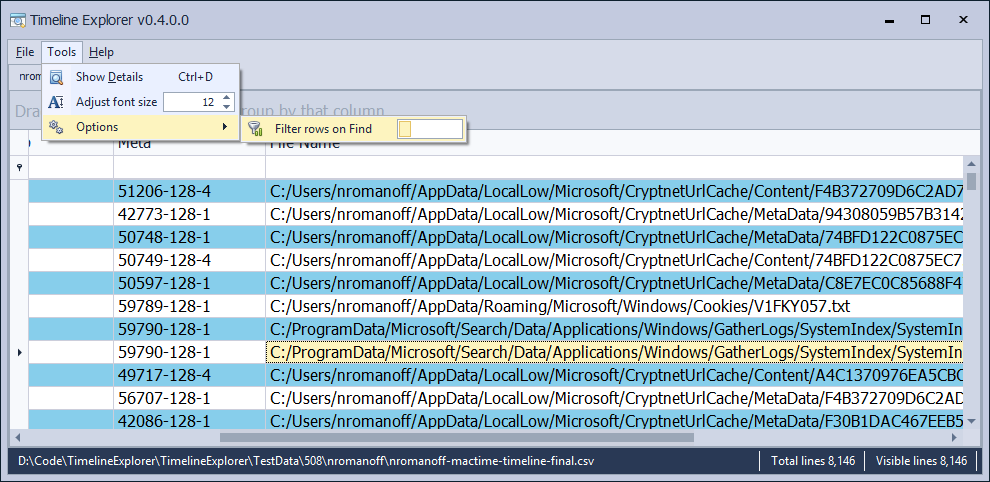
The Tools menu contains the following options:
Show Details: Displays a dedicated form to inspect all data available in a Plaso generated timeline
Adjust font size: Changes the font size for the main grid
Options | Filter rows on Find: Controls whether or not data is filtered out or simply highlighted when using the Find feature
The Help menu contains the following options:
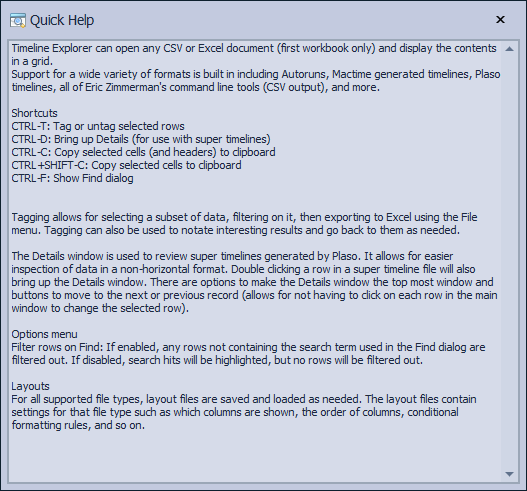
Quick help: Displays an overview of Timeline Explorer and how to use it
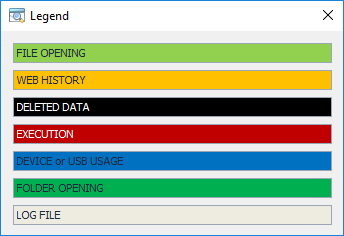
Legend: Contains the color codes used in mactime and super timelines for various types of artifacts
About: Contains information about the program version and contact info
Here is what Quick Help looks like:
Supported file formats
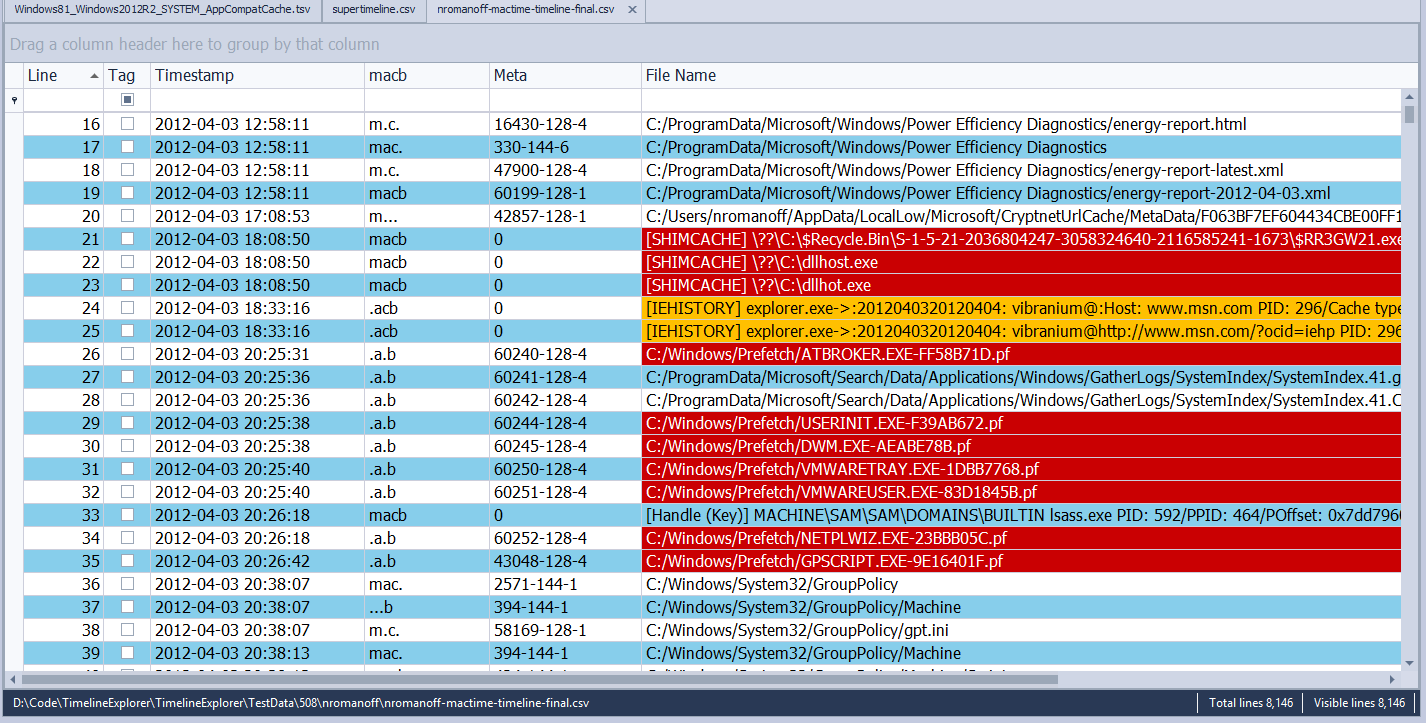
Here is a Plaso timeline:


Diving into super timeline data

Notice here the tooltip contains a wealth of information that is contained on a single line. If we select that cell and use CTRL-C to copy it to the clipboard, then paste it into a text editor, we can see the details a bit more clearly:

Even in this scenario, the data is not very clean in that there are tab and linefeed characters throughout. While we can certainly do a find and replace on those, that would be impractical in the long term.
TLE solves this problem by making all the data available in a super timeline visible (regardless of whether a column visibility in the main grid). It does this via the Details form which is available from the Tools menu. It can also be shown via the CTRL-D shortcut or by simply double-clicking a row.

There are several options available on the Details form including the ability to keep it on top of the main window. This is useful if you want to navigate data in the grid by clicking on the grid and using the arrow keys to navigate. Of course, with multiple monitors or higher resolutions, this becomes less of an issue. There are also two buttons in the lower right that allow for navigating entries.
Other capabilities

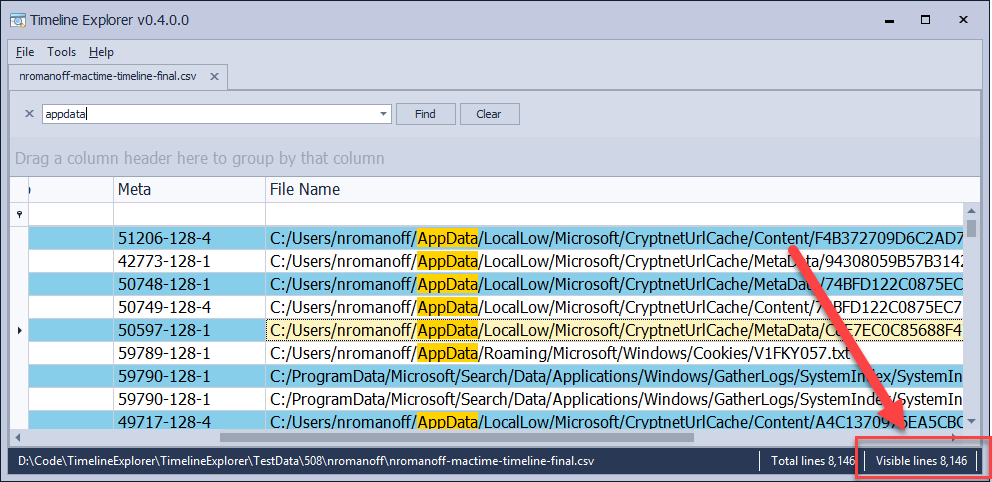
Searching
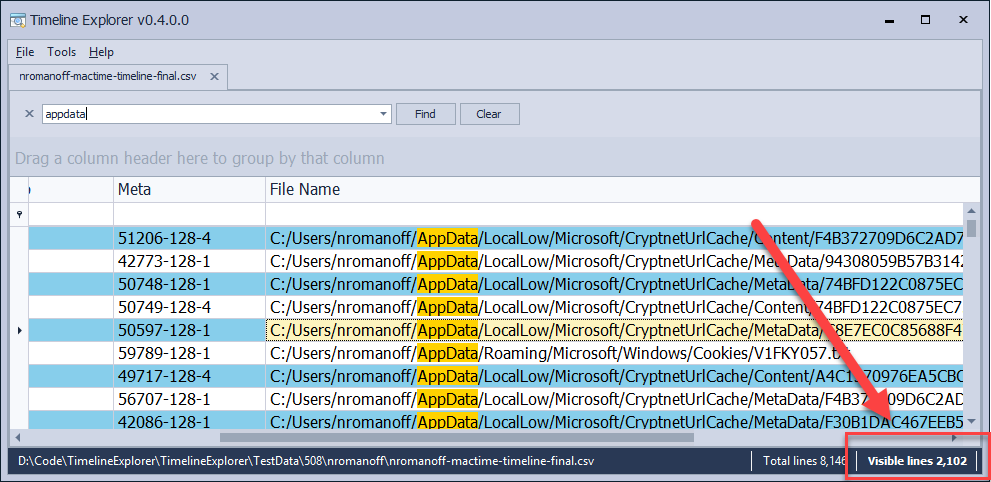
If this option is enabled and we do the same search again, notice what happens:
Tagging
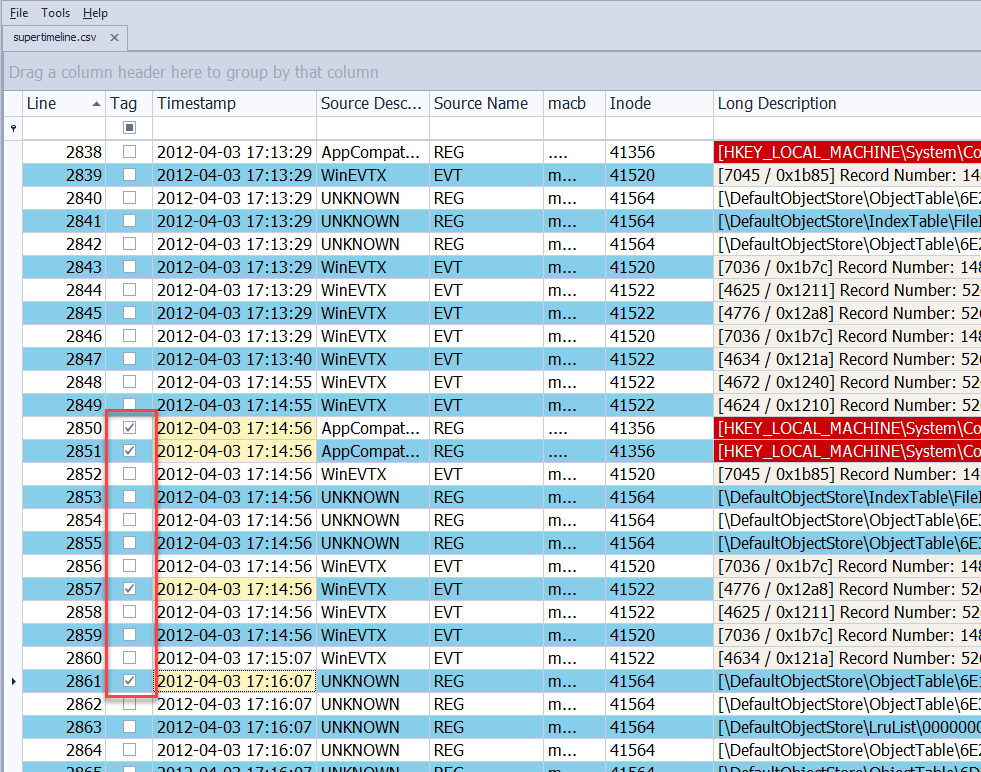
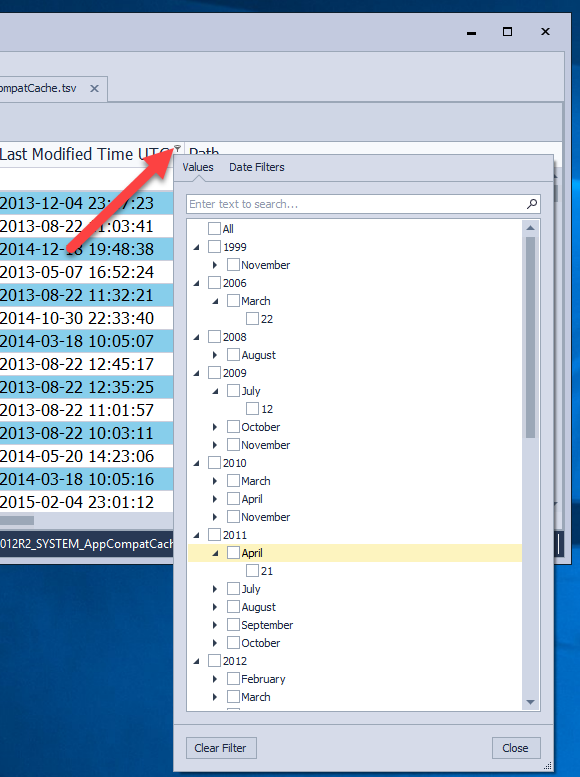
Because the tag status is maintained in its own row, we can filter for tagged rows. Let’s say during the course of a review, several rows of interest were found by the investigator and tagged. This slice of the timeline can then be exported to Excel.
To do this, we first filter for tagged rows via the Tag column’s filter, then Export via the File menu.

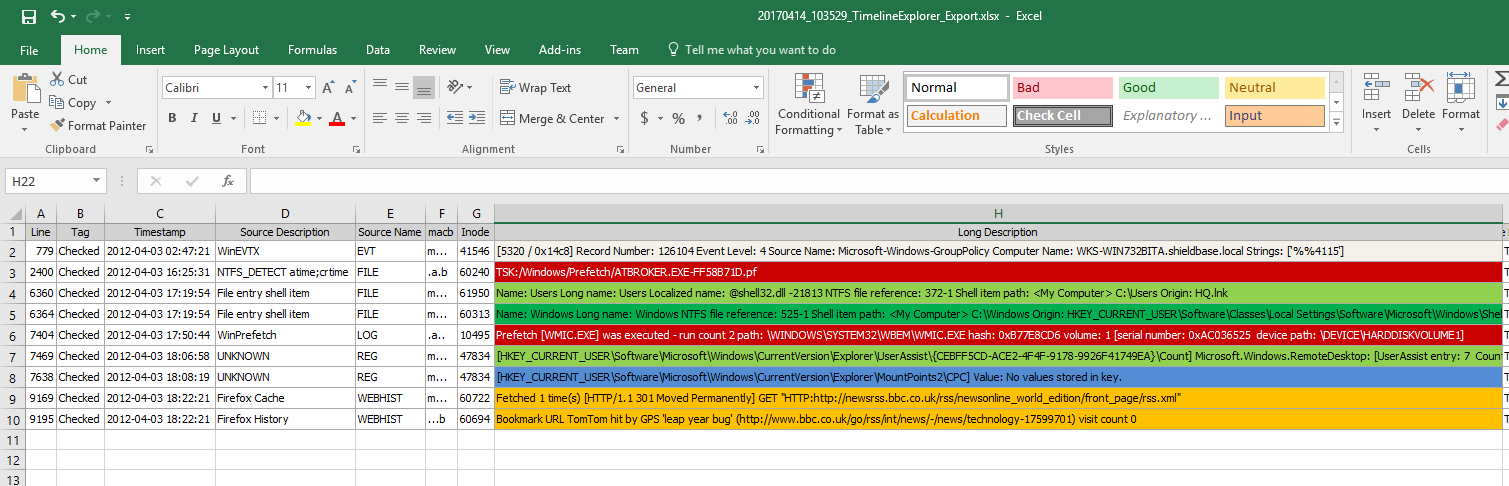
The data in the grid will be exported exactly as it is shown. This allows you to hide or reorder columns and so on and have the exact representation of data available to you in the Excel document TLE will generate.
Below is an example of what the data from above looks like in Excel.
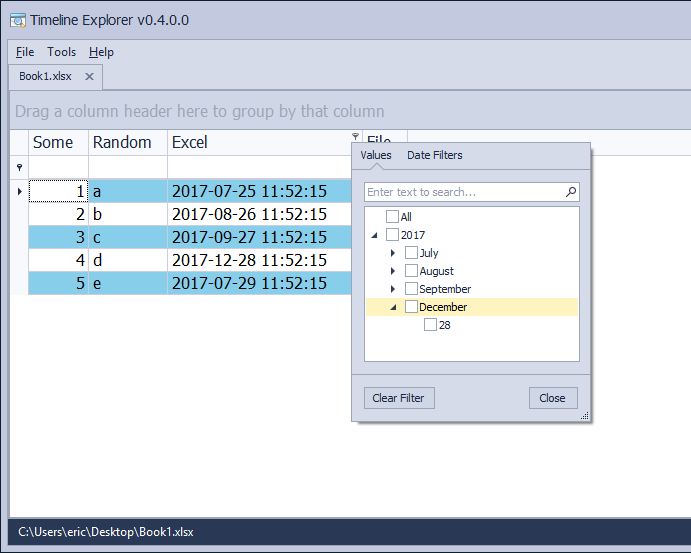
Dynamic mode


Article Link: http://binaryforay.blogspot.com/2017/04/introducing-timeline-explorer-v0400.html