IDA supports many file formats, among them the main ones used on the main three operating systems:
- PE (Portable Executable) on Windows;
- ELF (Executable and Linkable Format) on Linux;
- Mach-O (Mach object) on macOS.
Symbols and debug information
Symbols are information which can be stored in the file itself or separately and associates locations inside the file (e.g. addresses functions or variables) with textual names (usually the names used in the original source code). The part of the file storing this association is commonly called symbol table.
Traditionally, the PE files do not contain any symbols besides those that are required for imports or exports for inter-module linking. ELF and Mach-O commonly do keep names for global functions, however most of this information can be removed, or stripped, without affecting execution of the file. Because such information is very valuable for possible debugging later, it can be stored in a separate debug information file.
For PE files, a common debug format is PDB (Program Database), although other formats were used in the past, for example TDS (Turbo Debugger Symbols) was used by Borland compilers, and DBG in legacy versions of Visual Studio. Both ELF and Mach-O use DWARF. All of the above can contain not only plain symbols but also types (structures, enums, typedefs), function prototypes, information on local variables as well as mapping of binary code to source files (filenames and line numbers).
Although originally intended to improve debugging experience, all this information obviously makes the reverse engineering process much easier, so IDA supports these formats out of box, using standard plugins shipped with IDA:
- pdb for PDB;
- tds for TDS;
- dbg for DBG;
- dwarf for DWARF.
Automatic debug info loading
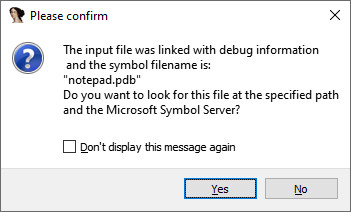
Standard file loaders detect when the file has been built with debug information and invoke the corresponding debug info loader. If debug info is found in the input file, next to it, or in another well-known location, the user is prompted whether to load it.
Manual debug info loading
If the separate debug info file is not present in standard location or discovered later, after you’ve already loaded the file, it can be loaded manually. Currently only PDB and DWARF can be loaded using this option.
- For PDB, use File > Load file > PDB File…
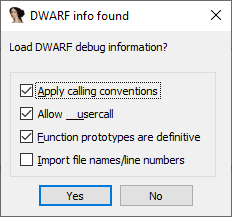
- For DWARF, Edit > Plugins > Load DWARF File
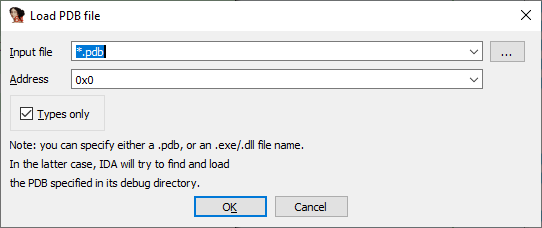
For the PDB loader, you can specify a DLL or EXE file instead of the PDB; in that case IDA will try to find and load a matching PDB for it, including downloading it from symbol servers if necessary. By using the “Types only” option, you can import types from an arbitrary PDB and not necessarily PDB for the current file. For example, PDB for the Windows kernel (ntoskrnl.exe) contains various structures used in kernel-mode code (drivers etc.) so this feature can be useful when reverse-engineering files without available debug info.
Example: Linux kernel debug info
Linux kernels are usually stripped during build, however many distros provide separate debug info repositories, or you can recompile the kernel with debug info. How to load it into IDA?
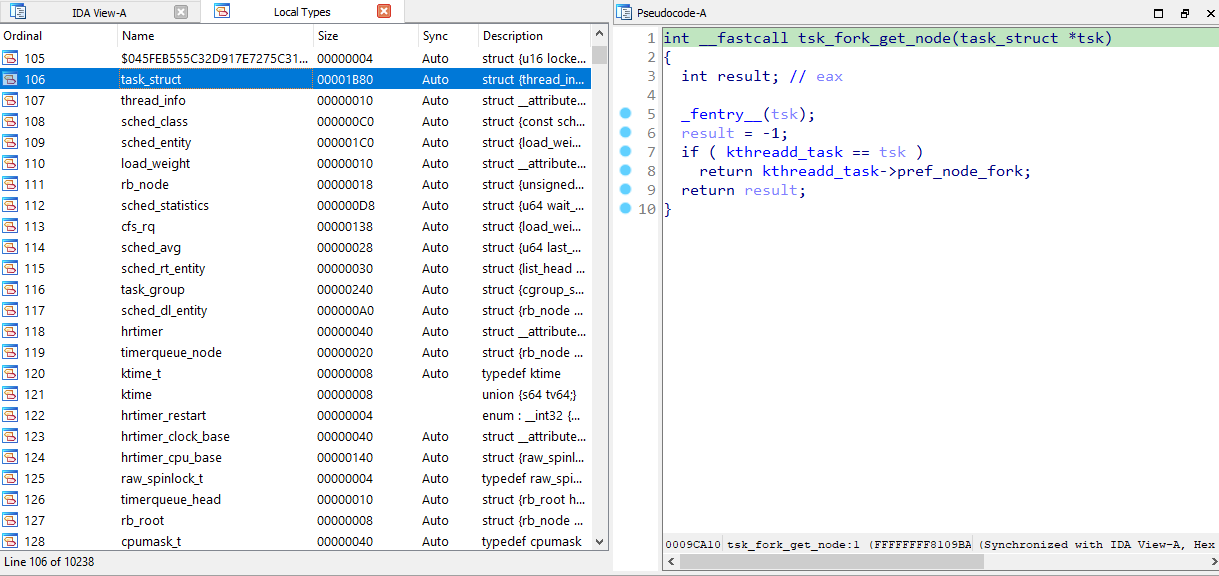
For self-built kernel it’s pretty simple – the vmlinux file is a normal ELF which can be simply loaded into IDA. However, the pre-built kernels are usually distributed as vmlinuz which is a PE file (so that it can be booted directly by the UEFI firmware), with the actual kernel code stored as compressed payload inside it. The unpacked kernel can be extracted manually or using the vmlinux-to-elf project, loaded into IDA, and the external debuginfo file can then be loaded via Edit > Plugins > Load DWARF File, producing a nice database with all kernel types and proper function prototypes.
Article Link: Igor’s tip of the week #55: Using debug symbols – Hex Rays