SEH tricks is not a new Anti-Debugging trick. So many malware already used this to make the manual debugging of its code time consuming and confusing. Today I will share how Gh0strat malware make use of nested SEH exception (try{} catch) as anti-debugging trick to hide its decryption routine.
This article is not to tackle the full C++ Exception Internals, but to share how IDAPRO really helps me in analyzing this type of anti-debugging tricks statically. :)
So lets start!!!
SEH:
Structure Exception handler (SEH) is one of the classic Anti-debugging tricks used by malware. where it tries to abuse the mechanism provided by operating system in managing exceptional situation like reference to a non-existence address pointer or execution of code in a read-only page.
This is done usually by locating the pointer to SEH linked list in the stack known to be the SEH frame. The current SEH frame address is located in 0x00 offset relative to the FS (x32 bit) or GS selection (x64 bit).
 |
| figure 1: FS[0] of x32 bit OS |
 |
| figure 2: The EXCEPTION_REGISTRATION_RECORD in FS[0] |
When the exception is triggered, control is transfer to the current SEH handler where it will return one of the _EXCEPTION_DISPOSITION members.
In this Gh0strat variant it used nested SEH (try{} catch{}) that serve as anti-debugging tricks to make the debugging more confusing or let say more time consuming if analyst didn't notice the SEH.
Gh0srat: Nested SEH to decrypt its payload:
The sample we will use here contains a big data section where the encrypted gh0strat payload located. we will notice that using DIE tool or PE-bear that visualized the size of each section with quite high entropy same as text section.
 |
| figure 3: high entropy of data section |
we all know there are so many faster way to bypassed this anti-debugging technique like monitoring the TIB offset 0x0 dynamically for next SEH or dumping process. In our case I will just want to share how IDA PRO will help you a lot in this case in traversing "FuncInfo" structure since IDAPRO resolved most of this SEH structure.
when you try to load the sample in debugger and breakpoint on some API let say, you may encounter some exception error shown in figure below. This is also a good hint that it may use SEH technique.
 |
| figure 4: exception during debugging |
by further checking its code using IDAPRO I notice that it uses nested SEH. yes a nested try{} catch{} exception handler to decrypt its payload. at the entry point of the malware code you will notice right away the first exception handler function registered to FS:0. Exception will be trigger by calling "call __CxxThrowException" API.
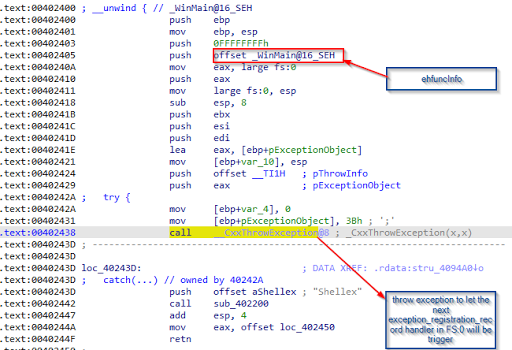 |
| figure 5: first SEH in malware entrypoint |
ehFuncInfo or the exception handler function registered in FS:0 contains some structure that may help us to figure out statically which exception handler function may be call upon the exception is trigger.
I really recommend to read this great presentation of hexblog regarding the Exception and RTTI:
https://www.hexblog.com/wp-content/uploads/2012/06/Recon-2012-Skochinsky-Compiler-Internals.pdf
The ehFuncInfo is a object structure that may lead you to the "AddressOfHandler" which is a address or a function address that will handle the exception encounter of the current thread.
IDAPRO really did a good job to give you some hint how to traverse that structure and lead you the said structure member of HandlerType. FuncInfo structure contains several member so I will just focus on the member that helps me to decrypt the payload.
Below is a simple structure starting from "FuncInfo" that may help you to look for the AddressOfHandler field member of HandlerType structure.
 |
| figure 6: Traversing AddressOfhandler |
The figure 6 shows that FuncInfo structure contains TryBlockMap field. this field is another structure object that contains HandlerArray field structure that holds the AddressOfHandler field. so to make use of this structure in our sample lets try to traverse the first SEH in malware entry point.
 |
| figure 7: Traversing the AddressOfHandler of SEH in malware entry point |
We saw that the possible Address that will handle the exception is in 0x40243d. It works in dynamically test I did with x64dbg where I put break point on this address after the exception then press skip exception shift+f9.
 |
| figure 8: AddressOfHandler was triggered |
if we follow the call function 0x402200 pushing string address "Shellex" as a parameter. you will notice again that it use another SEH to execute piece of its code. Not like the first SEH, this SEH contains 9 tryblock and HandlerOfAddress like the figure below.
 |
| figure 9: multiple try Block Map |
Parsing ehFuncInfo structure Using Ida python:
In this case I decided to use IdaPython to parse all the FrameHandler ehFuncInfo structure to locate all AddressOfHandler field available for all tryBlockMap entries and add it as a code reference comment in its IDB. This approach help me to figure out where the decryption routine and learn multi line comment in idapython :).
the script is available here:
https://github.com/tccontre/KnowledgeBase/blob/main/malware_re_tools/gh0strat_seh_helper/readme.md
 |
| figure 10A: before running the script |
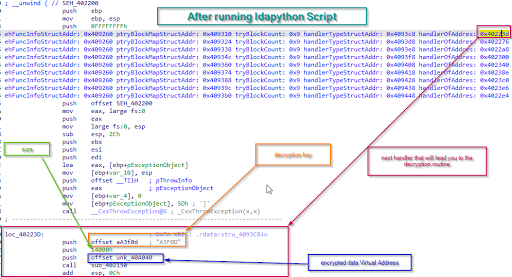 |
| figure 10B: IDB after running the script |
now with this comment we can verify all possible AddressOfHandler in each tryBlockMap entry to locate the decryption routine. Like the figure above, the first AddressOfHandler isa function waiting for the decryption key, size of the encrypted payload and the address of the encrypted payload.
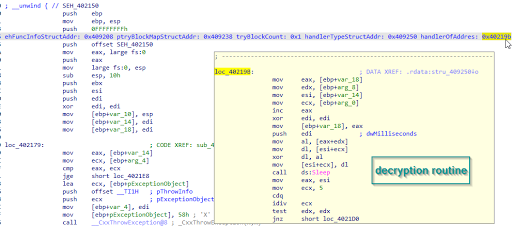 |
| figure 11: decryption routine |
and once you decrypt the payload using this simple xor decryption routine. you can see right away some note worthy string of gh0strat like keylogging, creating services, regrun, download files, backdoor and etc.
 |
| figure 12: strings upon decryption |
Conclusion:
In this article we just focus on some basic internals of SEH frameHandler and how to look for all possible HandlerOfAddress that may executed upon the trigger of registered SEH. we also learned how IDAPRO did a really good job in giving you all the needed structure for try block entries where you can use IDApython to make your static analysis more easier. :)
IOC:
yara:
import "pe"
rule gh0st_rat_loader {
meta:
author = "tcontre"
description = "detecting gh0strat_loader"
date = "2021-02-22"
sha256 = "70ac339c41eb7a3f868736f98afa311674da61ae12164042e44d6e641338ff1f"
strings:
$mz = { 4d 5a }
$code = { 40 33 FF 89 45 E8 57 8A 04 10 8A 14 0E 32 D0 88 14 0E FF 15 ?? ?? ?? ?? 8B C6 B9 ?? 00 00 00 }
$str1 = "Shellex"
$str2 = "VirtualProtect"
condition:
($mz at 0) and $code and all of ($str*)
}
rule gh0st_rat_payload {
meta:
author = "tcontre"
description = "detecting gh0strat_payload in memory without MZ header in memory"
date = "2021-02-22"
sha256 = "edffd5fc8eb86e2b20dd44e0482b97f74666edc2ec52966be19a6fe43358a5db"
strings:
$dos = "DOS mode"
$av_str1 = "f-secure.exe"
$av_str2 = "Mcshield.exe"
$av_str3 = "Sunbelt"
$av_str4 = "baiduSafeTray.exe"
$clsid = "{4D36E972-E325-11CE-BFC1-08002BE10318}"
$s1 = "[WIN]"
$s2 = "[Print Screen]"
$s3 = "Shellex"
$s4 = "HARDWARE\\DESCRIPTION\\System\\CentralProcessor\\0"
$s5 = "%s\\%d.bak"
condition:
($dos at 0x6c) and 2 of ($av_str*) and 4 of ($s*) and $clsid
}
References:
https://www.hexblog.com/wp-content/uploads/2012/06/Recon-2012-Skochinsky-Compiler-Internals.pdf
Article Link: https://tccontre.blogspot.com/2021/02/gh0strat-anti-debugging-nested-seh-try.html