Introduction
Hello and welcome to this follow up blog on ETW. If you haven't read the first part I highly suggest you do because this will be a direct build up on the concepts introduced there. (Link below)
A Primer On Event Tracing For Windows (ETW)
Last time we talked about ETW and its different component. This time i thought i’ll take a look at some of the providers out there. With more than 1000+ providers available by default I started researching interesting events that can help us during detection and forensic investigations.
So let’s get started.
Note: Some of the telemetry mentioned here can be obtained via different providers, channels or methods. The point is to showcase some of the lesser known ETW providers or at least the not so common.
Microsoft-Windows-Kernel-Process
Process Creation
- EID: 1
- Channel: Microsoft-Windows-Kernel-Process/Analytic
- Description: Capture process creation
Here is an example showing “explorer.exe” spawning “cmd.exe” :
EID 1 — Process Creation
Thread Start
- EID: 3
- Channel: Microsoft-Windows-Kernel-Process/Analytic
- Description: Capture thread start in a process
Here is an example showing “cmd.exe” starting a thread:
EID 3 — Thread Start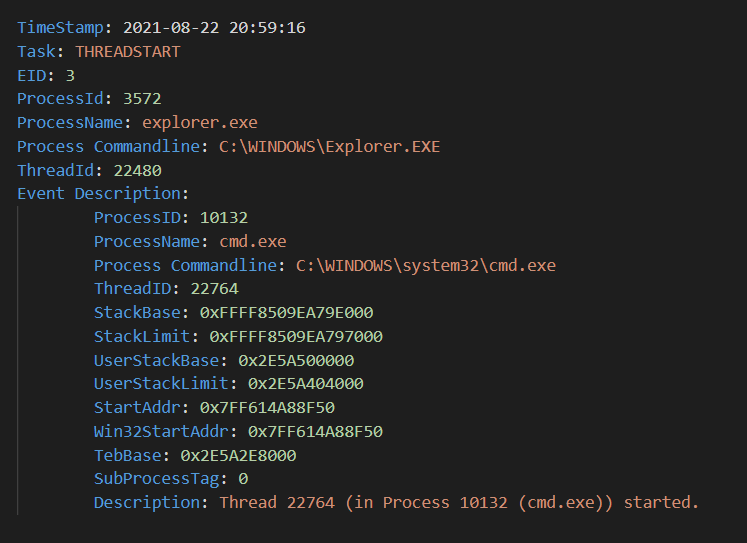
Image Load
- EID: 5
- Channel: Microsoft-Windows-Kernel-Process/Analytic
- Description: Capture when an Image is being loaded into a process
Here is an example of “conhost.exe” loading “ntdll.dll” :
EID 5 — Image Load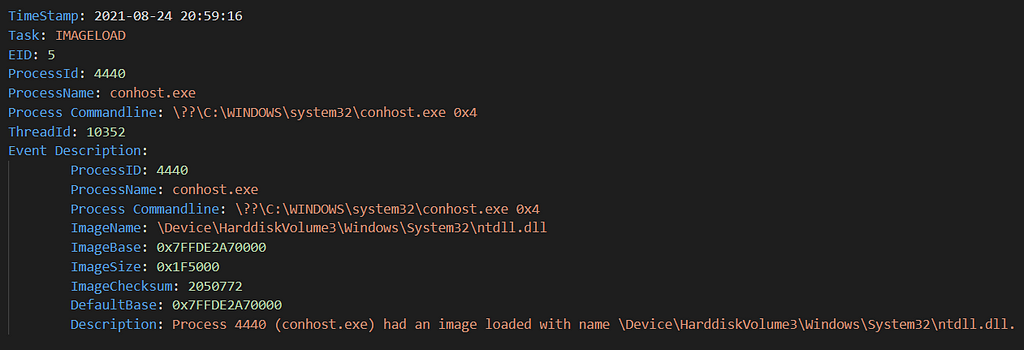
Other interesting events generated by this provider are :
- EID 2 — Process termination (Stop)
- EID 6 — Image unload
Microsoft-Windows-Kernel-File
File Creation
- EID: 10 / 30
- Channel: Microsoft-Windows-Kernel-File/Analytic
- Description: Capture file creation event
Here is an example showing “svchost.exe” creating a prefetch file for when i executed “python.exe”:
EID 30 — File Creation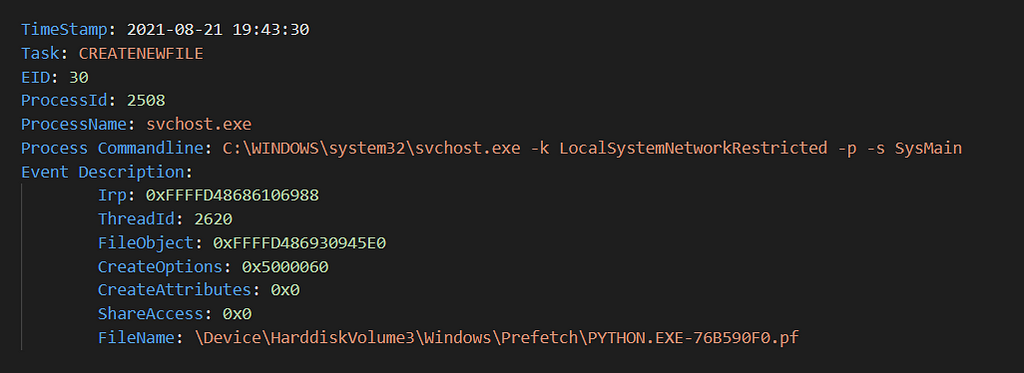
File Deletion
- EID: 11
- Channel: Microsoft-Windows-Kernel-File/Analytic
- Description: Capture file deletion
Here is an example showing the deletion of the file “example.txt” using the “del” command for example :
EID 11 — File Deletion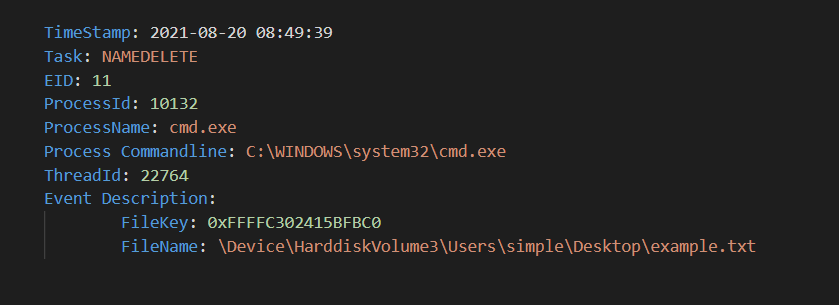
Similar to the “Kernel-Process” provider, other interesting events exists that i suggest you check out.
Microsoft-Windows-Kernel-Network
Attempted Connection
- EID: 12
- Channel: Microsoft-Windows-Kernel-Network/Analytic
- Description: Capture attempts of initial connection to an IP
Here is an example showing “chrome.exe” attempting to connect to my python server on port “4444”:
EID 12 — Attempted Connection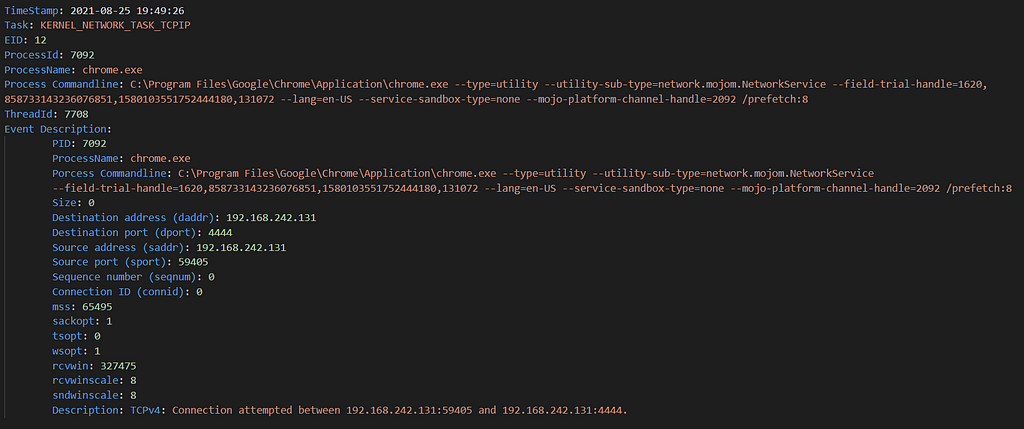
Established Connection
- EID: 15
- Channel: Microsoft-Windows-Kernel-Network/Analytic
Here is an example showing that the previous connection has been established :
EID 15 — Connection established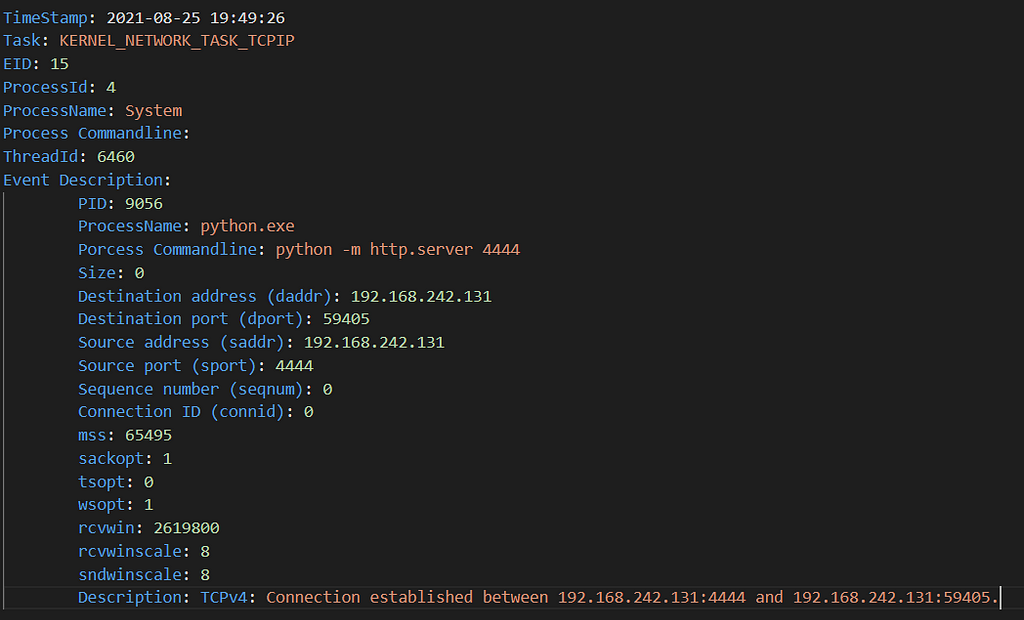
N° of Bytes Transmitted / Received
- EID: 10 and 11
- Channel: Microsoft-Windows-Kernel-Network/Analytic
These events capture the number of bytes transmitted and received to and from a server. Can be helpful to determine if data has been exfiltrated. Here is an example :
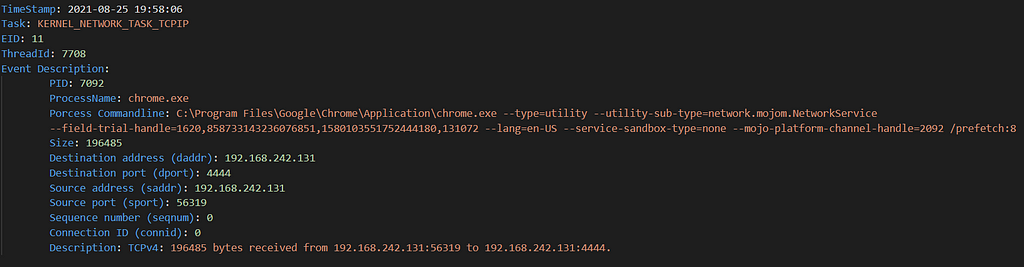
These events capture TCPv4 data. This provider also captures events for TCPv6, UDPv4 and UDPv6.
Microsoft-Windows-Kernel-Registry
This provider contains a lot of useful events from on action performed on the registry such as:
- CreateKey (EID 1)
- OpenKey (EID 2)
- DeleteKey (EID 3)
- QueryKey (EID 4)
- SetValueKey (EID 5)
- DeleteValueKey (EID 6)
- QueryValueKey (EID 7)
- EnumerateKey (EID 8)
- EnumerateValueKey (EID 9)
These events are straightforward and simple to understand. They are all available also in the “Microsoft-Windows-Kernel-Registry/Analytic” channel.
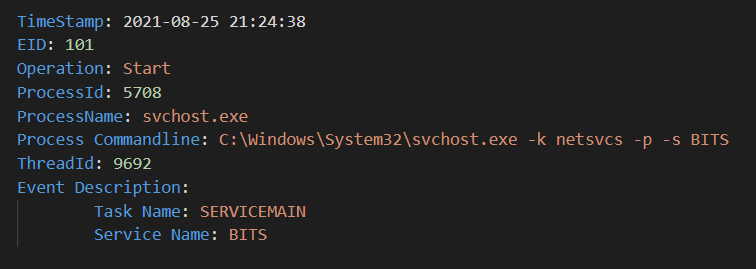
Microsoft-Windows-Services-Svchost
This provider is straight forward has only two events that indicates when an svchost process started and stopped
Svchost Process Start
- EID: 101
- Channel: Microsoft-Windows-Services-Svchost/Diagnostic
Svchost Process Stop
- EID: 102
- Channel: Microsoft-Windows-Services-Svchost/Diagnostic
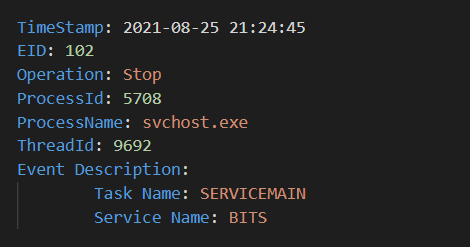 EID 102 — SVCHOST STOP
Microsoft-Windows-LDAP-Client
LDAP Search
- EID: 30
- Channel: Microsoft-Windows-LDAP-Client/Debug
- Description: Captures ldap search query from different LDAP cleints.
Below is an example of queries performed from the client “ldapbrowser.exe” :
EID 30 — LDAP Search
If we used a similar client such as the MMC console “Active Directory Users and Computers” snap-in we obtain the same result. In theory since the events are handled by the “wldap32.dll” dll. Every process that loads this and should generates these events.
Microsoft-Windows-COMRuntime
COM Interface Usage / Call
- EID: 2
- Channel: Microsoft-Windows-COMRuntime/Tracing
Here is an example of an event generated by this provider
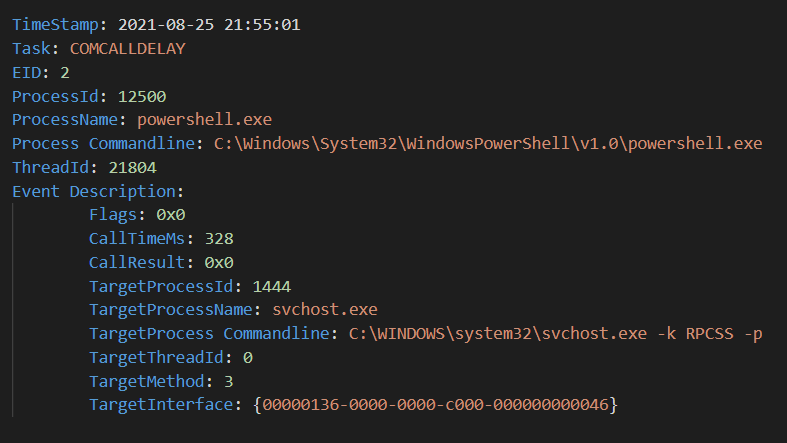
We can see the target method and interface use that can help us for example to find DCOM lateral movement attempts.
Microsoft-Windows-Winlogon
This provider contains some interesting events. I talk about some that are present in the “operational” channel in a previous blog but there are some other available only on the “Microsoft-Windows-Winlogon/Diagnostic” channel. Such as :
- “Fail” and “Successful” attempts to “Lock” or “Unlock” a computer
- “Successful” or “Failed” logon
Here is an example showing a sequence of “Lock” and “Unlock”
TimeStamp: 2021-08-25 22:27:10
EID: 6113
Operation: LOCK
ProcessId: 712
ProcessName: winlogon.exe
Process Commandline: winlogon.exe
ThreadId: 460
Event Description: LOCK Started
--------------------------------------------------------------------
TimeStamp: 2021-08-25 22:27:15
EID: 6105
Operation: UNLOCK
ProcessId: 712
ProcessName: winlogon.exe
Process Commandline: winlogon.exe
ThreadId: 460
Event Description: UNLOCK Started
--------------------------------------------------------------------
TimeStamp: 2021-08-25 22:27:15
EID: 6107
Operation: UNLOCK
ProcessId: 712
ProcessName: winlogon.exe
Process Commandline: winlogon.exe
ThreadId: 460
Event Description: UNLOCK Failed (Reason : 1326)
--------------------------------------------------------------------
TimeStamp: 2021-08-25 22:27:17
EID: 6105
Operation: UNLOCK
ProcessId: 712
ProcessName: winlogon.exe
Process Commandline: winlogon.exe
ThreadId: 460
Event Description: UNLOCK Started
--------------------------------------------------------------------
TimeStamp: 2021-08-25 22:27:17
EID: 6106
Operation: UNLOCK
ProcessId: 712
ProcessName: winlogon.exe
Process Commandline: winlogon.exe
ThreadId: 460
Event Description: UNLOCK Successful (Reason : 0)
Microsoft-Windows-TerminalServices-ClientActiveXCore
This provider export some events through the “Microsoft-Windows-TerminalServices-RDPClient” event log “operational” channel and some through the “analytic” channel. One of the interesting events provided are both
- EID 1001
- EID 1102
That indicates when a user initiate an RDP connection from his machine. So for example using “mstsc.exe” to connect to a server we get the following event :
EID 1102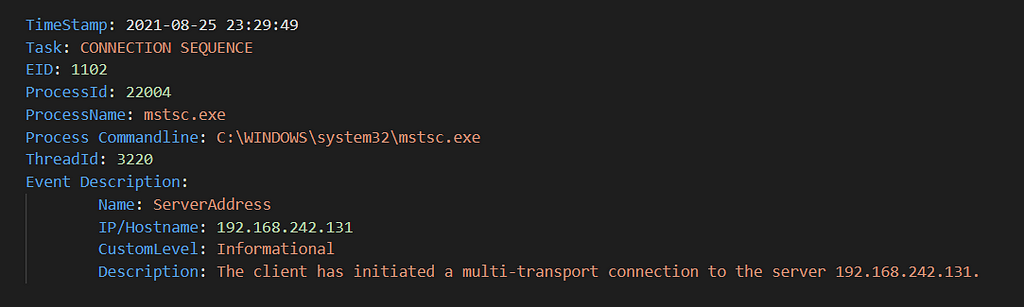
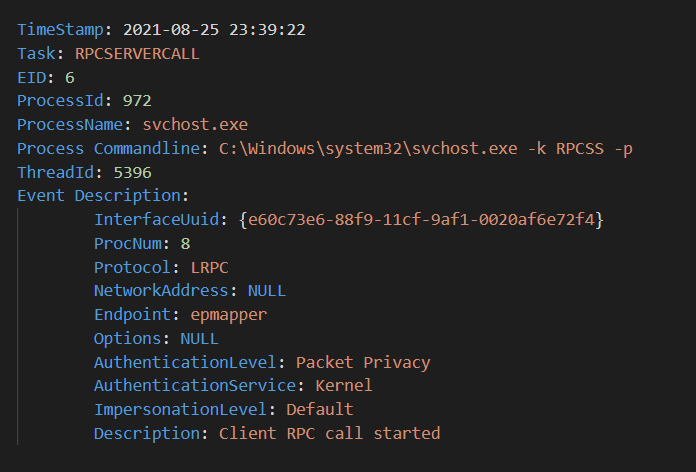
Microsoft-Windows-RPC
With this provider we can capture RPC Server/Client Calls as shown in the images below
Server RPC Call Start
- EID: 5
- Channel: Debug
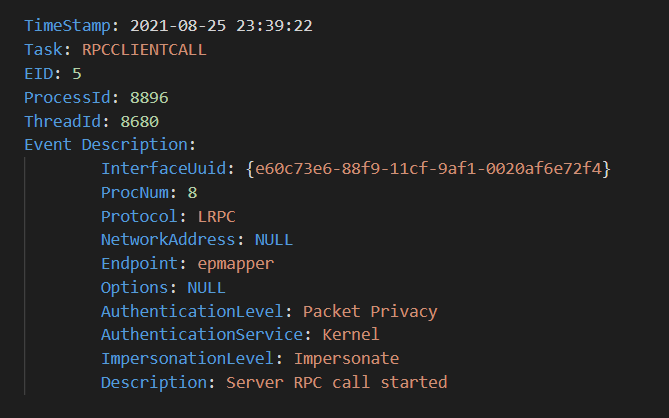 EID 5
EID 5Client RPC Call Start
- EID: 6
- Channel: Debug
Conclusion
This conclude our quick tour in ETW provider land. I just showcased some of the events i found interesting and there many more out there to find.
All of the events mentioned here were captured using python “pywintrace” library. All of the scripts used and more are available in the github repository.
GitHub - nasbench/ETW-Resources: Event Tracing For Windows (ETW) Resources
Thanks for reading and I hope you got something out of this. If you have any questions or remarks send them my way on twitter @nas_bench
Article Link: Finding Detection and Forensic Goodness In ETW Providers | by Nasreddine Bencherchali | Aug, 2021 | Medium