The future is now; Binary Ninja 3.3 (Arrakis) is available. You may have noticed that we’ve renamed our milestones based on an alphabetical list of famous Sci-Fi/Fantasy planets, and the first release in this theme is named after the famous desert planet from Dune - Arrakis. The bytes must flow!
So what spicy goodies are in this release?
- Decompiler Improvements
- Debugger
- Type Interactions
- More Windows Improvements
- Enterprise Improvements
- Many More
Major Changes
Even though this was a shorter release timeline with a big holiday break in the middle, we still managed a huge list of features for this release. In only 2.5 months we have (we dare-say) released a bigger set of new features and fixes than other tools might get in a year! It’s quite the mix of fixes, usability improvements, and new features.
Decompiler Improvements
Our first three major improvements all serve to improve our decompilation output.
Parameter Rejection
If you’ve ever noticed an incorrect number of arguments or return values from a function call in Binary Ninja, the root cause is that the heuristic that tried to guess them wasn’t correct. Of course, if you have accurate type information you can always improve the result by specifying the proper parameters and their types, but with this new improvement, that often won’t be required. Consider the following two examples.
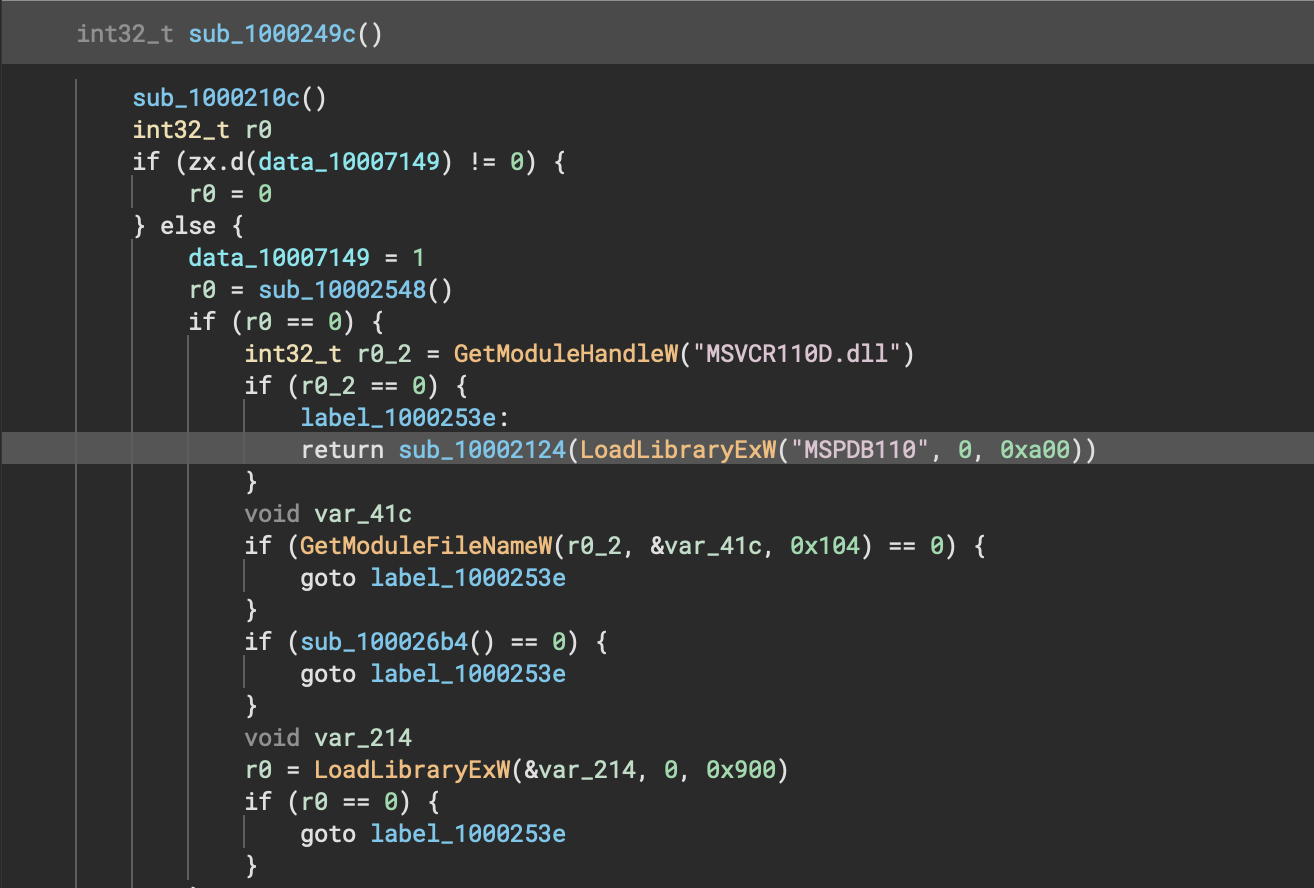
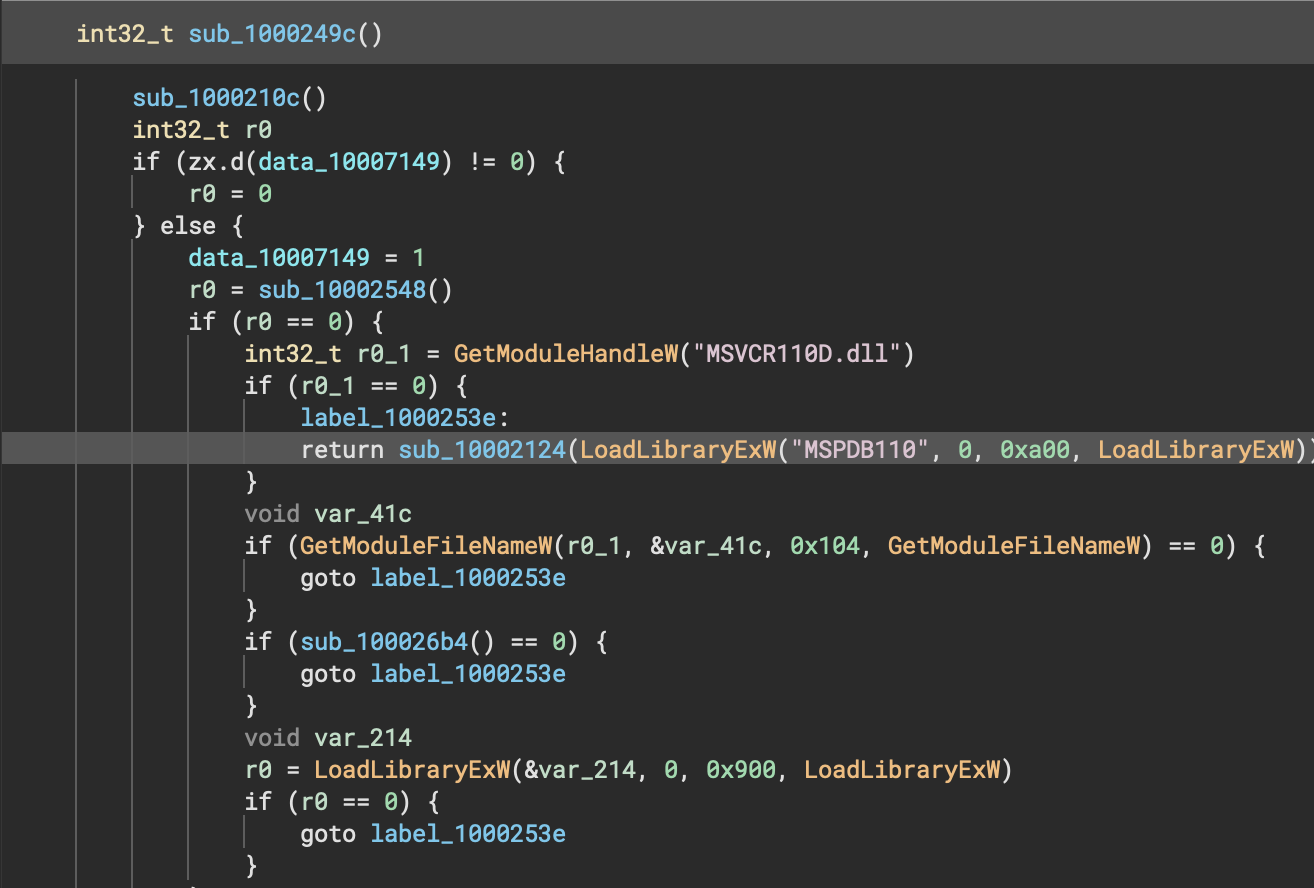
In the first, you can see how previously on some arm/thumb PE API calls, the function itself was erroneously showing up as an argument but no longer does in 3.3.
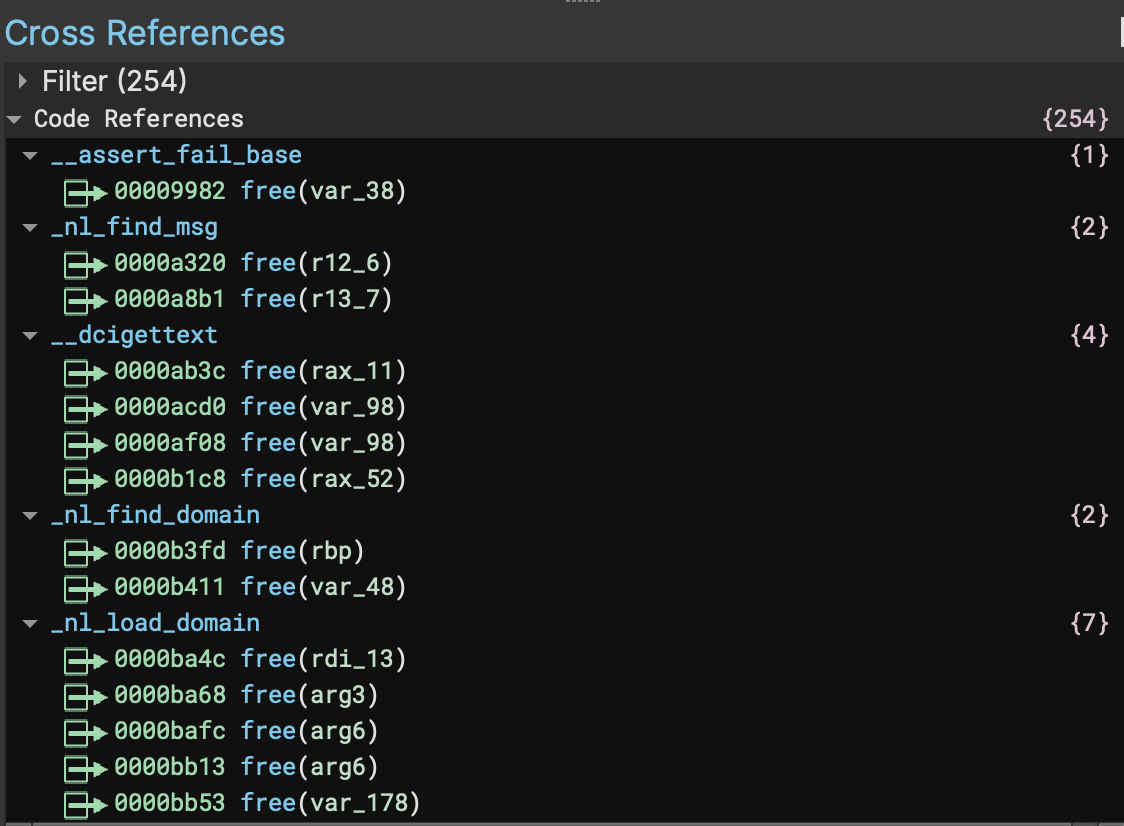
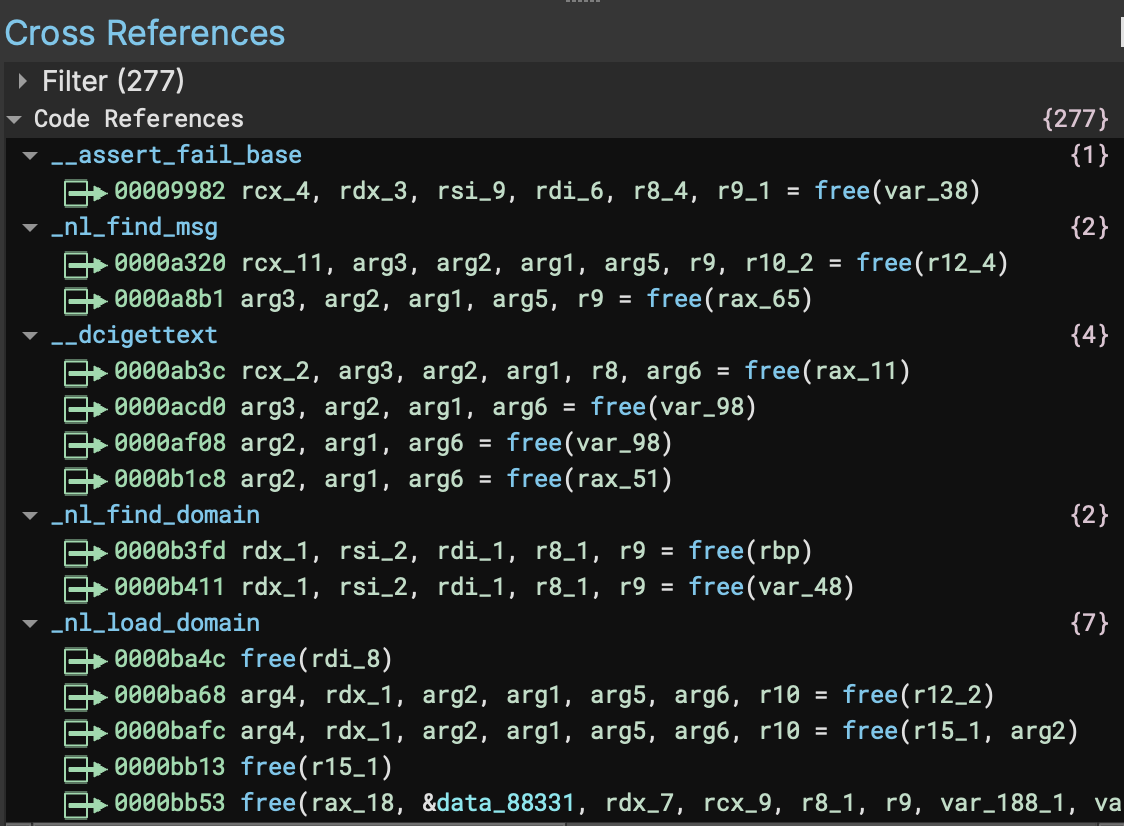
In the second example we can see on this x64 Linux ELF that the locations where free is called now show the correct arguments, and no longer show erroneous return values (for a void function!). One of the important features in this improvement is that in instances where the heuristic analysis has to guess parameters it is far less likely to override an existing function type.
Improved Objective-C
Our first-class Objective-C support might have landed in the last release, but we’ve seen a number of major improvements since then.
Apple loves to constantly iterate on the Mach-O format since they implement all of the CPU, compiler, and tool-chain, so maintaining support for the latest platform requires us to keep chasing an ever-moving target. Two important features have been added for 3.3: support for chained fixups and proper handling of instance variables (ivars). First, “chained fixups” allow dynamically linked libraries to have chains of fixups that encode an offset plus an offset to the next fixup. The difference made by adding support is obvious on binaries that use this format:
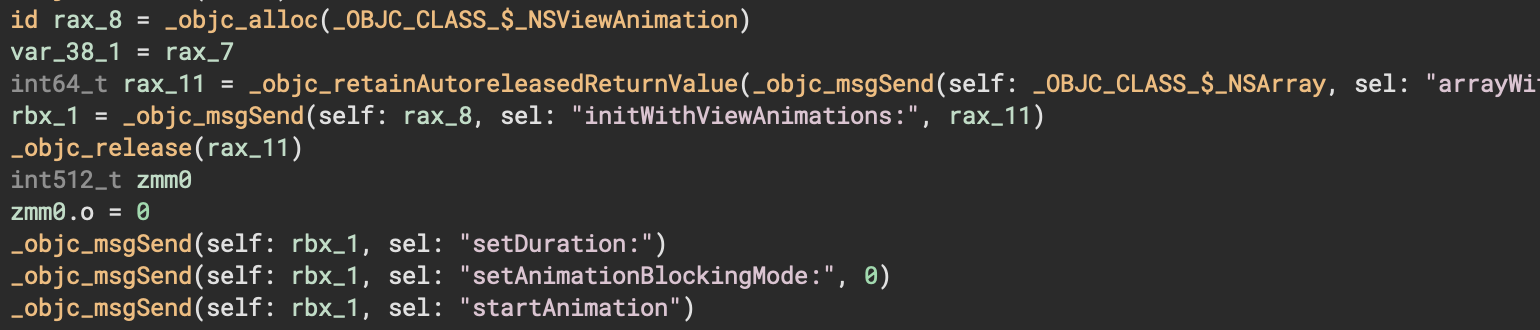
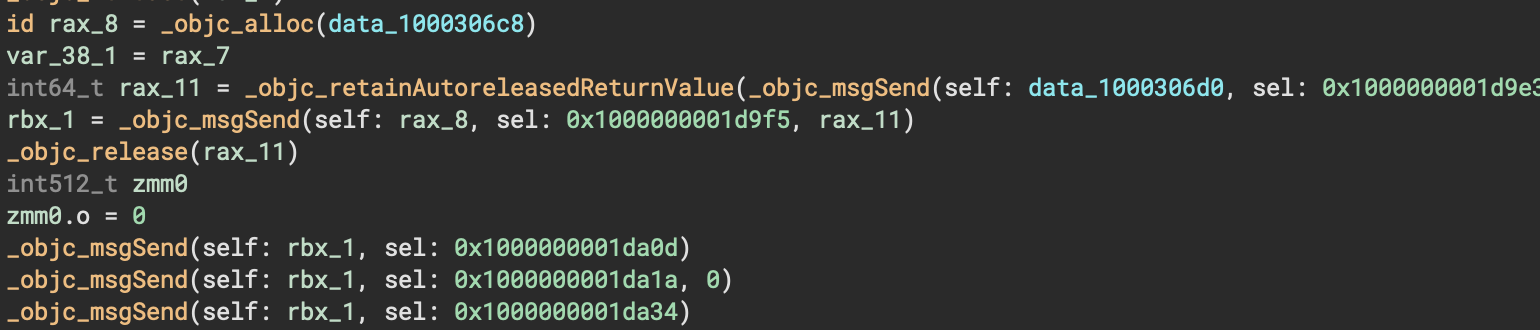
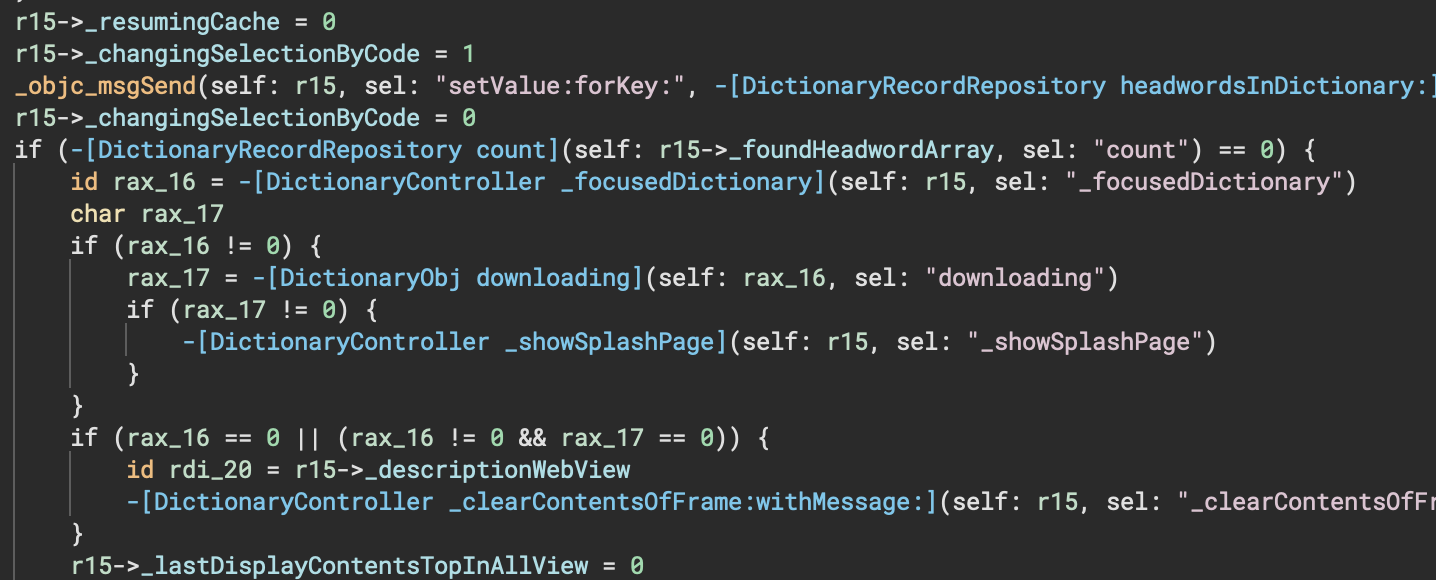
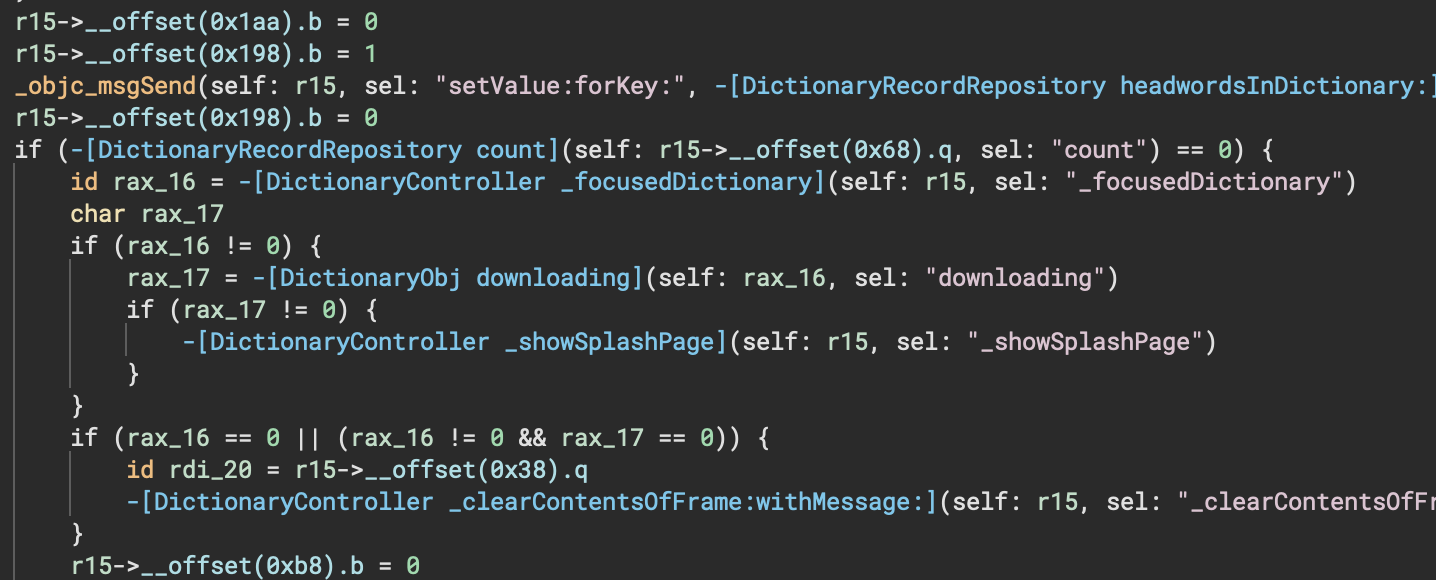
The second addition to our Objective-C support is the proper handling of instance variables (ivars). This is mostly noticed when extracting type information for extracted structures:
And of course these aren’t the only changes! Check out the full commit history on the open-source Objective-C plugin for even more details about what else has improved.
Automatic Outlining
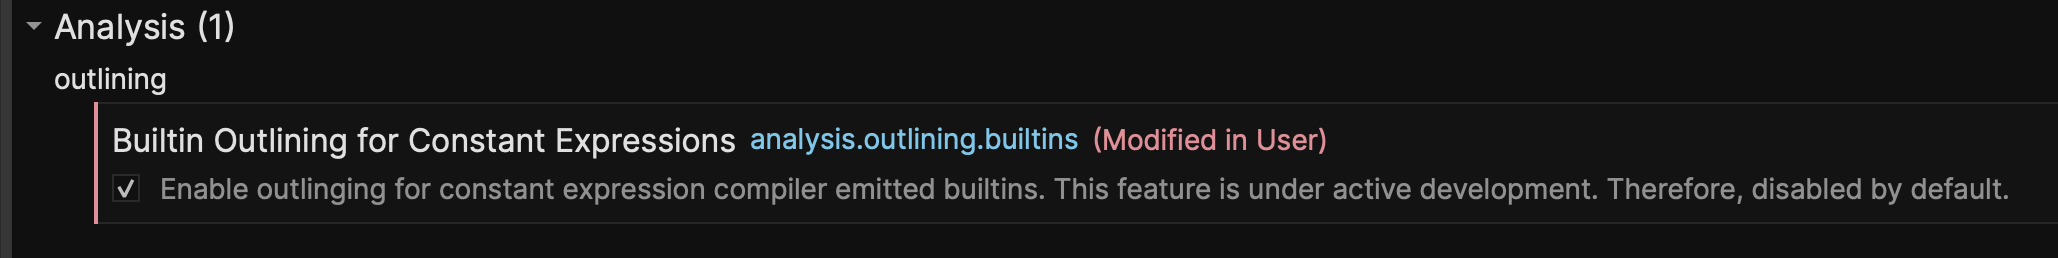
The actual full title for this feature is: Automatic Un-inlining/Outlining of Compiler Builtin Functions – and even that was hotly contested internally! Whatever the name though, the feature is a major improvement to our overall decompilation and rendering of functions where common functions like memset, memcpy, and strcpy are frequently inlined by a compiler. But to really understand it, let’s turn it on and show what it does.
As it is an experimental feature, outlining needs to be enabled via a setting:
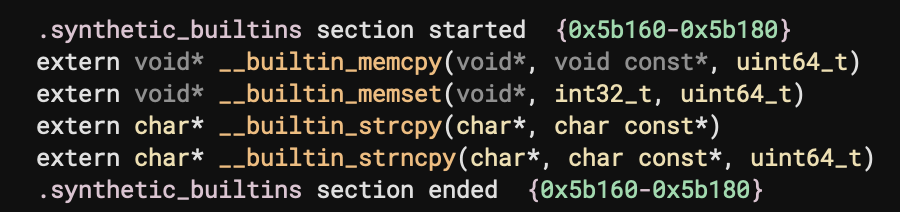
Once enabled, you’ll notice a new section called “synthetic built-ins” at the very bottom of linear view:
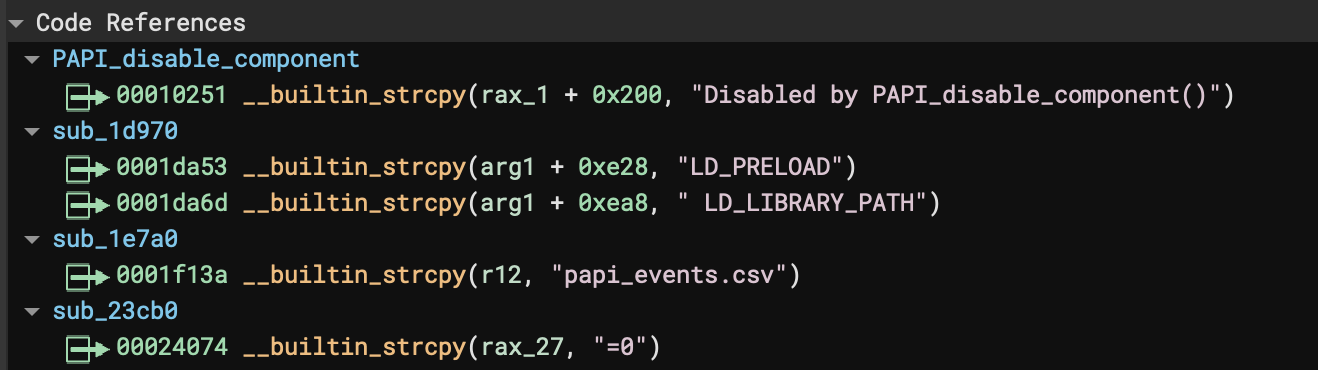
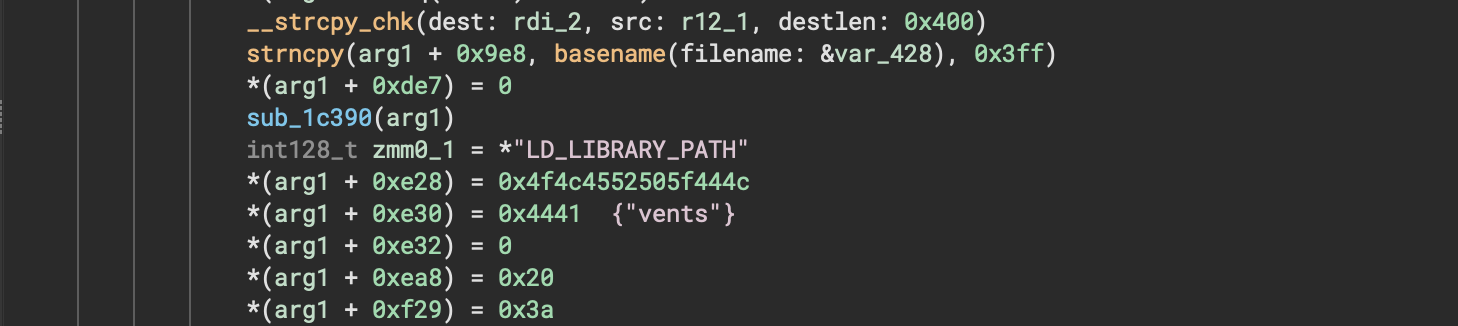
From there, just look for cross-references to those functions and you can see all the instances where the new feature was able to identify patterns that were replaced with these new synthetic functions for improved readability:
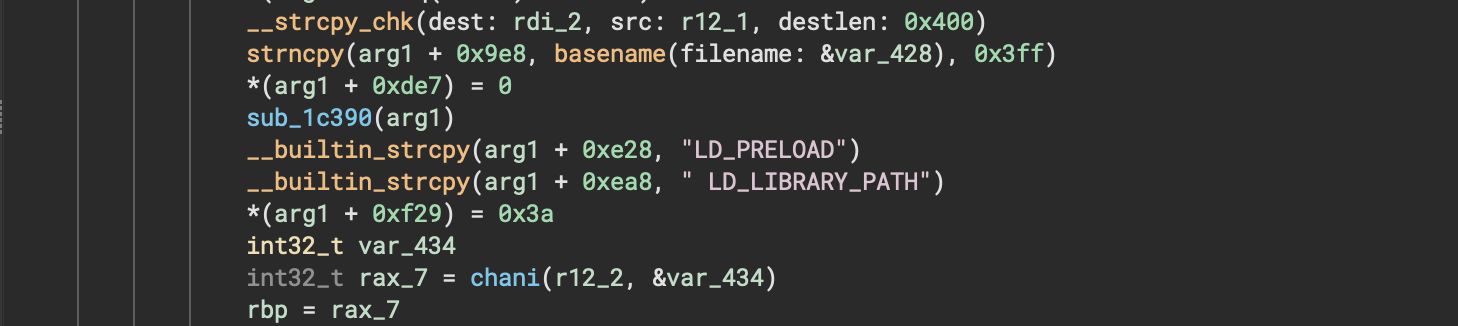
Here’s a quick comparison showing one of those regions of code before/after the setting was applied:
Debugger
The new debugger is now out of beta!
One of the biggest changes for this release is that we’re finally bringing our native debugger out of beta and into the stable product. This is a full replacement of the legacy debugger plugin we released over two and a half years ago. That older version was written in Python and had some significant limitations. Our new debugger has been entirely re-written in C++ and supports local and remote debugging on our three major platforms (Windows, macOS, and Linux).
A full table of what we support today is below:
| Target ↓ Host → | macOS | Linux | Windows |
|---|---|---|---|
| macOS | Yes (Local/Remote) | Yes (Remote) | Yes (Remote) |
| Linux | Yes (Remote) | Yes (Local/Remote) | Yes (Remote) |
| Windows | Planned | Planned | Yes (Local/Remote) |
| GDB Server* | Limited | Limited | Limited |
| LLDB Server | Yes | Yes | Yes |
| Windows Kernel | TBD | TBD | Planned |
| DebugAdapter Protocol | Planned | Planned | Planned |
* Right now, we only support gdbserver with Android remote debugging. Support for other GDB-compatible servers or stubs (e.g. VMware, QEMU, qiling, etc.) will be added in the future.
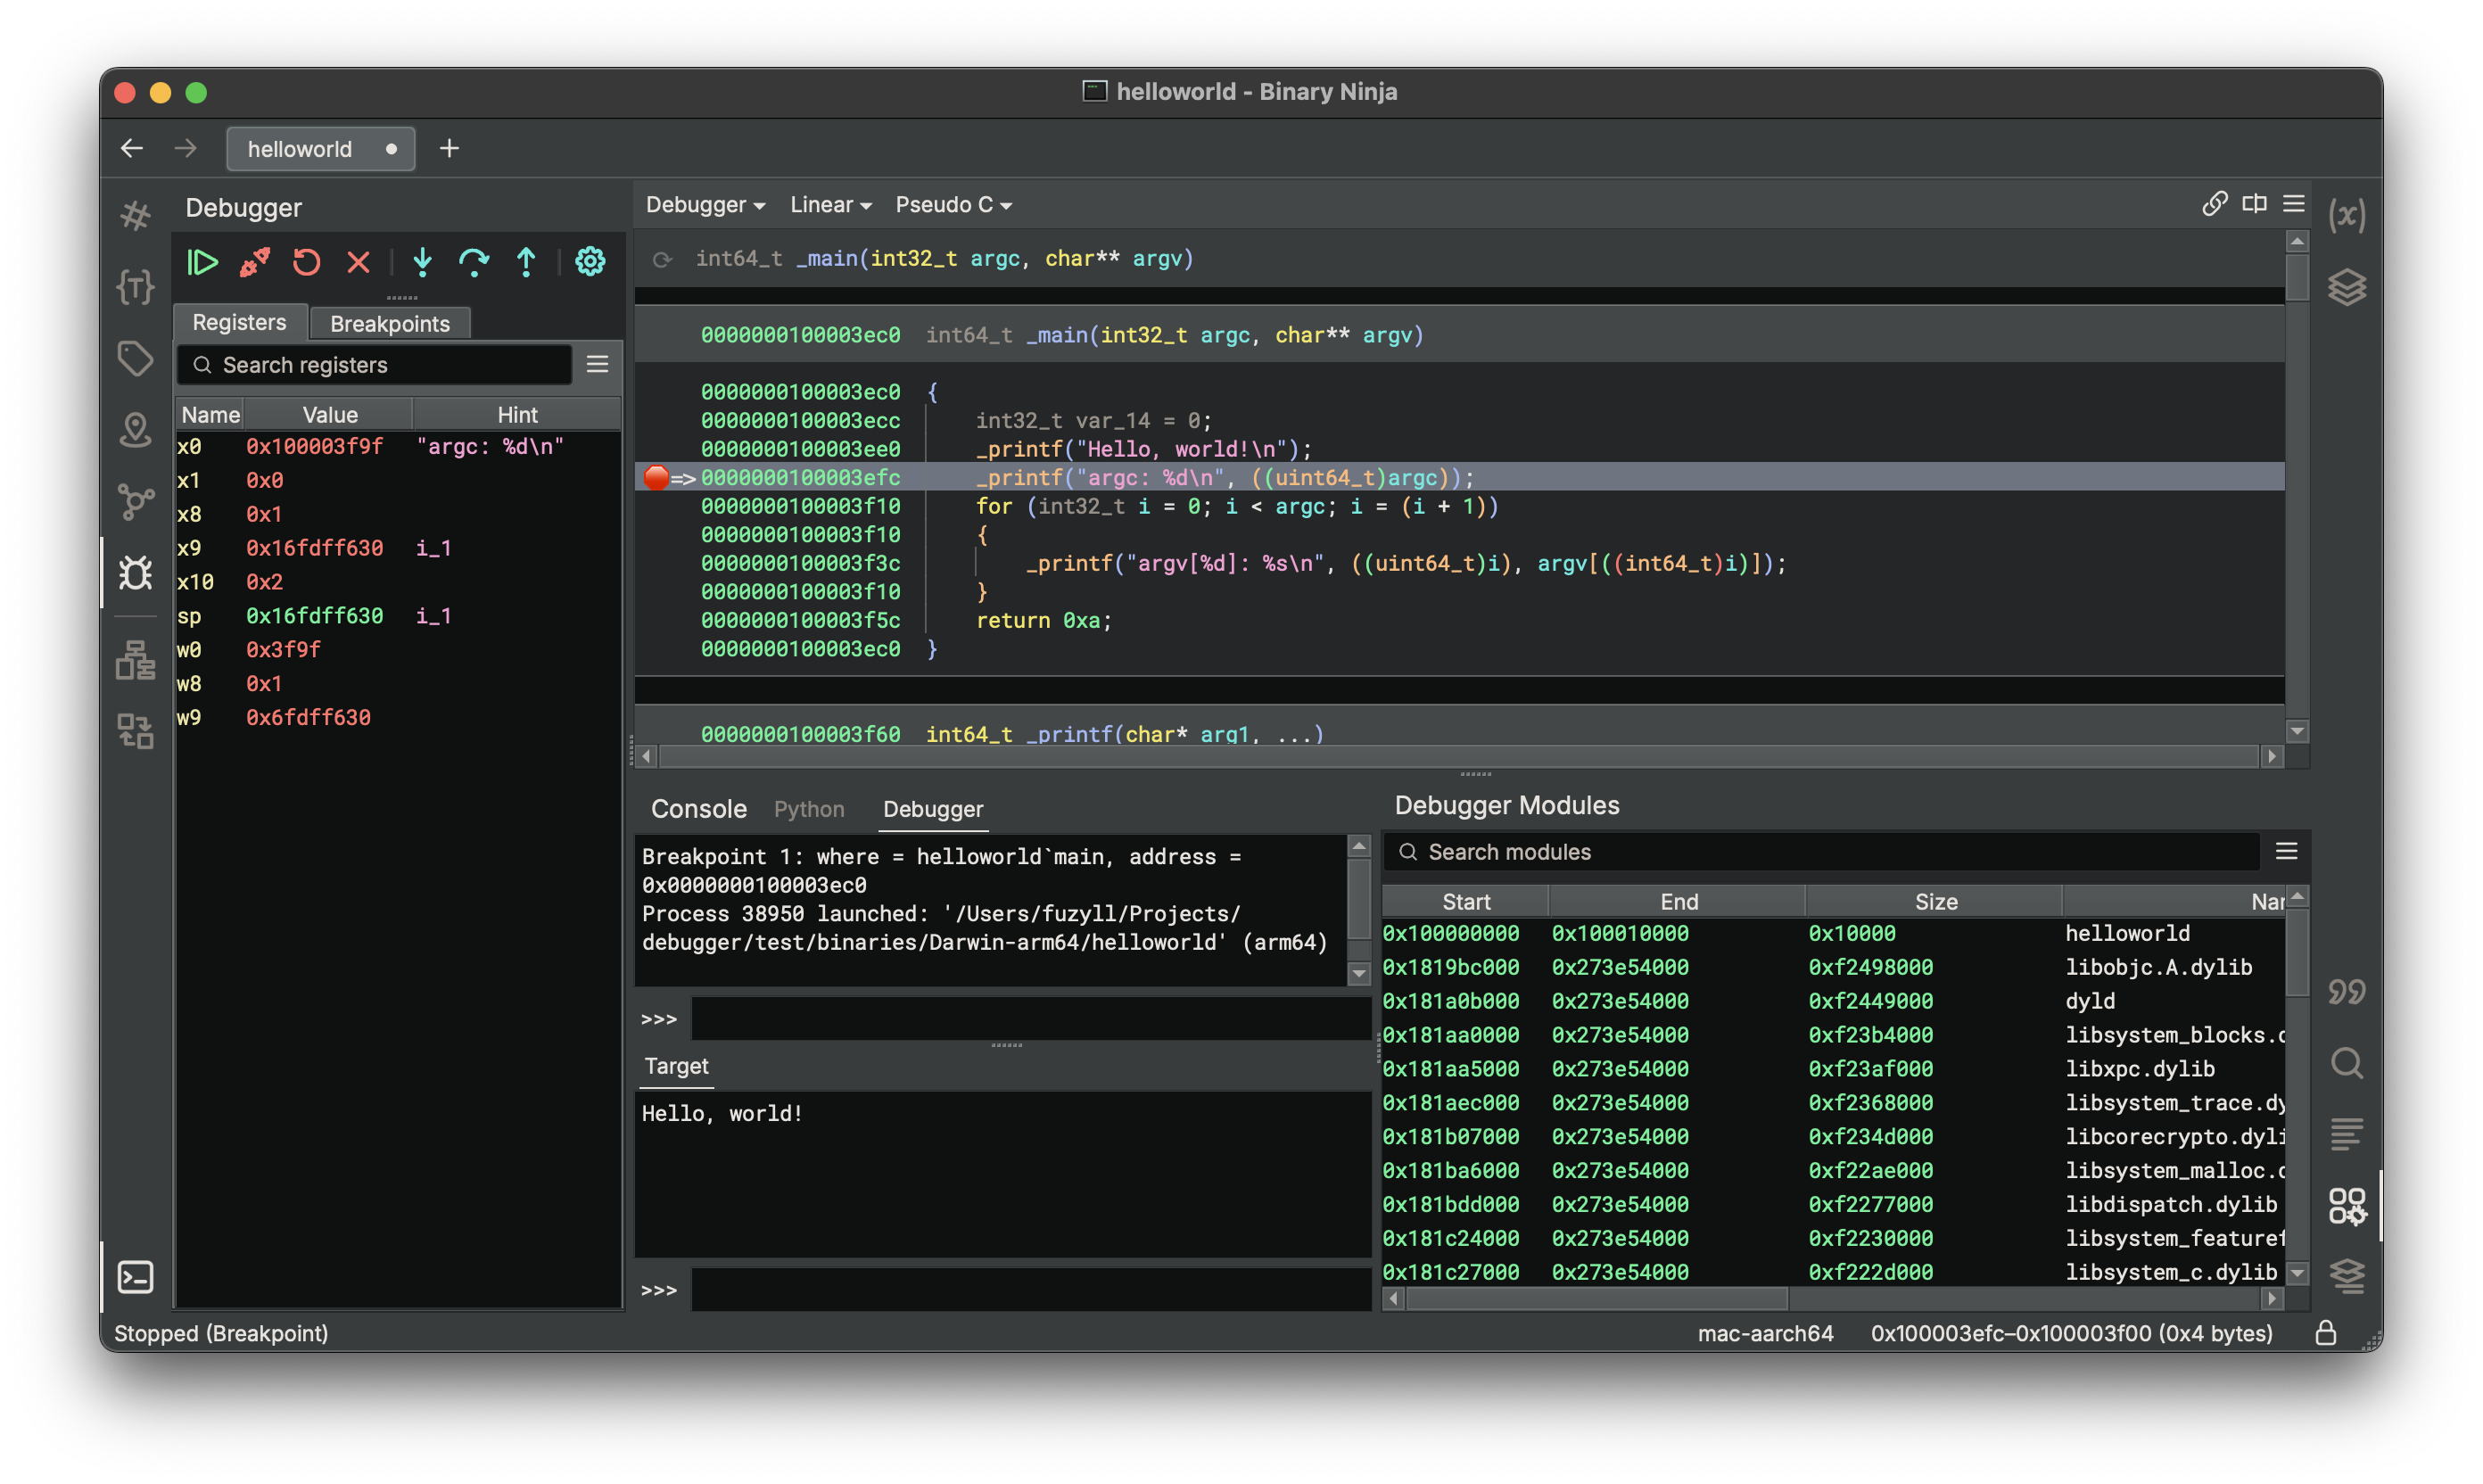
Go check out the full documentation for much more detail about the debugger, but here’s a quick overview of some of the highlights:
- All the typical execution control UI elements
- Register window showing hints of strings or pointers when they’re stored in registers (support for symbols and variables forthcoming!)
- Breakpoint view for managing existing breakpoints or adding new ones
- Modules view showing the address, size, name, and path information of the target’s modules
- Integrated target terminal for interacting with the application being debugged
- Integrated debugging console that supports native back-end commands (LLDB or WinDbg syntax depending on the OS)
- Stack trace view that can also switch between threads
- Stack variable annotation that enables viewing variables in the linear view with ease
- Comprehensive Python/C++ API that allows automation of debugging tasks
Building a cross-platform debugger is hard, and there will inevitably still be some features that are a little rough-around-the-edges despite our testing. So we suggest you save a copy of your database before starting debugging. In case you do run into something unexpected, here is a list of known issues and workarounds and a troubleshooting guide.
The good news is that this debugger, just like our previous plugin, is open source (under an Apache 2.0 license)! We welcome any and all issue reports or pull requests as the debugger continues to be under active development. (It’s worth noting how many external pull request contributions we’ve received for the debugger!)
Type Interactions
A number of the biggest features in this release are all related to making it easier to apply, import, export, and generally work with types.
Create Array Dialog
We’ve always had great hotkeys for creating array types. For example, select a region of memory, hit 1 (or other sizes), then * would create an array of all of those chars:
![]()
But what if you wanted to do something more complicated? If you don’t have a hokey to set the item type, it wasn’t trivial and required using y to manually set the array member type and count.
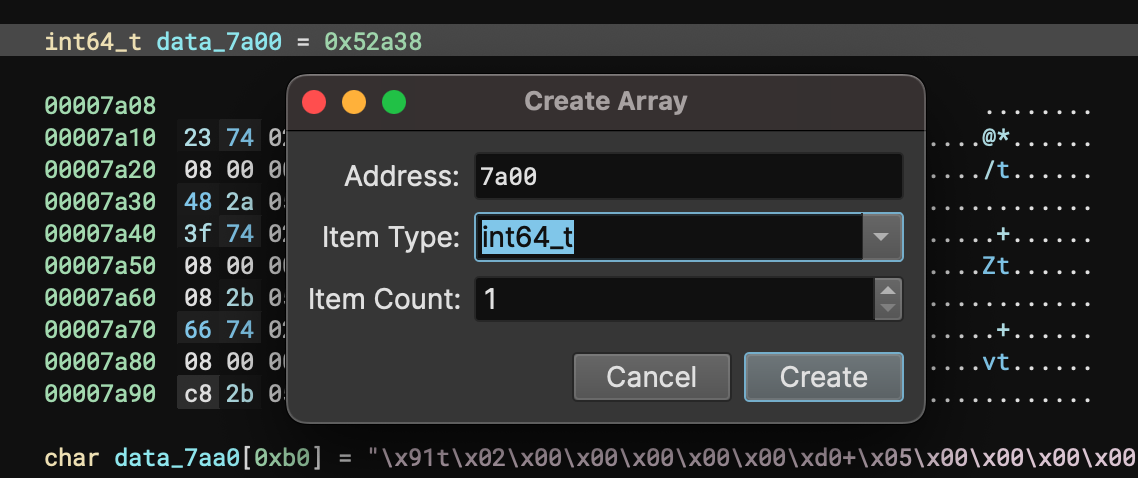
So we’ve extended the * hotkey to make it more versatile. Now you can use it without any selection and it will allow you to extend the variable at the current offset into an array with an arbitrary number of elements. Future iterations will more intelligently predict counts based on nearby objects, sections, and segments.
Import / Export Header Files
Defaulting to the clang type parser in the last release enabled a ton of improvements to type parsing and, of course, one of the first features that was requested was for better import and export of header files - now it’s here!
Export is fairly self-explanatory. Either use the command palette to trigger the “Export Header File” action, or use the entry under the “Analysis” menu. You’ll be prompted to select the location to save the (C compiler parsable!) header. More details are available in the user documentation.
//------------------------------------------------------------------------------ // Types for /Users/user/sample // // This header file generated by Binary Ninja Enterprise Client 3.3.3995-dev Enterprise //------------------------------------------------------------------------------#ifndef BN_TYPE_PARSER
#include <stdint.h>
#include <stddef.h>
#include <stdlib.h>
#include <stdbool.h>
#include <wchar.h>#define __packed
#define __noreturn
#define __convention(name)
#define __syscall(number)
#define __offset(…)
#define __padding
#define __named(name)
typedef uint16_t wchar16;
typedef uint32_t wchar32;
#endif//------------------------------------------------------------------------------
// Forward Declarations of Structures
//------------------------------------------------------------------------------
struct Elf64_Dyn;
struct Elf64_Header;
struct Elf64_Ident;
Importing header files is slightly more complicated as you can specify a number of clang CLI parameters to control how the parsing happens. IMPORTANT: make sure to read the documentation which includes a great explanation of how to find the appropriate system header files to make it easier to import headers on a number of platforms.
Crucially, make sure to enable “Define Binary Ninja Macros” if importing from a header file that was previously exported from Binary Ninja.
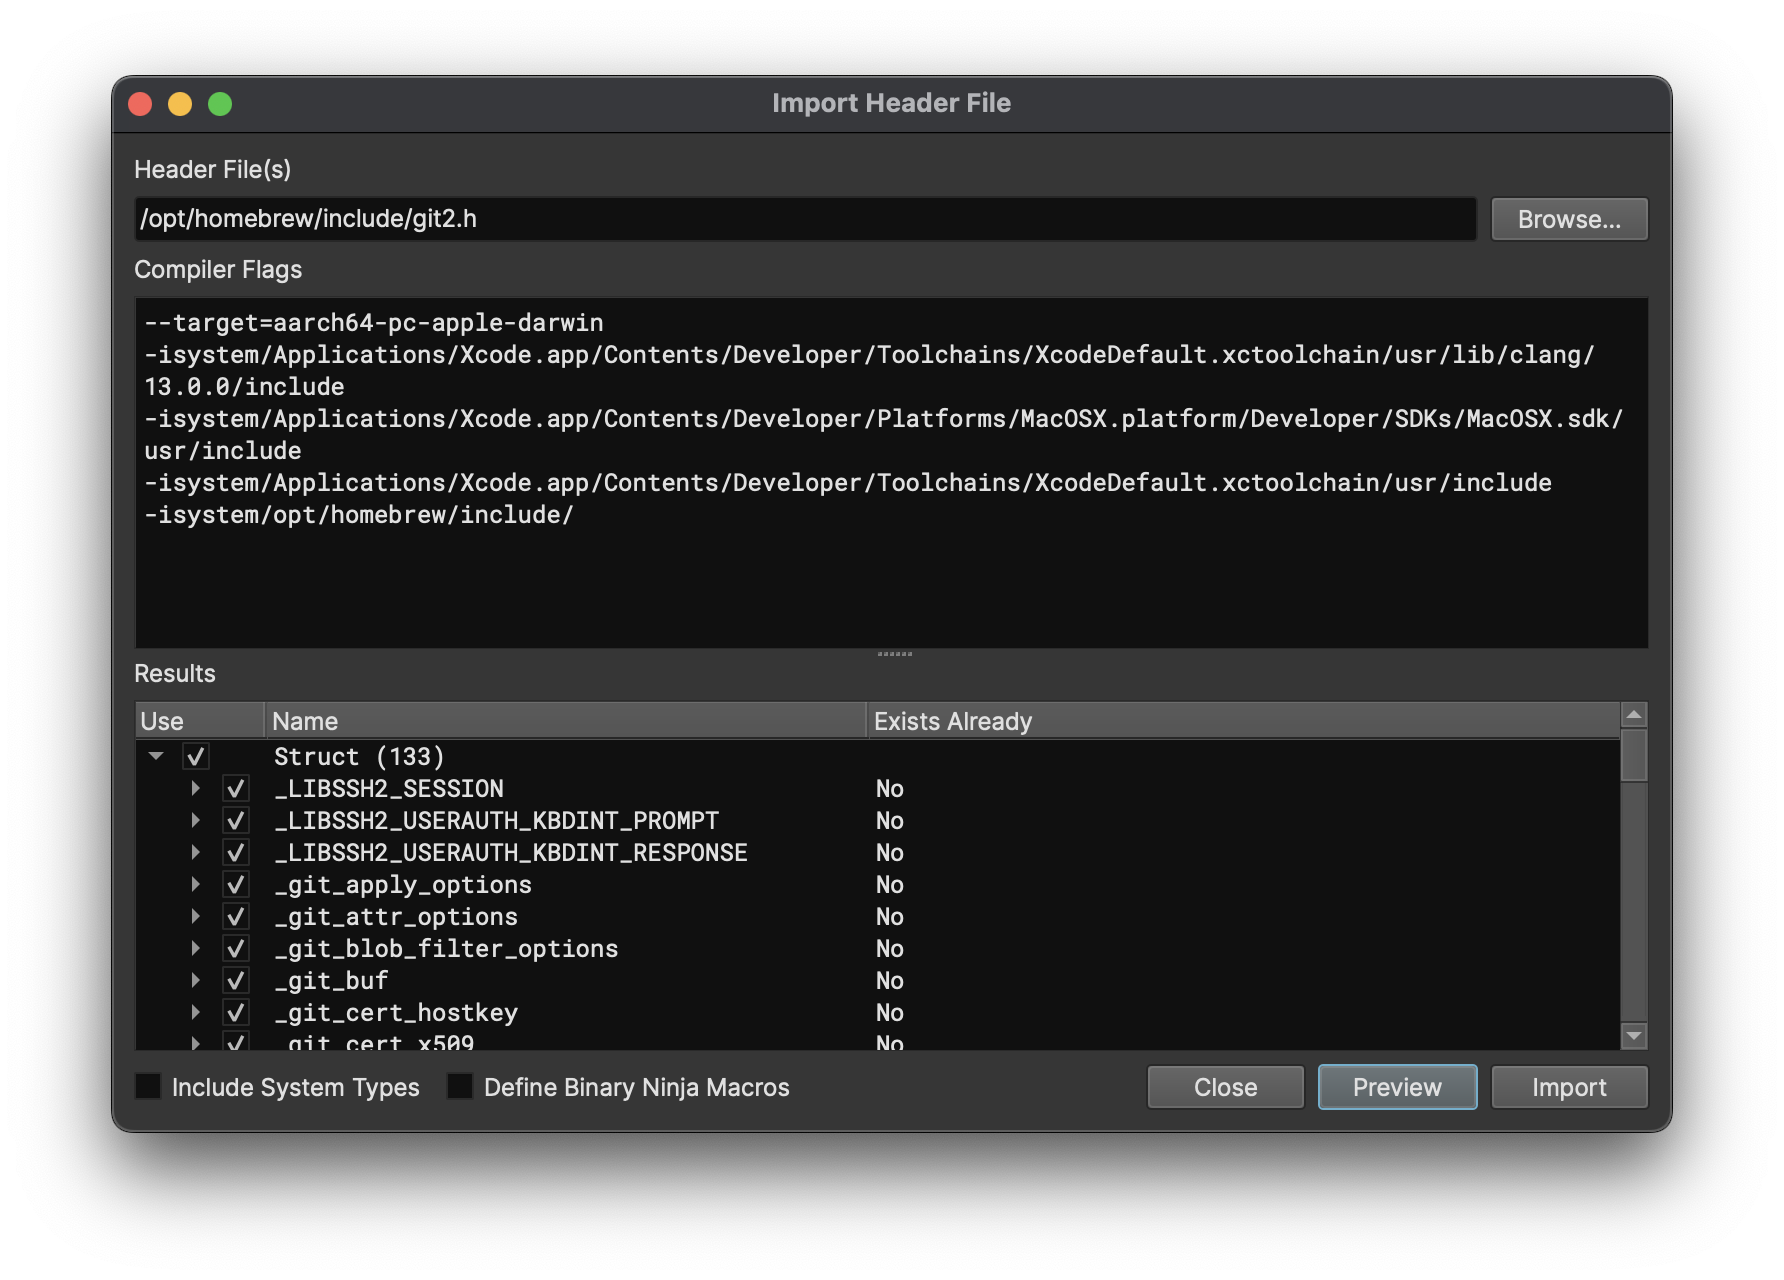
On clicking “Preview”, you’ll see a list of types that you can import from the header. By default, all types will be selected but in cases where you only want part of the file, this can be easier than pre-processing to remove unwanted types.
Enumeration Dialog
The previous stable included improved enumeration support but in our previous blog post we specifically mentioned that a dedicated UI to pick matching enumeration values and apply them was still needed. That dialog is now here and makes it vastly easier to automatically identify the appropriate enumeration to apply to a given use:
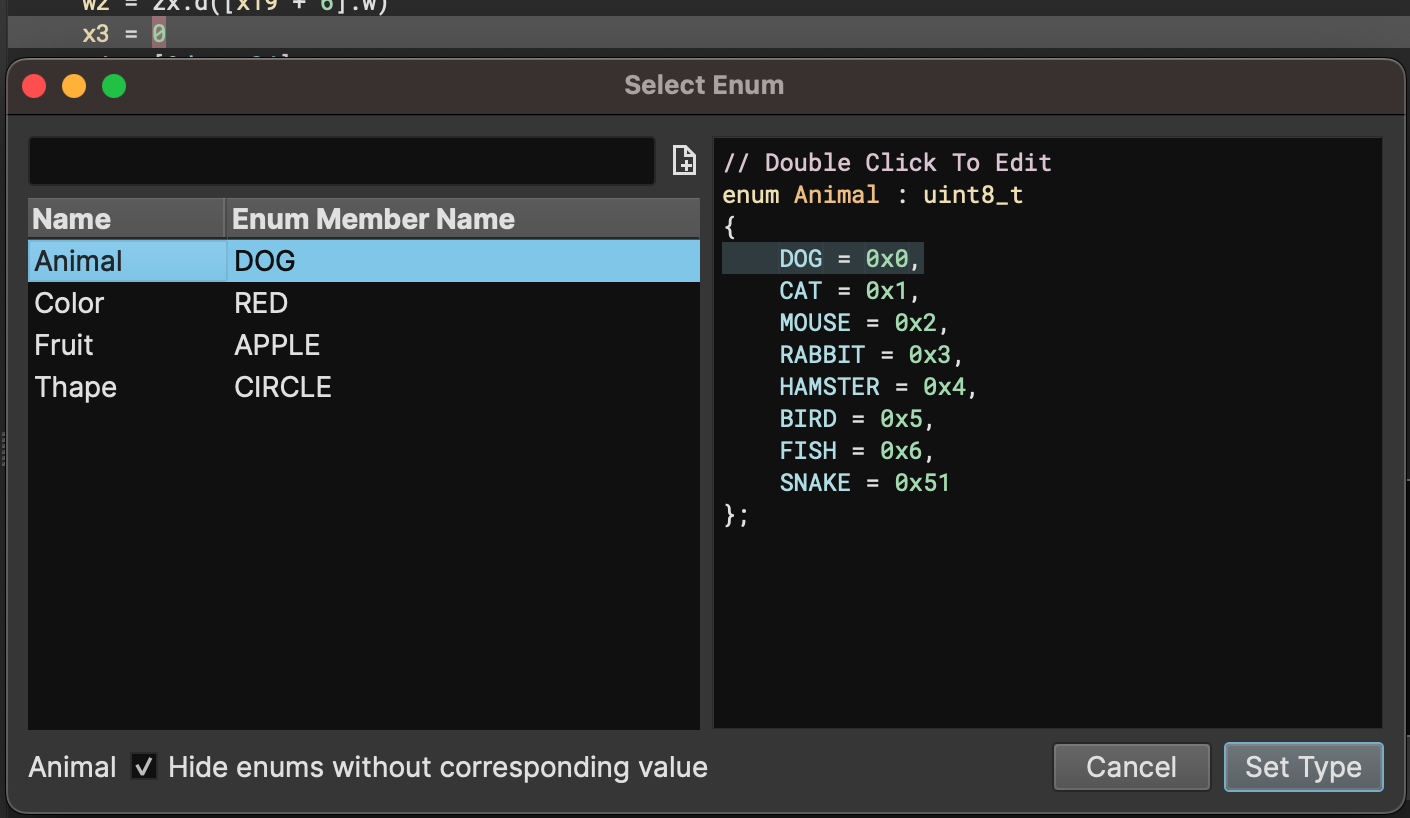
The new dialog can be opened using the m hotkey. In this example, you can see that 0 was selected in the decompilation before it was pressed. Several enums are shown matching, along with the matching member. Notice the checkbox in the bottom that allows you to select ANY enum, even those that don’t have a matching member, and you can even edit the values in the enum (by double-clicking in the text area on the right) or add a new enum (click the + icon to the right of the text filter box).
This feature should be extremely useful for applying enum types to unique constants, which will be a more common workflow as we continue to expand our type libraries with more enums.
As always, make sure to read the full documentation for more information.
More Windows Improvements
While we officially shipped most of our “Windows” related improvements in our last release, a few stragglers made it into this release to round out the melange of different improvements.
SEH Prolog/Epilog Inlining
First, let’s make it clear that this inlining is a powerful capability that can improve decompilation for many more situations beyond just SEH handling. So this isn’t really a Windows-specific improvement as much as it’s a powerful new capability that we’re applying by default to solve this one Windows-specific problem.
And to clarify, this is a distinct inlining feature from the workflow inliner which still serves as a useful example for how to implement workflows.
With that out of the way, let’s take a look at the improvement itself:
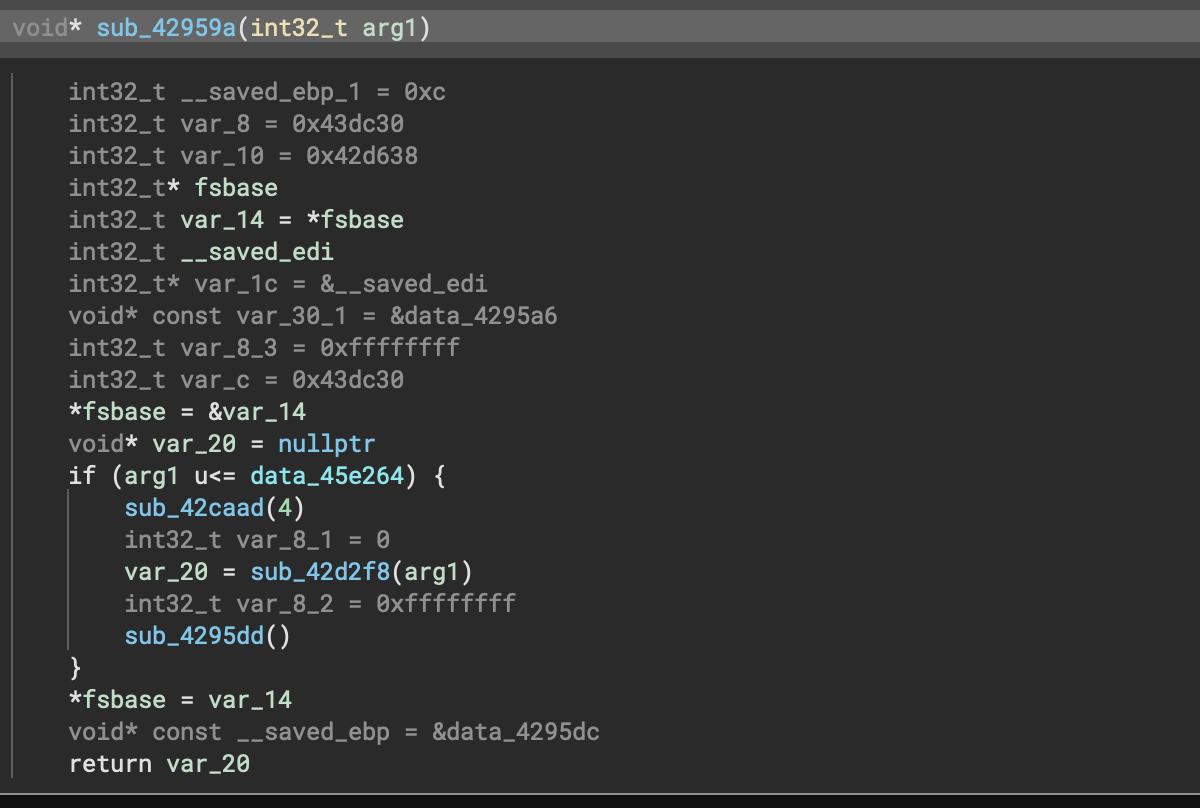
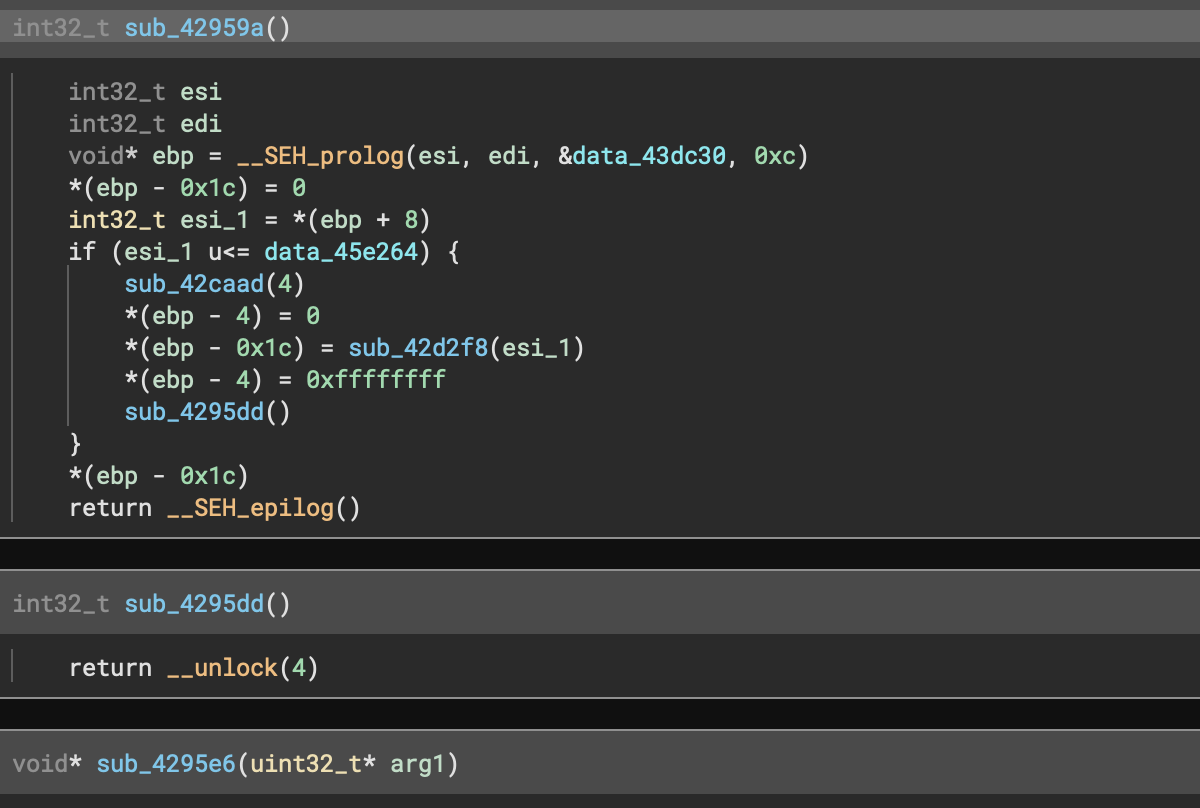
If you’ve used Binary Ninja before on Windows PE files, you’re certainly familiar with the __SEH_prolog and __SEH_epilog functions cluttering up your analysis. Even worse, stack variable tracking was misaligned from not understanding how those prolog/epilog functions were adjusting the stack. In fact, while the decompilation shows a number of extra variables in the after version, you’ll notice it’s correctly identifying the stack offset and creating variables as opposed to the dreaded ebp - ## which indicates the analysis has lost track of the stack pointer.
The new inlining feature allows the core analysis to automatically include the IL from those functions in the parent function, seamlessly fixing analysis.
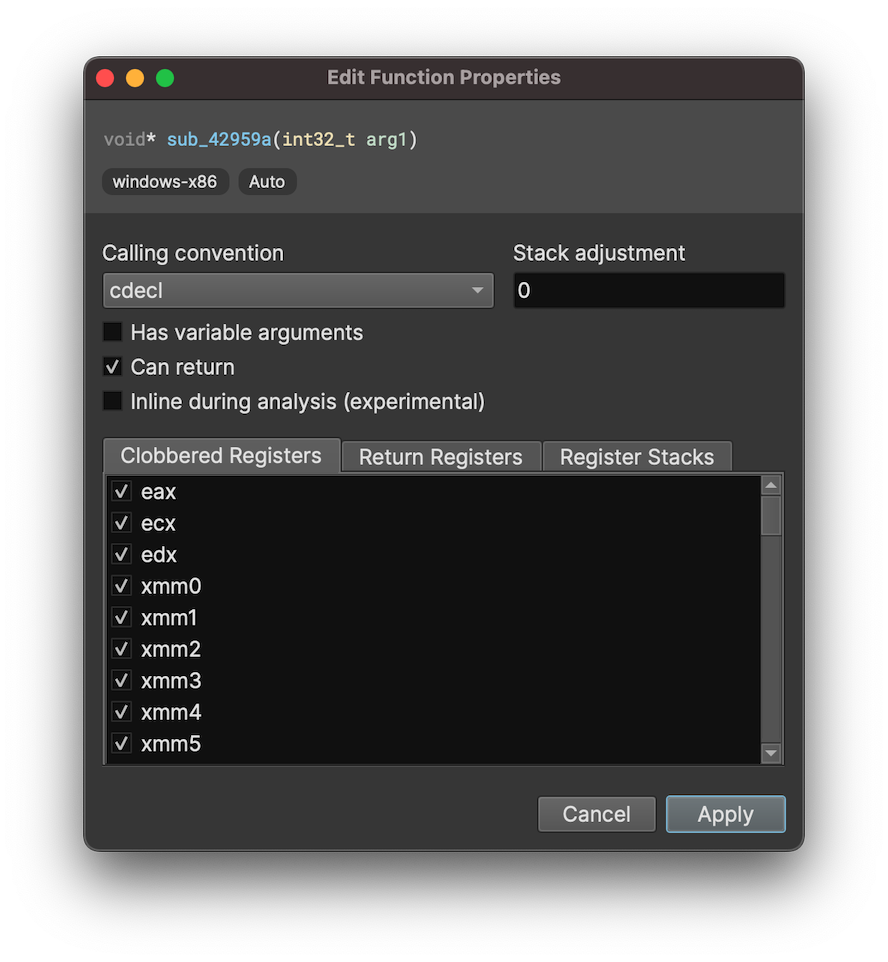
While that alone is a huge improvement, the underlying inlining feature can be used for much more! You can access it yourself by setting it via the edit function properties dialog.
This is a pretty major feature and so far it’s only been thoroughly tested in a limited number of cases such as these SEH epilogs/prologs. It may be labelled as experimental in the UI, but you must not fear (fear is the mind-killer) as we welcome any feedback for new uses you find for it.
Type Libraries and Signatures
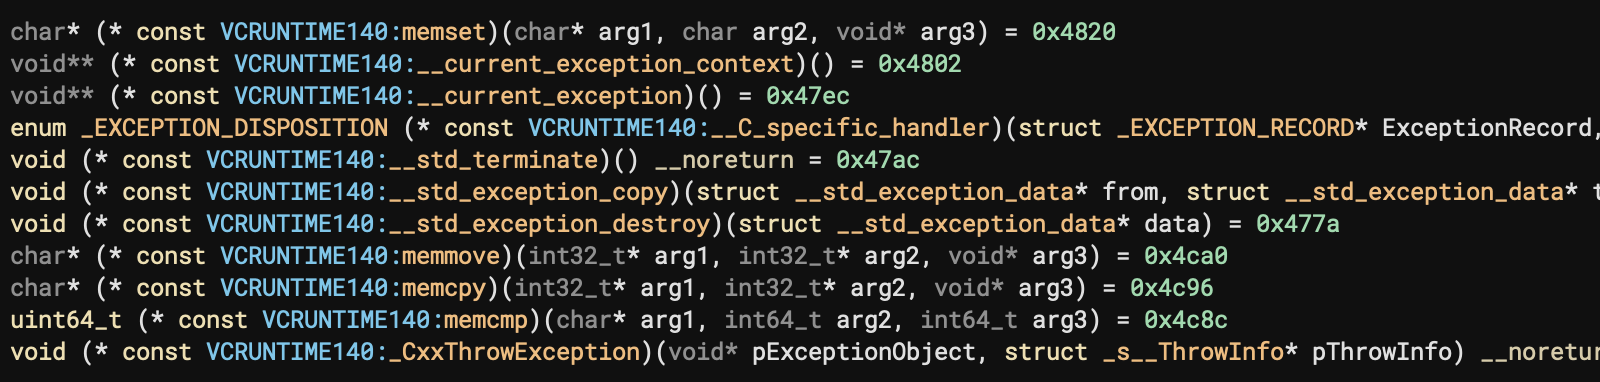
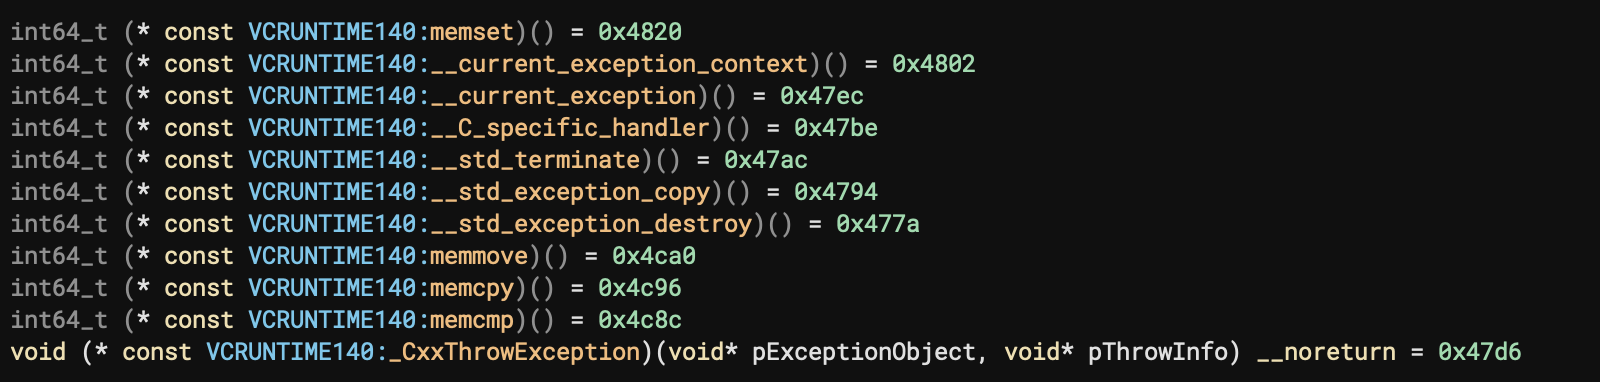
While we previously had the MSVC runtime, 3.3 brings ms libc signatures to round out our set of Windows type libraries.
For this release, we’ve added a number of missing libraries to improve our support for Windows. Specifically, we have additional 32-bit and 64-bit x86 libraries for:
- msvcp140
- msvcrt
- psapi
- ucrtbase
- vcruntime140
- winsock
- winspool
These type libraries mean applications and libraries that import those DLLs will now have much more accurate type information (as shown by the above comparison).
This release also includes UCRT signatures. As a reminder, signatures are used to match statically compiled libraries linked inside a binary, as opposed to type libraries which are for libraries imported or otherwise external to a given binary. There may be additional improvements to signatures for the Microsoft Universal CRT in the future as well, feedback is welcome.
Additionally, keep an eye out for improved documentation around creating your own type libraries and function signatures in future releases as we continue to make it easier and faster.
Enterprise Improvements
Most of our Enterprise development for this release went into things that aren’t immediately obvious to users: build and test infrastructure, plumbing for new things we’re planning in future releases, and fixes for stability and quality-of-life. So, our Enterprise feature list is a little short this time around. But it’s all been necessary to continue delivering the features we want going forward.
Named Snapshots
Our big feature this release is support for named snapshots. The collaboration workflow in Enterprise is basically the same as git: You make a bunch of changes, “commit” them to a snapshot (by saving the file), and then push those changes to the Enterprise server by clicking the sync button (rebasing or merging if there are incoming changes from someone else automatically). But this process had a big missing component: a description of your changes, and a way to view all of those changes.
Well, our named snapshot support changes things. It would be more accurate to say that these are named changesets, rather than snapshots, as multiple snapshots are named and pushed at once. But, regardless, here’s what clicking the sync button will now show you:
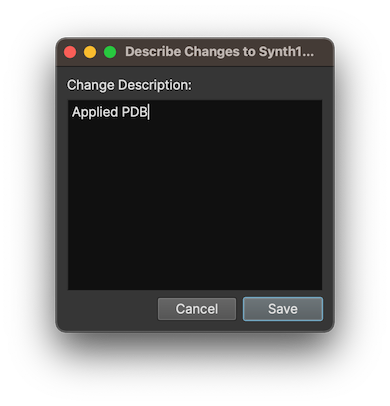
When you describe your changes and sync, that will identify your changeset with that description. You can view all of these changes later by going to File -> Collaboration -> File Changelog.... This will bring up the File Changelog:
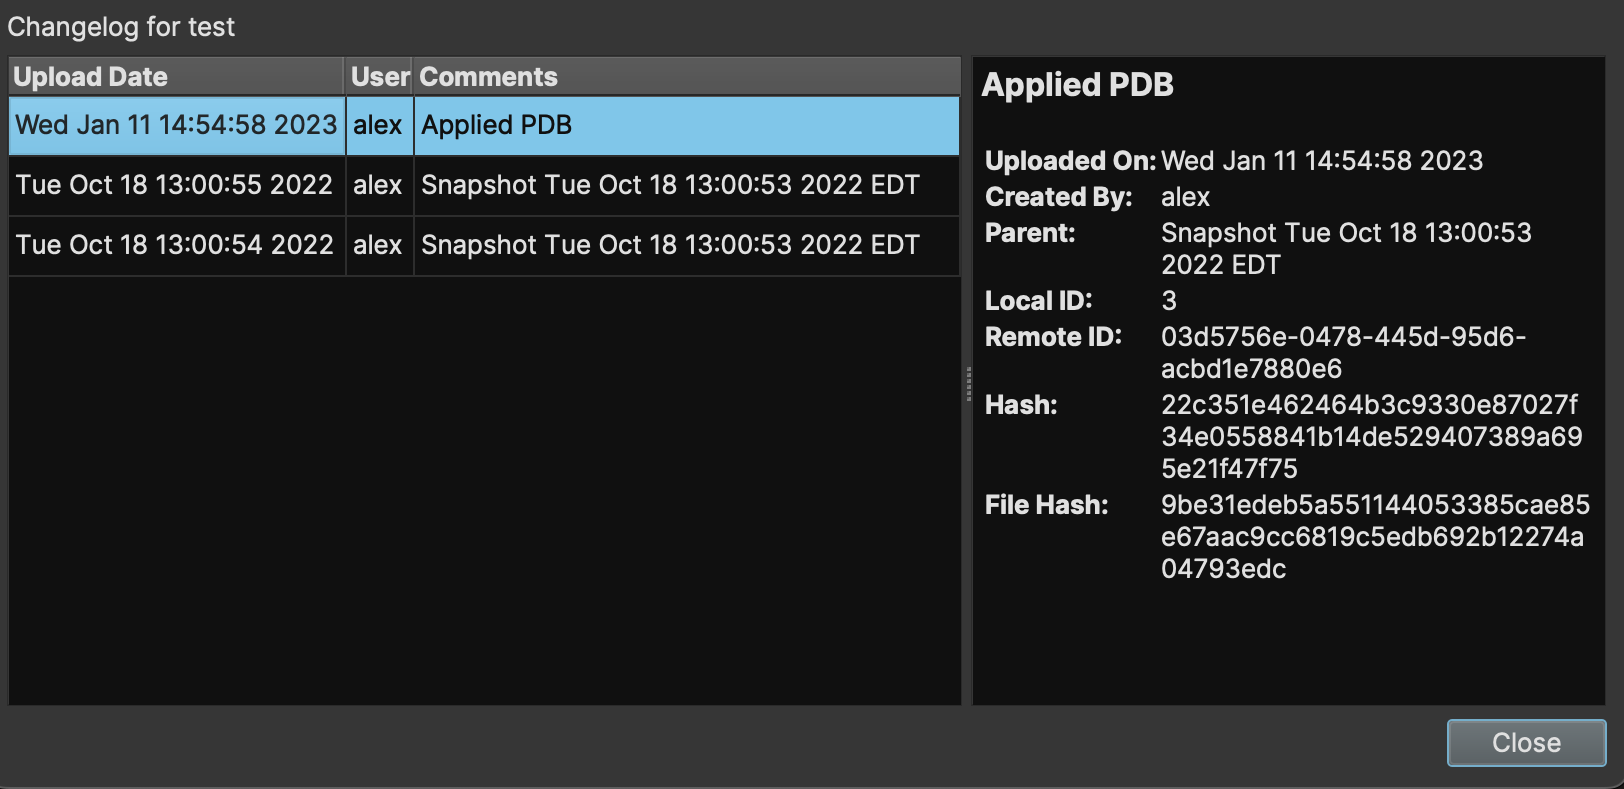
Here, you can see each changeset that was synced to the server for this file, who performed the sync, and what their comments were. Older entries that were made prior to this feature will simply have a generic timestamp as a description. More information is shown to the right, should you need it.
In the future, we plan on adding more functionality to the changelog (like being able to roll back to a previous snapshot). But, for now, this lets users provide context for their changes and view a simple history of all changes that have been made.
SAML Support
Another thing we added for this release is support for SAML2 as a single sign-on provider in the Enterprise server. This functionality is offered as a paid plugin for any customers that might need to add Enterprise to a larger enterprise network.
Other Updates
Community Contributions
Special thanks to op2786, WhatTheFuzz, Joe Rozner, and mkrasnitski, for your contributions to our open source components!
UI Updates
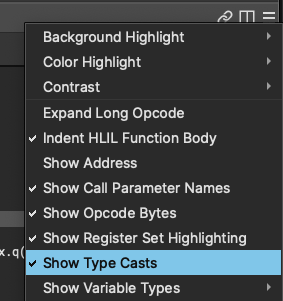
- Feature: Add setting to allow you to hide type casts
- Feature: Add ability to restore layouts and locations for all sync/no-sync groups
- Feature: Added sticky header on LinearView to ensure function’s header is always visible
- Improvement: Updated to Qt 6.4.1
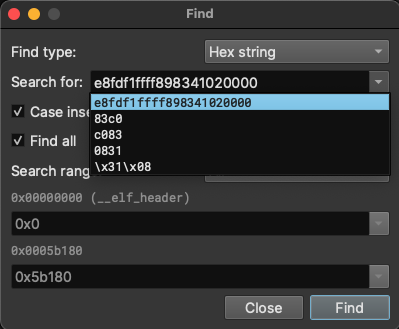
- Improvement: History for find dialog search queries
- Improvement: Analysis will now automatically start after cancelling an analysis hold
- Improvement: Hide unused tag types in the tag list
- Fix: Navigation from cross references in HLIL and related views
- Fix: UI Hang when attempting to display very large empty structures
- Fix: Occasional crash of UI due to Qt bug
- Fix: Occasional crashes from missing null check in various dialogs
- Fix: Occasional crash when resetting filter options from strings view
- Fix: Occasional crash when functions are removed
- Fix: Occasional crash when closing find or goto dialog
- Fix: Bug where pane would switch to the wrong view
-
Fix: Make TriageView update as analysis updates (exports, base address, etc.)
- Fix: COMBINE expression in Pseudo-C
- Fix: Crash when creating an array of void in LinearView
- Fix: Some cases were LinearView display became stale
- Fix: Escape characters are now shown in StringsView
- Fix: Issue where some symbols could be hidden after database save/restore
Binary View Improvements
- Improvement: Parse and handle Chained Fixup in Mach-Os
- Improvement: Add setting for max number of entries in ELF section header array
- Improvement: PE better parsing and DataVariable creation of various structures
- Fix: Macho Fix an issue with processing Chained Fixups in binaries with split segments
- Fix: Macho Fix an issue with processing of DYLD_CHAINED_PTR_ARM64E_KERNEL format fixups
- Fix: Macho Fix an issue with processing DYLD_CHAINED_PTR_START_NONE
Analysis
- Improvement: Greatly improved heuristics for detecting parameters of external function calls
- Improvement: Disjoint variable analysis (leads to better decompilation)
- Improvement: Automatically add function for resolvers stub in .plt sections
- Improvement: Dataflow for partial access of unsigned ranges
- Improvement: Dataflow for partial variable value overwrites
- Improvement: Dataflow support for offset partial value of signed ranges
- Improvement: Many other dataflow fixes and improvements
- Improvement: Function signature libraries for ucrt
- Improvement: Dataflow Add support for constant propagation through partially defined registers.
- Improvement: Add support for Virtual Thunks in the MS demangler
- Improvement: Add this pointer in some MS demangler cases
- Fix: Issue where some cross references in structures wouldn’t be populated
- Fix: Issue causing every function symbol imported through the DebugInfo API (PDBs in particular) to be marked as exported (GlobalSymbolBinding)
- Fix: Many bugs in creating of types by the PDB plugin
- Fix: Variadic function types created by the PDB plugin
- Fix: Some structure parameter locations in function created by the PDB plugin
- Fix: Handling of multiple symbols at the same address created by the PDB plugin
- Fix: Crash parsing empty string
- Fix: Crash in tailcall analysis when a block has no source block
API
- New API: TypeLibrary APIs for C++
-
New API:
MetadataChoiceDialogclass -
New API:
BinaryView::GetDependencySortedTypes -
New API:
TypePrinter::PrintAllTypes -
New API:
Type::IsVolatile -
New API: MLIL/HLIL
replace_expr -
New API:
Function.inline_during_analysis -
New API:
Snapshot::SetName -
New API:
EnterpriseServer::IsFloatingLicense -
Improvement: Add support for comparison operators in
parse_expression -
Improvement: Add support for custom magic values in
parse_expression -
Improvement: Prevent creation of structures larger than
INT64_MAX - Improvement: Updated Rust version for Rust API
- Improvement: Add TypesContainer to Python UI bindings
-
Deprecation:
Section.__len__in favor ofSection.lengthas python doesn’t support returningUINT64_MAXfrom this API -
Fix: Regression in
BasicBlock.outgoing_edges/incoming_edgessource/target -
Fix:
import_library_type,import_library_objectwere implemented incorrectly -
Fix: Prevent integer overflow in
Structure::AddMemberAtOffset - Fix: Crash when post-processing empty set of lines
- Fix: Many type hint improvements
-
Fix:
Function.set_call_type_adjustment -
Fix:
GotoLabel.nameis not settable
Architectures
- Armv7/Thumb2: Many fixes that greatly improve linear sweep accuracy
-
Arm64: Fixed the
R_AARCH64_PREL64,R_AARCH64_ADD_ABS_LO12_NC,R_AARCH64_CALL26, andR_AARCH64_JUMP26relocations
Debugger
- Feature: Support overriding the current instruction pointer
- Feature: Show stack traces in the stack frame widget
- Feature: Suspend/resume threads
- Feature: List threads in other locations
- Feature: List running processes when attaching to a PID
- Feature: New action to create a stack view in a new panel
- Feature: Support using register values in the expression parser
- Improvement: Double-clicking a breakpoint navigates to its address
- Improvement: Show the end address of modules in the modules widget
- Improvement: Add jump to instruction pointer action to debugger menu
- Improvement: New setting for enabling/disabling stack annotations
- Improvement: Properly detect LLDB launch failure
-
Improvement: Rework the stack frame widget. Support navigating to
ip,sp, andfpfrom it - Improvement: Properly handle step return failures in LLDB
- Improvement: Add keybindings to the tooltip of control buttons
- Improvement: Improvement to the register Python API
- Improvement: Update the register widget after editing the register value from the Python API
- Improvement: Abort the analysis on the live view before quitting or detaching the target
-
Improvement: New setting (
debugger.aggressiveAnalysisUpdate) for whether to mark the entire binary view as modified when the target stops -
Fix: Crash when sending
stdininput usingDebuggerController.write_stdin - Fix: Not saving command line arguments into the database
- Fix: LLDB is unable to launch the target locally after disconnecting from a debug server
- Fix: Register name/value column width not wide enough in some situations
- Fix: Debugger modules list last column does not stretch
- Fix: Debugger not navigating to the entry point after relaunching the target
- Fix: Hang when repeatedly stepping very fast
- Fix: Cannot read low addresses in the debugger binary view
-
Fix: DbgEng fails to launch the target when the
.exefile name is different from the PDB file name - Fix: LLDB fails to launch ELF binary which has no dynamic loader
-
Fix:
dbgmagic variable missing in the Python console - Fix: DbgEng hangs when the engine asks the user for additional input
- Fix: Debugger hangs when the user tries to quit the target while the analysis update is still running
Enterprise
- Feature: A file changelog has been added to view changeset descriptions and their authors (similar to git log)
- Feature: Docker images are now available for hosting the Enterprise server on ARM systems
- Improvement: Various small UI improvements
- Improvement: Added missing documentation for configuring LDAP as an SSO provider
- Fix: A number of missing NULL checks are no longer missing
Miscellaneous
…and, of course, all of the usual “many miscellaneous crashes and fixes” not explicitly listed here. Check them out in our full milestone list: https://github.com/Vector35/binaryninja-api/milestone/17?closed=1
Article Link: Binary Ninja - 3.3: The Bytes Must Flow